VMware vSphere
ZenPacks.zenoss.vSphere
This ZenPack provides support for monitoring VMware vSphere. Monitoring is performed through a vCenter server using the vSphere API.
This ZenPack supersedes an earlier ZenPack named
ZenPacks.zenoss.ZenVMware. If you have ZenPacks.zenoss.ZenVMware
installed on your system, please read the Transitioning from ZenVMware section below.
The features added by this ZenPack can be summarized as follows. They are each detailed further below.
- Initial discovery and continual synchronization of relevant components.
- Performance monitoring.
- Event management.
- Optional auto-discovery and monitoring of VM guest operating systems.
- vSAN Cluster Health monitoring (on vSAN-enabled clusters only, not individual ESXi hosts)
- Service impact and root cause analysis. (Requires Zenoss Service Dynamics)
- Operational reports.
Applications Monitored: VMware vSphere (5.5, 6.0, 6.5, 6.7, 7.0, 8.0)
Commercial
This ZenPack is developed and supported by Zenoss Inc. Commercial ZenPacks are available to Zenoss commercial customers only. Contact Zenoss to request more information regarding this or any other ZenPacks. Click here to view all available Zenoss Commercial ZenPacks.
Releases
Version 4.2.1 - Download
- Released on 2025/08/20
- Requires ZenPackLib ZenPack (>=2.1.0), PythonCollector ZenPack, PropertyMonitor ZenPack (>1.0.0), EnterpriseReports ZenPack
- Compatible with Zenoss 6.8 and Zenoss Cloud
Version 4.2.0 - Download
- Released on 2024/05/01
- Requires ZenPackLib ZenPack (>=2.1.0), PythonCollector ZenPack, PropertyMonitor ZenPack (>1.0.0), EnterpriseReports ZenPack
- Compatible with Zenoss 6.7 and Zenoss Cloud
Compatibility
When monitoring vCenter with this zenpack, it is important to also verify the version of ESX/ESXi installed on the hosts it manages. The ESX hosts must be running a compatible version according to the VMware product Compatibility Matrix as well as one that has not reached End Of General Support in VMware's Lifecycle Matrix
In particular, ESX/ESXi 4.x is known to cause serious problems when monitored through a current version of vCenter.
We also recommend that monitored vSphere environments be deployed in accordance with VMware's recommendations and best practices, such as:
- Whitepaper: VMware vCenter Server Performance and Best Practices (6.0)
- Performance Best Practices for VMware vSphere 6.0
- Performance Best Practices for VMware vSphere 5.5
The vSphere ZenPack can be used to monitor VDI installations (VMware Horizon View, VMWare VDM) as they are considered regular vSphere deployments. VDI sources will not look any different from regular VMs.
Discovery
The following components will be automatically discovered through the vCenter address, username, and password you provide. The properties and relationships will be continually maintained by way of a persistent subscription to vSphere's updates API.
Datacenters
- Attributes
- Resource Pool Count
- vApp Count
- Cluster Count
- Standalone Resource Count
- Host Count
- Virtual Machine Count
- Network Count
- dvPortgroup Count
- dvSwitch Count
- Relationships
- Clusters and Standalone Compute Resources
- Resource Pools
- vApps
- VMs
- Hosts
- Networks
- dvSwitches
- dvPortgroups
- Datastores
- Disk Groups
- Cache Disks
- Capacity Disks.
Clusters and Standalone Compute Resources
- Attributes
- Resource Pool Count
- vApp Count
- Effective Host Count
- Host Count
- CPU Core Count
- CPU Thread Count
- Effective CPU
- Total CPU
- Effective Memory
- Total Memory
- Overall Status
- vSAN Cluster UUID
- vSAN Disk Type
- vSAN Version
- Relationships
- Datacenter
- Host(s)
- Resource Pools.
Resource Pools
- Attributes
- CPU Limit
- CPU Reservation
- Memory Limit
- Memory Reservation
- VM Count
- Overall Status
- Relationships
- Datacenter
- Cluster or Standalone Compute Resource
- Parent Resource Pool
- Child Resource Pools
- vApps
- VMs.
vApps
- Attributes
- CPU Limit
- CPU Reservation
- Memory Limit
- Memory Reservation
- VM Count
- Overall Status
- Relationships
- Datacenter
- Cluster or Standalone Compute Resource
- Resource Pool
- VMs.
VMs
- Attributes
- Guest Name
- UUID
- Is Template
- CPU Count
- Memory
- Operating System Type
- MAC Addresses
- Overall Status
- Power State
- Connection State
- VMware Tools Version
- VMware Tools Status
- Hardware Version
- Committed Storage
- Uncommitted Storage
- IP
- DNS Name
- Inventory Path
- Snapshots
- Number of Snapshots
- Policy Compliance Status
- vSAN VM UUID
- Relationships
- Datacenter
- Resource Pool or vApp
- vNICs
- Host
- Datastores
- Vdisks.
vNICs
- Attributes
- MAC Address
- Relationships
- VM
- Network or dvPortgroup.
Hosts
- Attributes
- Overall Status
- Connection State
- Power State
- Hostname
- Management IP Addresses
Hosts
- Attributes
- Overall Status
- Connection State
- Power State
- Hostname
- Management IP Addresses
- Total Memory
- In Maintenance Mode
- Hypervisor Version
- Vendor
- Model
- UUID
- CPU Model
- CPU Speed
- CPU Package Count
- CPU Core Count
- VM Count
- Powered On VM Count
- Suspended VM Count
- Powered Off VM Count
- vSAN Node UUID
- vSAN Fault Domain
- vSAN Disk Type
- vSAN Health Status
- vSAN Node State
- vSAN Master State
- Relationships
- Datacenter
- Cluster or Standalone Compute Resource
- VMs
- Host NICs
- Datastores
- LUNs
- Disk Groups
- Cache Disks
- Capacity Disks
Host NICs
- Attributes
- MAC Address
- Link Status
- Link Speed
- Relationships
- Host
Networks
- Attributes
- Accessible?
- IP Pool Name
- VM Count
- Relationships
- Datacenter
- Attached vNICs
dvSwitches
- Attributes
- UUID
- Type
- Host Count
- Relationships
- Datacenter
- dvPortgroups
dvPortgroups
- Attributes
- Accessible?
- IP Pool Name
- VM Count
- Key UUID
- Relationships
- Datacenter
- dvSwitch
- NSX Virtual Switch
- Attached vNICs
Datastores
- Attributes
- Datastore Type
- Capacity
- Free Space
- Uncommitted Space
- URL
- NAS Remote Host
- NAS Remote Path
- NAS Username
- Local Filesystem Path
- Snapshots
- Number of Snapshots
- Relationships
- Datacenter
- LUNs
- Attached Hosts
- Attached VMs
- Storage Provider
- Vdisks
- Disk Groups
RDMs
- Attributes
- Relationships
- VM
- LUN
- Host
- Storage Provider
LUNs
- Attributes
- LUN Name
- LUN Key
- LUN ID
- Operational Status
- Type
- Vendor
- Model
- Relationships
- Host
- Datastores
- Storage Provider
Vdisks
- Attributes
- vDisk Id
- File Name
- Capacity
- vSAN Disk Object
- Relationships
- Datastore
- VM
Note
Vdisks are not modeled by default and automatically discovered
only if zVSphereModelVdisks property is set to true.
Disk Groups (vSAN)
- Attributes
- Disk Group UUID
- Disk Group Type
- Relationships
- Datacenter
- Host
- Datastore
- Capacity Disks
- Cache Disks
Note
Only for vSAN enabled configurations, with zVSphereModelVSAN set to true.
Capacity and Cache Disks (vSAN)
-
Attributes
- Disk UUID
- SSD
- Capacity
- Display Name
- Disk Key
- Vendor
- Model
-
Relationships
- Datacenter
- Host
- Disk Group
Note
Only for vSAN enabled configurations, with zVSphereModelVSAN set to true.
Note
Current version of vSphere ZP doesn't support Datastore Clusters discovery and monitoring.
Performance Monitoring
The following metrics will be collected every 5 minutes by default. Any other vSphere metrics can also be collected by adding them to the appropriate monitoring template.

Clusters
- cpuUsagemhz: cpu.usagemhz.AVERAGE
- cpuUsage: cpu.usage.AVERAGE
- memConsumed: mem.consumed.AVERAGE
- memBalloon: mem.vmmemctl.AVERAGE
- memTotal: Cluster.totalMemory (Property)
- effectiveMemory: Cluster.effectiveMemory (Modeled)
- effectiveCpu: Cluster.effectiveCpu (Modeled)
Clusters (vSAN)
- cpuUsagemhz: cpu.usagemhz.AVERAGE
- cpuUsage: cpu.usage.AVERAGE
- memConsumed: mem.consumed.AVERAGE
- memBalloon: mem.vmmemctl.AVERAGE
- memTotal: Cluster.totalMemory (Property)
- vsanCapacity:
- totalCapacity
- freeCapacity
- usedCapacity
- usedCapacityPct
- vmswapUsed
- checksumOverheadUsed
- vdiskUsed
- fileSystemOverheadUsed
- namespaceUsed
- statsdbUsed
- vmemUsed
- otherUsed (Python)
- vsanVersions (Python)
- statsBackEnd:
- oio
- congestion
- iopsRead
- iopsRecWrite
- iopsResyncRead
- iopsWrite
- latAvgResyncRead
- latencyAvgRead
- latencyAvgRecWrite
- latencyAvgWrite
- throughputRead
- throughputRecWrite
- throughputWrite
- tputResyncRead (VSAN Performance)
- statsFrontEnd:
- congestion
- oio
- iopsRead
- iopsWrite
- latencyAvgRead
- latencyAvgWrite
- throughputRead
- throughputWrite (VSAN Performance)
- effectiveMemory: summary.effectiveMemory (Modeled)
- effectiveCpu: summary.effectiveCpu (Modeled)
Datastores
- datastoreCapacity: Datastore.capacity (Property)
- datastoreUsed: Datastore.usedSpace (Property)
- datastoreUsedPercent: Datastore.used_pct (Property) - disabled by default
- datastoreUncommittedPercent: Datastore.uncommitted_pct (Property)
- datastoreUncommitted: Datastore.uncommitted (Modeled)
- datastoreFreeSpace: Datastore.freeSpace (Modeled)
- datastoreRead: Datastore.numberReadAveraged.AVERAGE
- datastoreWrite: Datastore.numberWriteAveraged.AVERAGE
- snapshotsSize: Datastore.snapshots_size (Property)
Endpoints
- perfCollectionTotalTime: perfCollectionTotalTime
- perfCollectionRetryTime: perfCollectionRetryTime
- perfCollectionRecoveryTime: perfCollectionRecoveryTime
- perfCollectionTotalQueries: perfCollectionTotalQueries
- perfCollectionRetryQueries: perfCollectionRetryQueries
- perfCollectionRecoveryQueries: perfCollectionRecoveryQueries
- perfCollectionTotalCount: perfCollectionTotalCount
- perfCollectionDisabledCount: perfCollectionDisabledCount
- perfCollectionTimeSinceLast: perfCollectionTimeSinceLast
- perfCollectionQuerySUCCESS: perfCollectionQuerySUCCESS
- perfCollectionQueryERROR: perfCollectionQueryERROR
- perfCollectionQueryTIMEOUT: perfCollectionQueryTIMEOUT
- perfCollectionQueryNO_DATA: perfCollectionQueryNO_DATA
Hosts
- cpuReservedcapacity: cpu.reservedCapacity.AVERAGE
- cpuUsage: cpu.usage.MAXIMUM
- cpuUsagemhz: cpu.usagemhz.MAXIMUM
- diskUsage: disk.usage.MAXIMUM
- memUsage: mem.usage.MAXIMUM
- memActive: mem.active.MAXIMUM
- memBalloon: mem.vmmemctl.AVERAGE
- memConsumed: mem.consumed.AVERAGE
- memGranted: mem.granted.MAXIMUM
- memSwapused: mem.swapused.MAXIMUM
- memTotal: HostSystem.totalMemory (Property)
- sysUpTime: sys.uptime.LATEST
- vmCount: HostSystem.vm_count (Property)
- vmPoweredCount: HostSystem.powered_vm_count (Property)
- vmSuspendedCount: HostSystem.suspended_vm_count (Property)
- vmUnpoweredCount: HostSystem.unpowered_vm_count (Property)
- vsanNodeState (Python)
Hosts (vSAN)
- cpuReservedcapacity: cpu.reservedCapacity.AVERAGE
- cpuUsage: cpu.usage.MAXIMUM
- cpuUsagemhz: cpu.usagemhz.MAXIMUM
- diskUsage: disk.usage.MAXIMUM
- memUsage: mem.usage.MAXIMUM
- memActive: mem.active.MAXIMUM
- memBalloon: mem.vmmemctl.AVERAGE
- memConsumed: mem.consumed.AVERAGE
- memGranted: mem.granted.MAXIMUM
- memSwapused: mem.swapused.MAXIMUM
- memTotal: HostSystem.totalMemory (Property)
- sysUpTime: sys.uptime.LATEST
- vmCount: HostSystem.vm_count (Property)
- vmPoweredCount: HostSystem.powered_vm_count (Property)
- vmSuspendedCount: HostSystem.suspended_vm_count (Property)
- vmUnpoweredCount: HostSystem.unpowered_vm_count (Property)
- vsanNodeState (Python)
- statsBackEnd:
- oio
- congestion
- readCongestion
- writeCongestion
- recWriteCongestion
- resyncReadCongestion
- iops
- iopsRead
- iopsRecWrite
- iopsResyncRead
- iopsWrite
- latencyAvg
- latencyAvgRead
- latencyAvgWrite
- latAvgResyncRead
- latencyAvgRecWrite
- throughput
- throughputRead
- throughputWrite
- tputResyncRead (VSAN Performance)
- statsFrontEnd:
- oio
- congestion
- readCongestion
- writeCongestion
- iops
- iopsRead
- iopsWrite
- latencyAvg
- latencyAvgRead
- latencyAvgWrite
- throughput
- throughputRead
- throughputWrite (VSAN Performance)
LUNs
- diskRead: disk.read.AVERAGE
- diskReadRequests: disk.numberRead.SUMMATION
- diskWrite: disk.write.AVERAGE
- diskWriteRequests: disk.numberWrite.SUMMATION
Host Physical NICs
- nicRx: net.received.AVERAGE
- nicTx: net.transmitted.AVERAGE
Resource Pools
- cpuUsagemhz: cpu.usagemhz.AVERAGE
- cpuEntitlement: cpu.cpuentitlement.LATEST
- memConsumed: mem.consumed.AVERAGE
- memBalloon: mem.vmmemctl.AVERAGE
- memOverhead: mem.overhead.AVERAGE
- memEntitlement: mem.mementitlement.LATEST
- memoryLimit: ResourcePool.memoryLimit (Modeled)
- memoryReservation: ResourcePool.memoryReservation (Modeled)
VMs
- cpuUsageAvg: cpu.usage.AVERAGE
- cpuUsagemhz: cpu.usagemhz.AVERAGE
- memUsage: mem.usage.AVERAGE
- memConsumed: mem.consumed.AVERAGE
- memOverhead: mem.overhead.AVERAGE
- diskUsage: disk.usage.AVERAGE
- datastoreReadLatency: datastore.totalReadLatency.AVERAGE
- datastoreWriteLatency: datastore.totalWriteLatency.AVERAGE
- netUsage: net.usage.AVERAGE
- netReceived: net.received.AVERAGE
- netTransmitted: net.transmitted.AVERAGE
- snapshotsSize: VirtualMachine.snapshots_size (Property)
- storageCommitted: VM.storageCommitted (Modeled)
- storageUncommitted: VM.storageUncommitted (Modeled)
VMs (vSAN)
- cpuUsageAvg: cpu.usage.AVERAGE
- cpuUsagemhz: cpu.usagemhz.AVERAGE
- memUsage: mem.usage.AVERAGE
- memConsumed: mem.consumed.AVERAGE
- memOverhead: mem.overhead.AVERAGE
- diskUsage: disk.usage.AVERAGE
- datastoreReadLatency: datastore.totalReadLatency.AVERAGE
- datastoreWriteLatency: datastore.totalWriteLatency.AVERAGE
- netUsage: net.usage.AVERAGE
- netReceived: net.received.AVERAGE
- netTransmitted: net.transmitted.AVERAGE
- snapshotsSize: VirtualMachine.snapshots_size (Property)
- stats:
- iopsRead
- iopsWrite
- latencyRead
- latencyWrite
- throughputRead
- throughputWrite (VSAN Performance)
- vsanPoliciesCompliance: status (Python)
- storageCommitted: VM.storageCommitted (Modeled)
- storageUncommitted: VM.storageUncommitted (Modeled)
Vdisks
- read: virtualDisk.read.AVERAGE
- write: virtualDisk.write.AVERAGE
- totalReadLatency: virtualDisk.totalReadLatency.AVERAGE
- totalWriteLatency: virtualDisk.totalWriteLatency.AVERAGE
vSAN Cache Disks
- iopsDevRead
- iopsDevWrite
- latencyDevRead
- latencyDevWrite
- latencyDevGAvg
- latencyDevDAvg
- throughputDevRead
- throughputDevWrite (VSAN Performance)
vSAN Capacity Disks
- capacityUsed
- iopsDevRead
- iopsDevWrite
- iopsRead
- iopsWrite
- latencyDevRead
- latencyDevWrite
- latencyRead
- latencyWrite
- latencyDevGAvg
- latencyDevDAvg
- throughputDevRead
- throughputDevWrite (VSAN Performance)
vSAN Disk Groups
- capacity
- capacityReserved
- capacityUsed
- wbSize
- rcSize
- compCongestion
- iopsCongestion
- slabCongestion
- ssdCongestion
- logCongestion
- memCongestion
- iopsRead
- iopsWrite
- iopsRcRead
- iopsWbWrite
- iopsWbRead
- iopsRcWrite
- latencyAvgRead
- latencyAvgWrite
- latencyRcRead
- latencyWbWrite
- latencyRcWrite
- latencyWbRead
- oioRecWrite
- oioWrite
- oioRecWriteSize
- oioWriteSize
- latencySched
- latencySchedQueueMeta
- latencySchedQueueNS
- latencySchedQueueRec
- latencySchedQueueVM
- iopsSched
- iopsSchedQueueMeta
- iopsSchedQueueNS
- iopsSchedQueueRec
- iopsSchedQueueVM
- throughputSched
- throughputSchedQueueMeta
- throughputSchedQueueNS
- throughputSchedQueueRec
- throughputSchedQueueVM
- latResyncRead
- latResyncReadDecom
- latResyncReadFixComp
- latResyncReadPolicy
- latResyncReadRebalance
- latResyncWrite
- latResyncWriteDecom
- latResyncWriteFixComp
- latResyncWritePolicy
- latResyncWriteRebalance
- iopsResyncRead
- iopsResyncReadDecom
- iopsResyncReadFixComp
- iopsResyncReadPolicy
- iopsResyncReadRebalance
- iopsResyncWrite
- iopsResyncWriteDecom
- iopsResyncWriteFixComp
- iopsResyncWritePolicy
- iopsResyncWriteRebalance
- tputResyncRead
- tputResyncReadDecom
- tputResyncReadFixComp
- tputResyncReadPolicy
- tputResyncReadRebalance
- tputResyncWrite
- tputResyncWriteDecom
- tputResyncWriteFixComp
- tputResyncWritePolicy
- tputResyncWriteRebalance
- throughputRead
- throughputWrite (VSAN Performance)
In addition, any other metric exposed by vSphere may be added to a Zenoss monitoring template. This must be done cautiously, however. It is critical to only add metrics that are applicable to the component that the template is bound to, and which are supported by the VMware instances you are monitoring.
Because Zenoss batches multiple performance queries together, adding an unsupported metric may cause unrelated performance graphs to break. The 'Test' function must be used to verify that any newly added datasource will work correctly.
Event Management

- Alarm
- Event
- ExtendedEvent
- EventEx
Various information encoded in these event classes will be used to automatically determine as best as possible the following Zenoss event fields.
Standard Zenoss Event Fields
- device (set to VMware vSphere Endpoint device in the /vSphere device class)
- component
- summary
- severity
- eventClassKey (for mapping specific event types)
- eventKey (for de-duplication and auto-clear fingerprinting)
Additional Event Fields
- description
Events collected through this mechanism will be timestamped based on the time they occurred within vCenter. Not by the time at which they were collected.
Control Of Events Polling
There are two zProperties to control events polling:
zVSphereEventTypesis a list of event types to control which events are collected. If this zProperty is empty then all events will be collected from vSphere. May contain the following values:- Error
- Warning
- Information
- User
zVSphereAlarmSeveritiesis a list of alarm severities (colors) to control which alarms are collected. If this zProperty is empty then all alarms will be collected from vSphere. May contain the following values:- GREEN
- YELLOW
- RED
Alarm severities are mapped to the event classes as follows:
- GREEN — Clear
- YELLOW — Warning
- RED — Error
Guest Device Discovery
You can optionally configure each monitored vSphere account to attempt to discover and monitor the guest Linux or Windows operating systems running within each VM. This requires that your Zenoss system has the network and server access it needs to monitor the guest operating system.
The guest operating system devices' life-cycle optionally might be managed along with the VM. For example, the guest operating system device is set to a decommissioned production state when the VM is stopped, and the guest operating system device is deleted when the VM is destroyed.
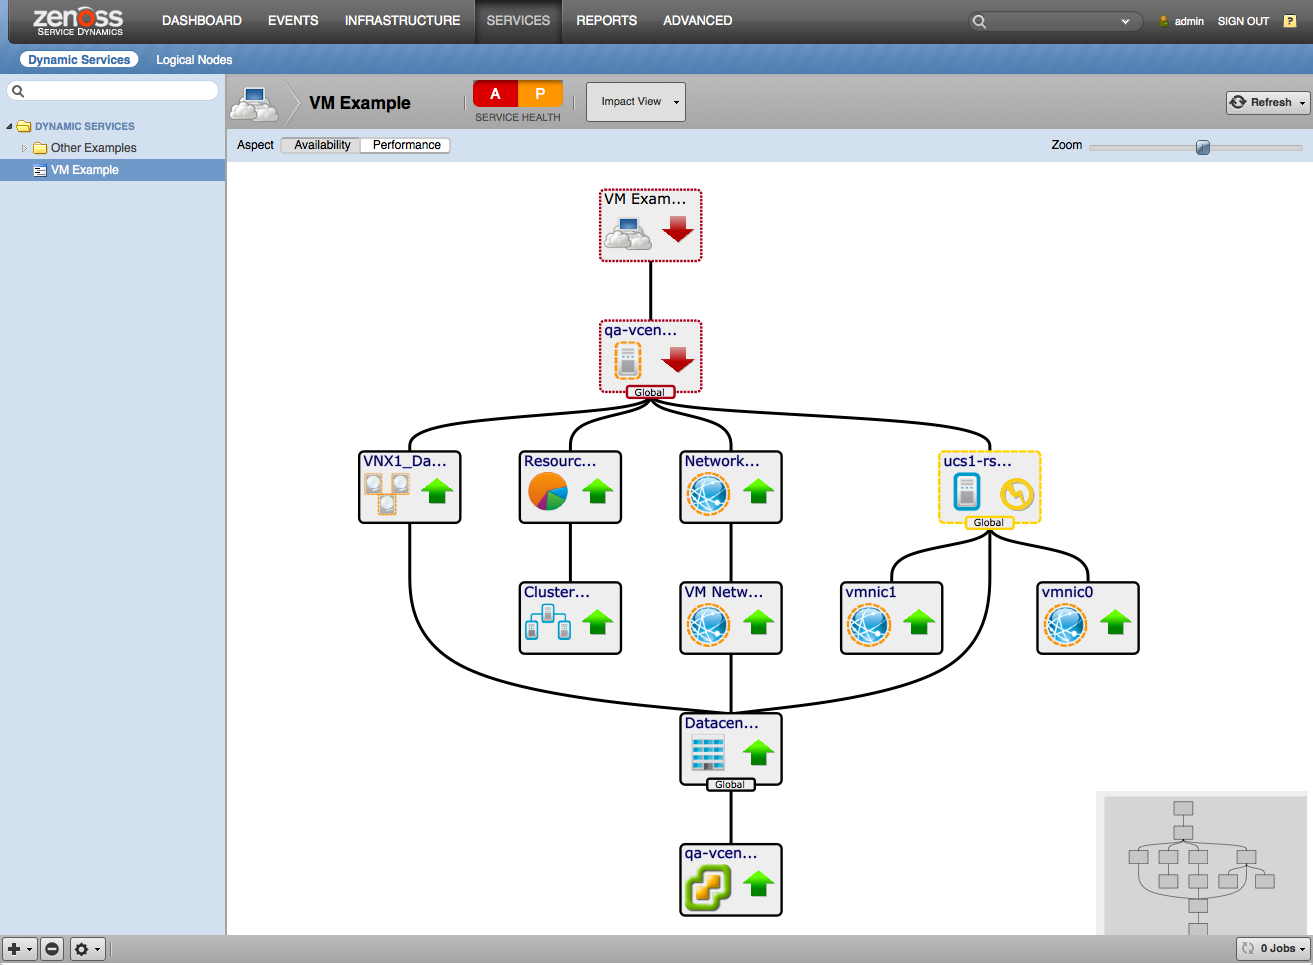
Service Impact and Root Cause Analysis
When combined with the Zenoss Service Dynamics product, this ZenPack adds built-in service impact and root cause analysis capabilities for services running on VMware vSphere. The service impact relationships shown in the diagram and described below are automatically added. These will be included in any services that contain one or more of the explicitly mentioned components.
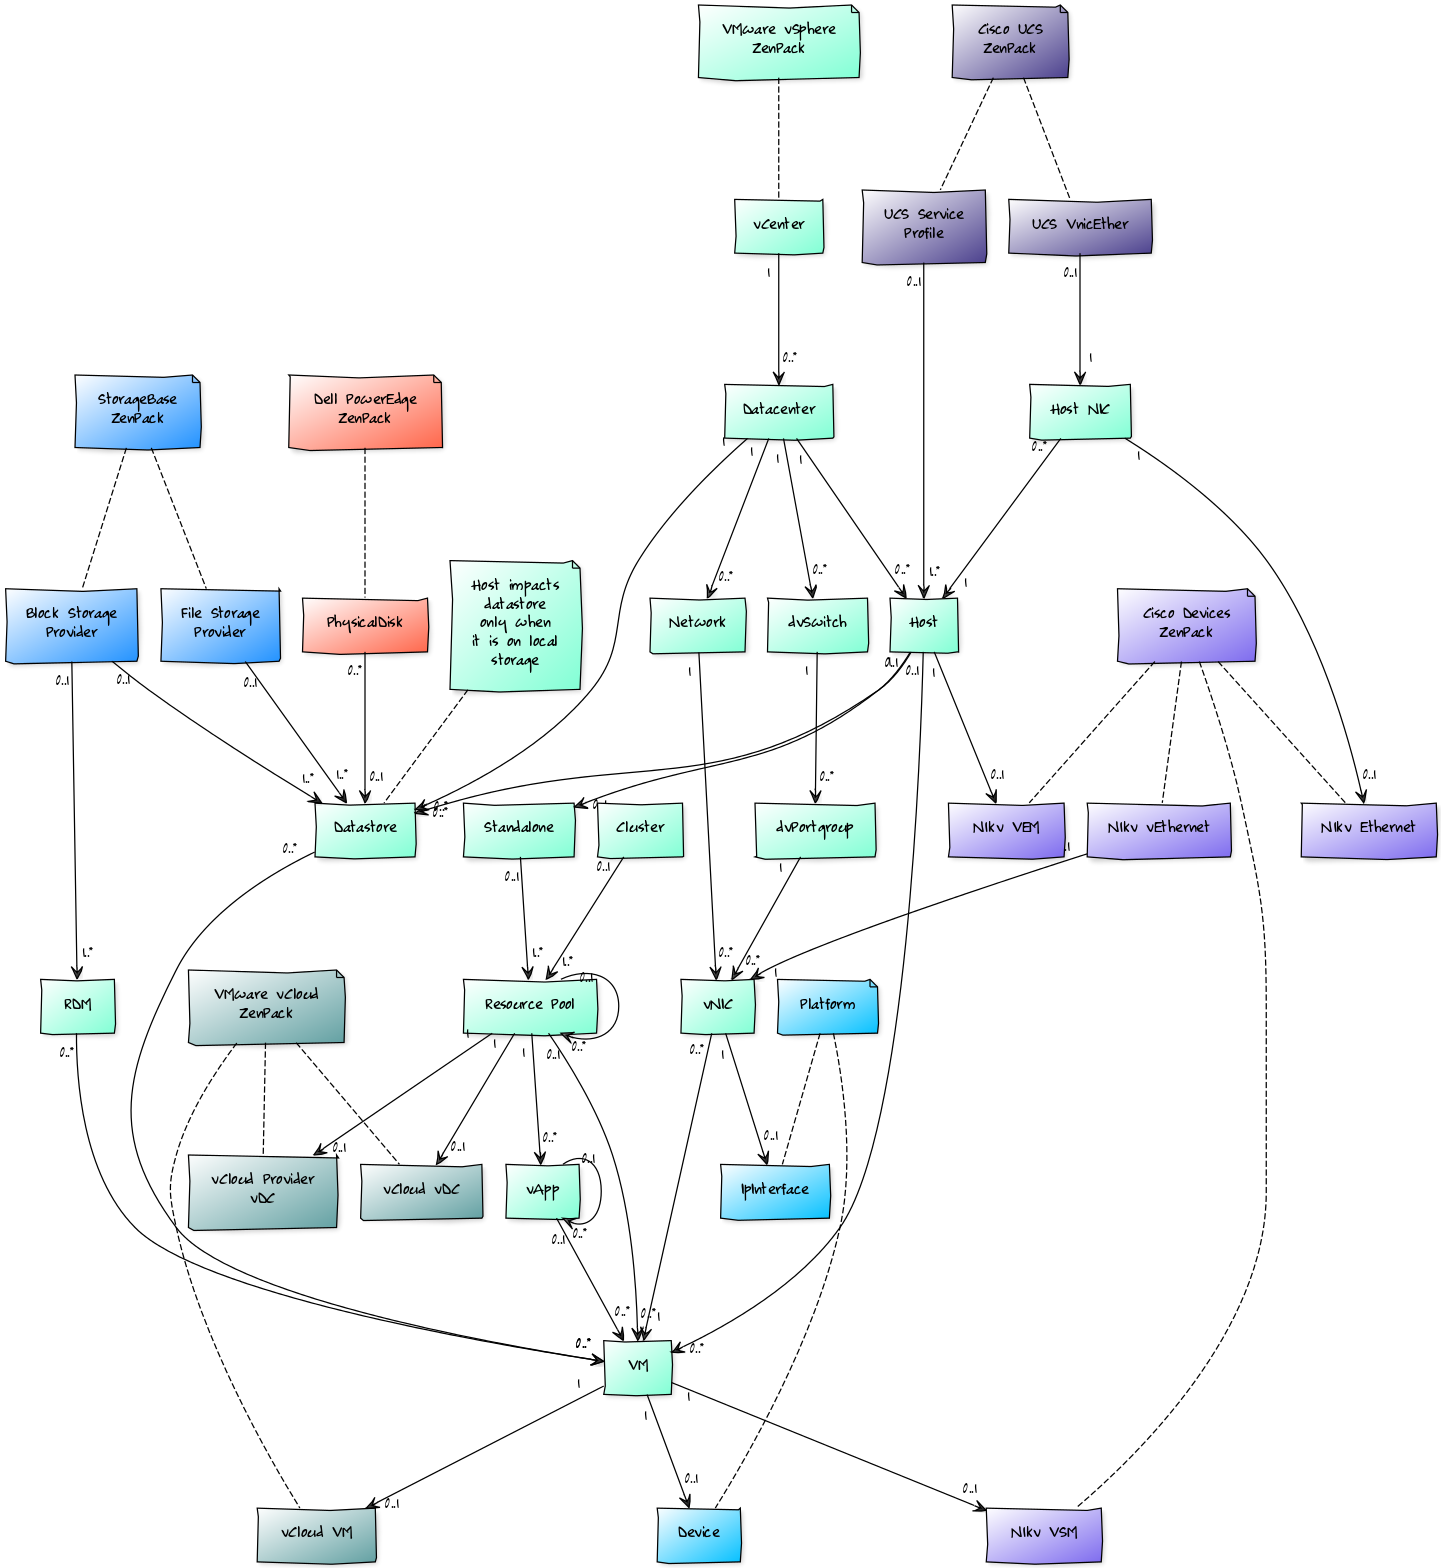
Internal Impact Relationships
- vCenter access failure impacts all datacenters.
- Datacenter failure impacts all related hosts, networks, dvSwitches, dvPortgroups, and datastores.
- Host failure impacts the standalone compute resource and resident VMs.
- Host NIC failure impacts the related host.
- Network failure impacts related vNICs.
- dvSwitch failure impacts related dvPortgroups.
- dvPortgroup failure impacts related vNICs.
- Datastore failure impacts attached VMs.
- Cluster or standalone compute resource failure impacts related resource pools and vApps.
- Resource pool failure impacts child resource pools, related vApps, and related VMs.
- vApp failure impacts related VMs.
- vNIC failure impacts the related VM.
External Impact Relationships
- vNIC failure impacts guest operating system device's related NIC.
- VM failure impacts guest operating system devices.
- NAS file storage providers impact-related datastores.
- SAN block storage providers impact-related datastores.
- Resource pool failure impacts related vCloud provider and organizational VDCs.
- VM failure impacts related vCloud VM.
- Cisco UCS vNIC failure impacts related host NIC.
- Cisco UCS service profile failure impacts related host.
- VM failure impacts Cisco Nexus 1000V VSM running as a guest.
- Host failure impacts related Cisco Nexus 1000V VEM.
- Host NIC failure impacts related Cisco Nexus 1000V Ethernet uplink.
- Cisco Nexus 1000V vEthernet impacts related vNIC.
- Dell PowerEdge Physical Disk impacts related Datastore.
Most of the impacts described above follow the default policy of a node being in the worst state of the nodes that impact it. For example, a datacenter failure will imply that all related hosts are also failed. In some cases, this is not appropriate and custom policies are used.
Custom Impact Policies
- vCenter access failure will only cause-related datacenters to be ATRISK because they're probably still functioning but may be unmanageable.
- Host NIC failure will only imply a host DOWN if all of the host's NICs have failed. If a subset has failed the host will be implicitly ATRISK.
- Host failure will only imply a cluster DOWN if all of the cluster's hosts have failed. If a subset has failed the cluster will be implicitly ATRISK.
- vNIC failure will only imply a VM DOWN if all of the VM's vNICs have failed. If a subset has failed the VM will be implicitly ATRISK.
- Datastore failure will only imply a VM DOWN if all of the VM's datastores have failed. If a subset has failed the VM will be implicitly DEGRADED.
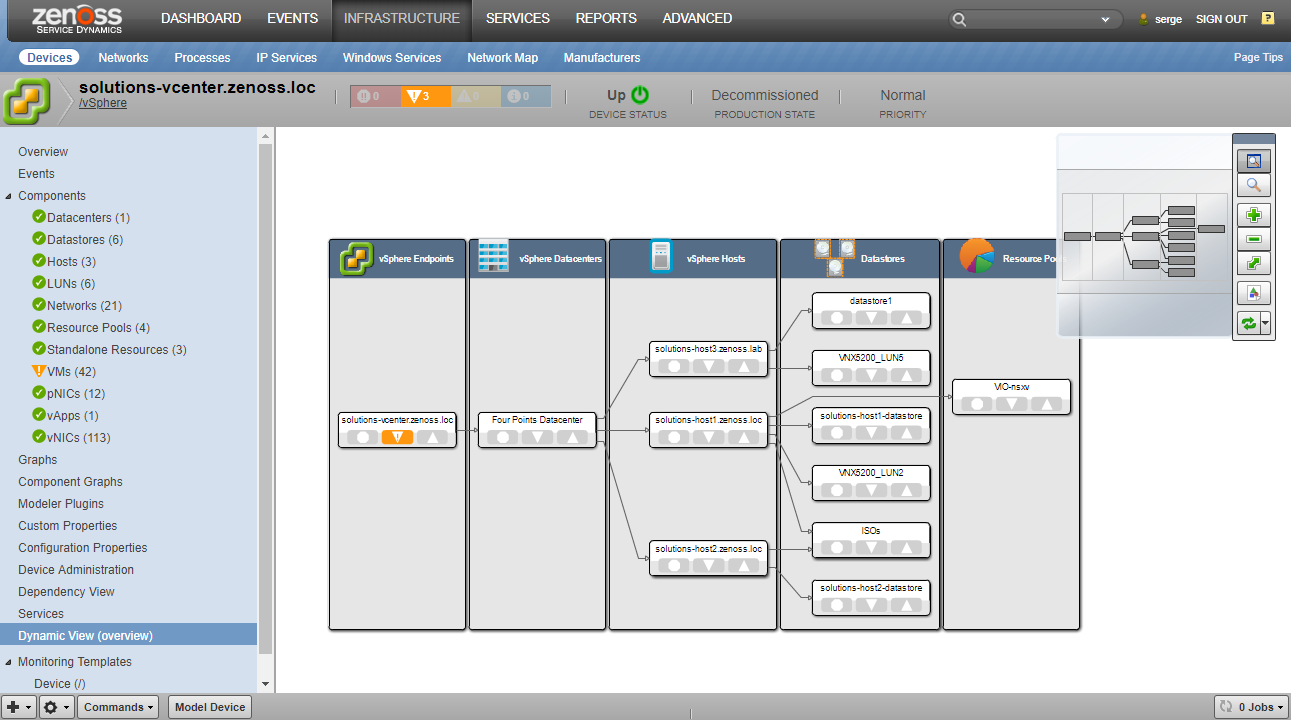
Dynamic View on Device Level
To provide a high-level overview of modeled vSphere device, on device-level a separate Dynamic View diagram is provided. To keep the resulting diagram in reasonable size it includes only the next components:
- vSphere Endpoint
- Datacenters
- Clusters
- Hosts
- Datastores
- Resource Pools
- dvSwitches
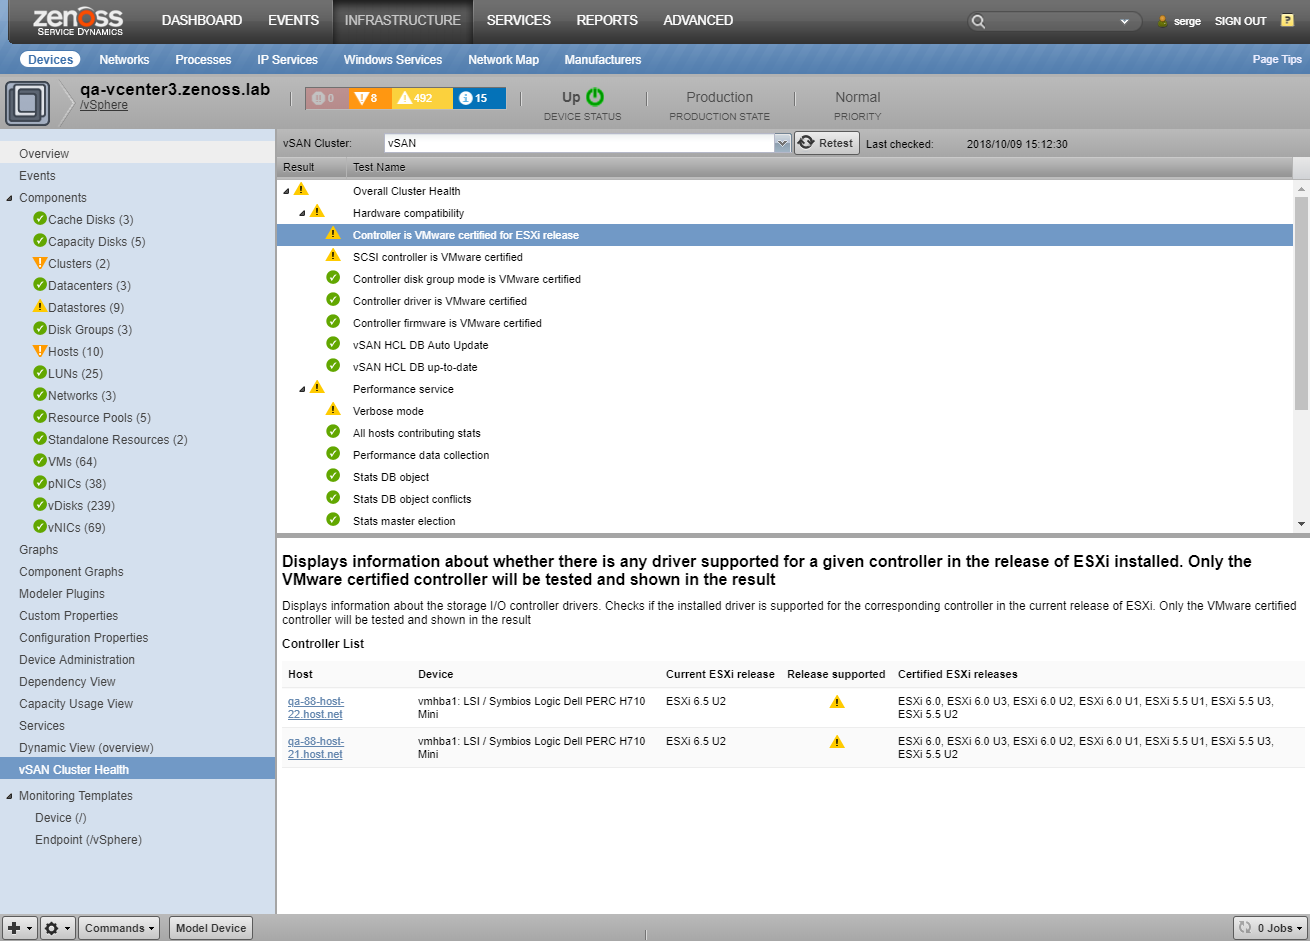
vSAN Cluster Health
vSAN has self-monitoring for a large number of configuration, performance, and availability issues. These tests are run periodically by vSphere, and the results are cached and made available. For vSphere devices with vSAN enabled clusters, this information is provided on the "vSAN Cluster Health" screen.
To view these results, choose a cluster from the combo box on the top, and cached results will be provided. When a test is selected, details will be available on the bottom part of the screen.
To run the health checks and update the results immediately, click the "Retest" button.
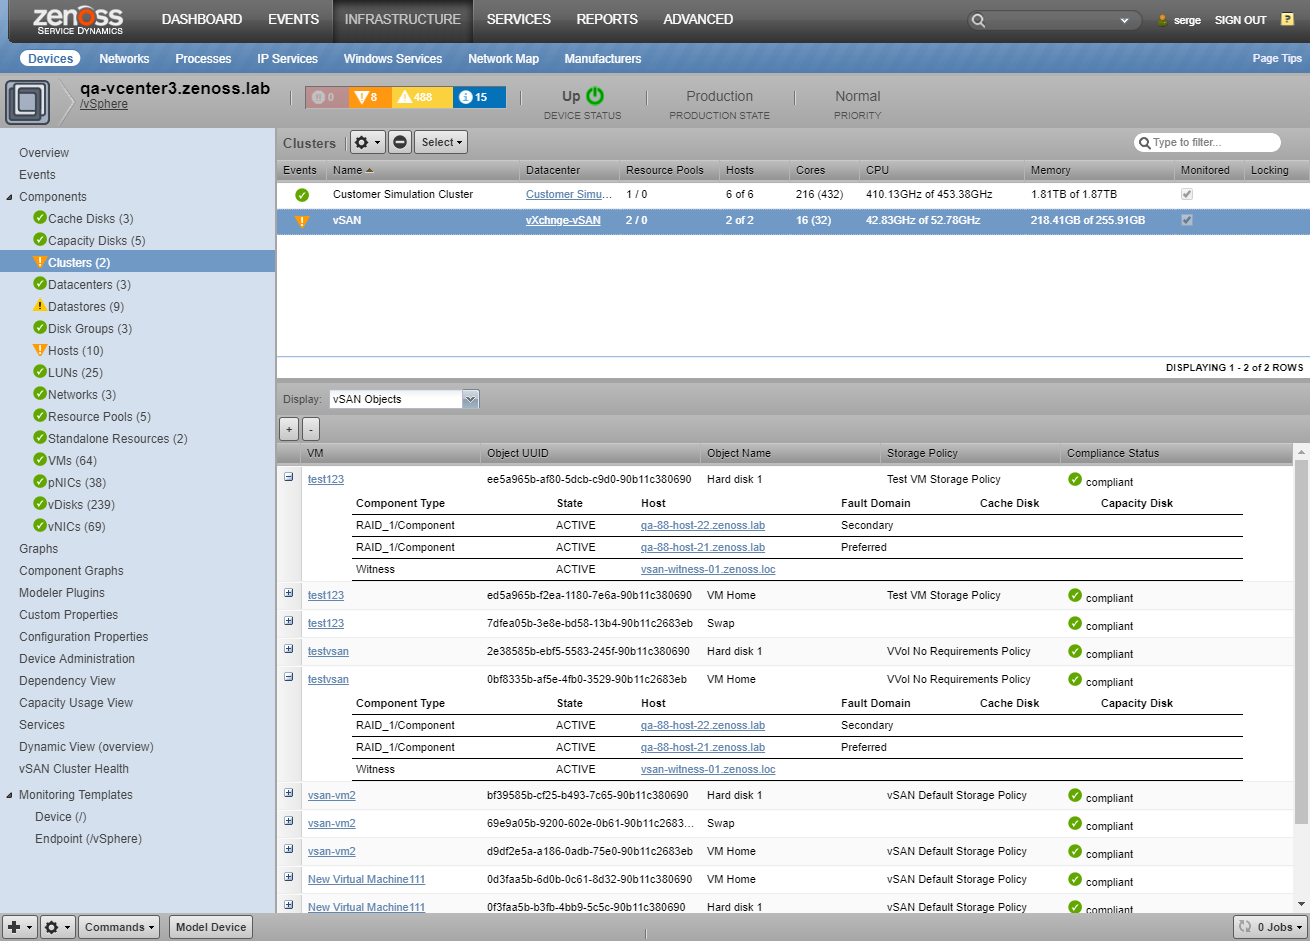
vSAN Objects
For vSAN Clusters and VMs located in them, there is a screen with information about vSAN objects related to components. This screen provides information about the object's UUID, Name, Storage Policy attached, and Compliance Status. Also for each vSAN object, its physical location is provided.
Operational Reports
The following operational reports are included with this ZenPack. They can be found in the vSphere report organizer.

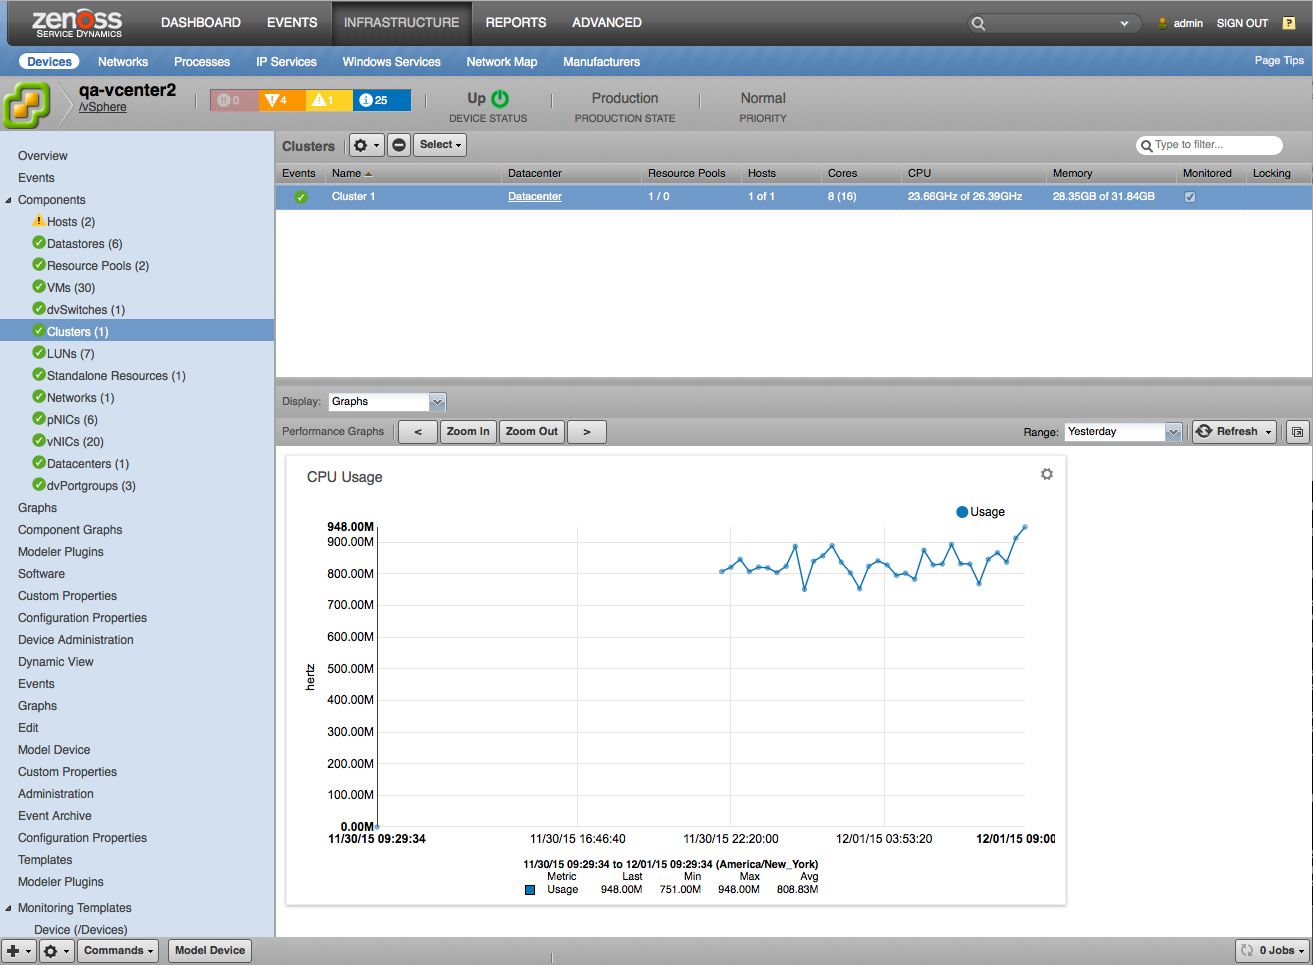
Clusters: Shows all clusters, with the count of VMs (total and powered on), hosts, and CPU/Memory utilization within each cluster.
Datastores: Shows all datastores, with the number of connected VMs (total and powered on) and the disk space available and consumed on each datastore.
Hosts: Shows all hosts, with the count of VMs (total and powered on), hosts, and CPU/Memory reservation and utilization on each host.
LUNs: Shows all hosts and their LUNS, with LUN details.
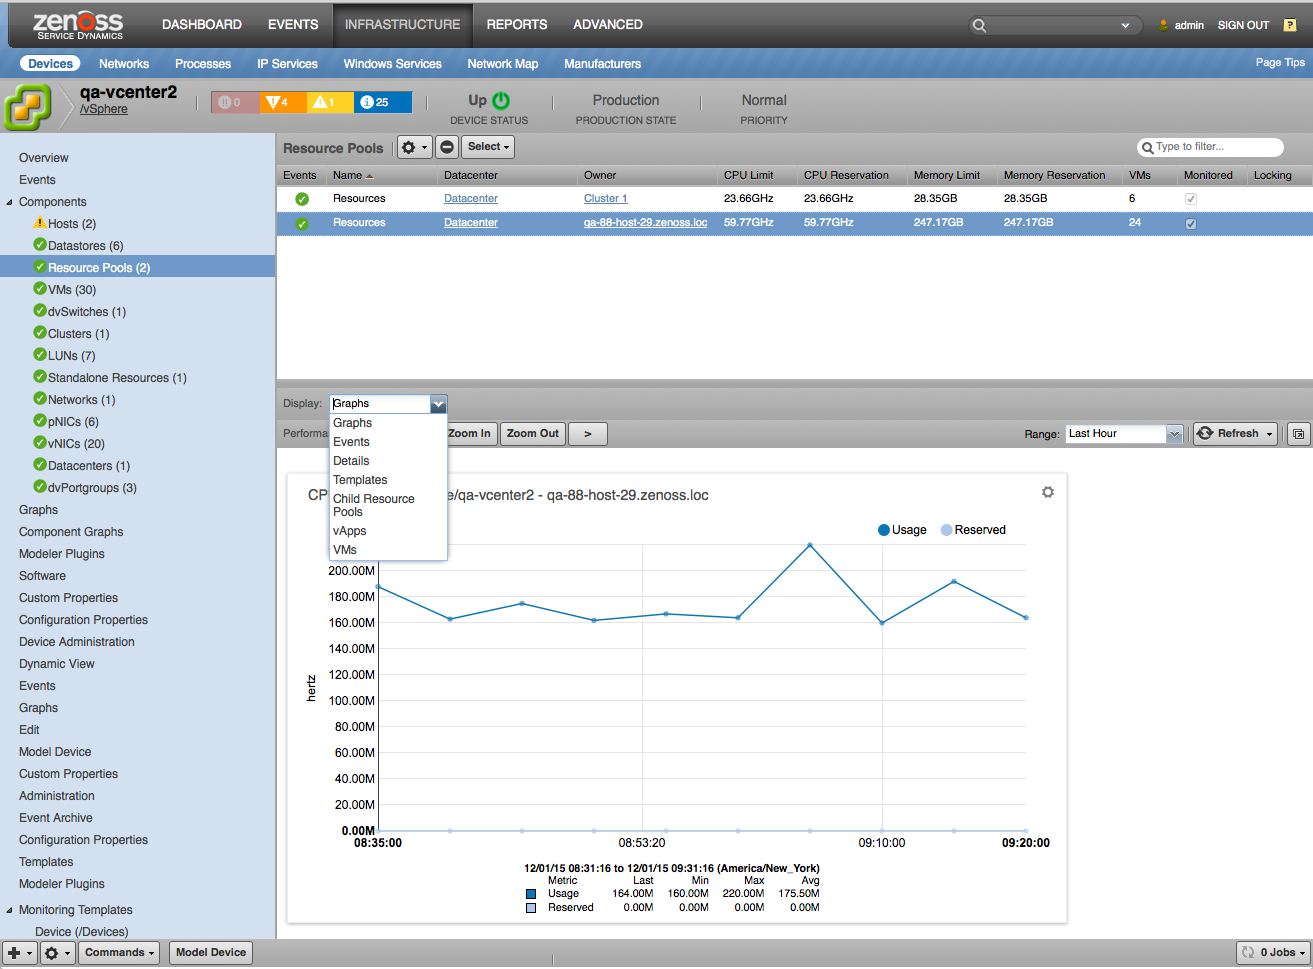
Resource Pools: Shows all resource pools, their CPU and memory allocations, and usage.
VM to Datastore: Shows VMs mapped to datastores.
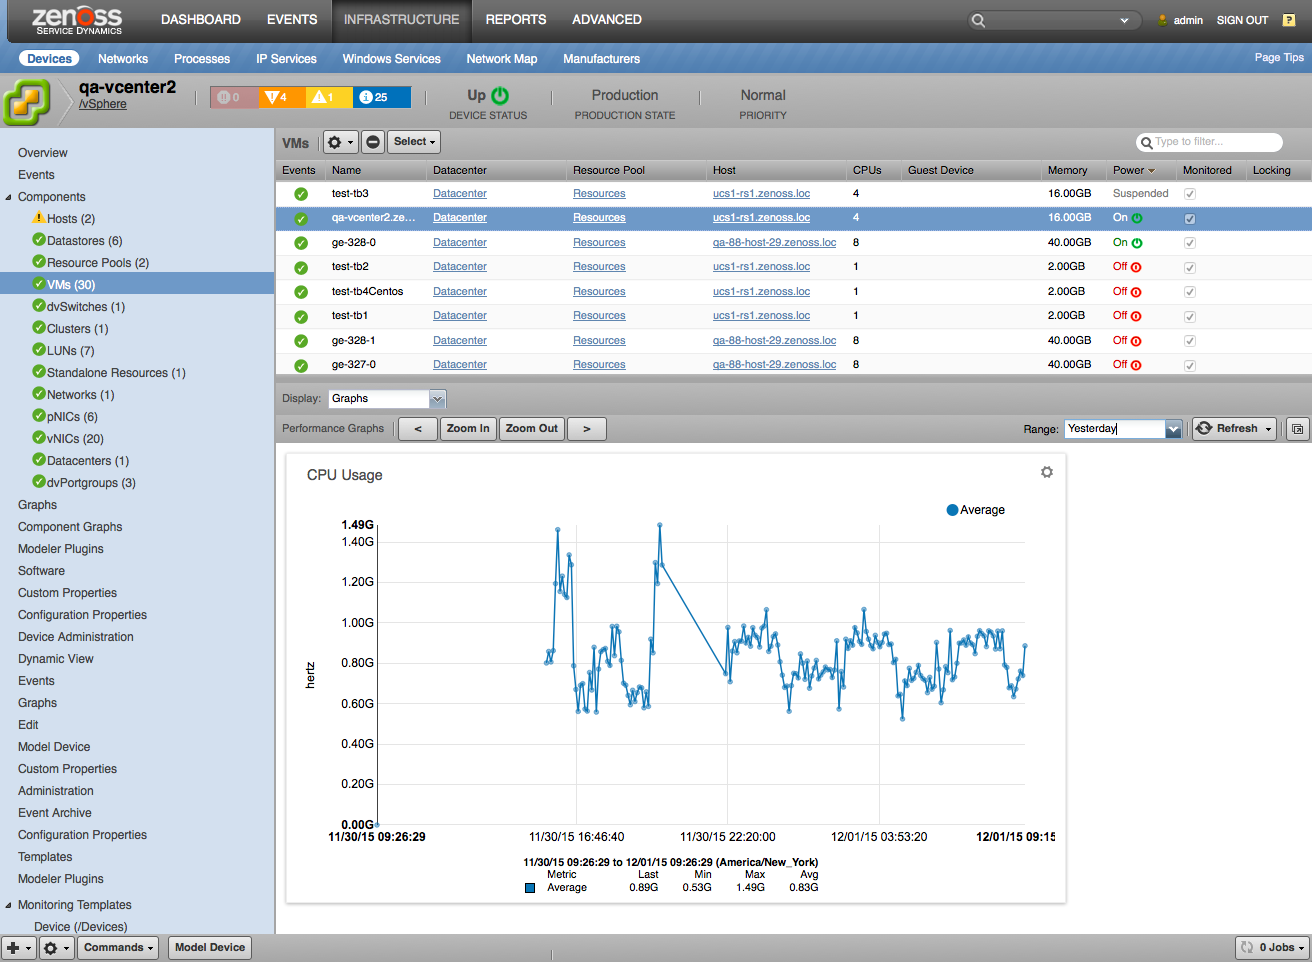
VMs: Shows all VMs, their operating system, CPU and memory utilization, snapshots size, and which host/cluster they reside within. VMs Snapshots are shown in the submenu as a list with size and date of creation.
VMware Utilization: Provides a summary of VMs, CPU, memory, and disk utilization over a specified time interval, broken down by the host.
Usage
Adding vSphere Endpoint
Use the following steps to start monitoring vSphere using the Zenoss web interface.
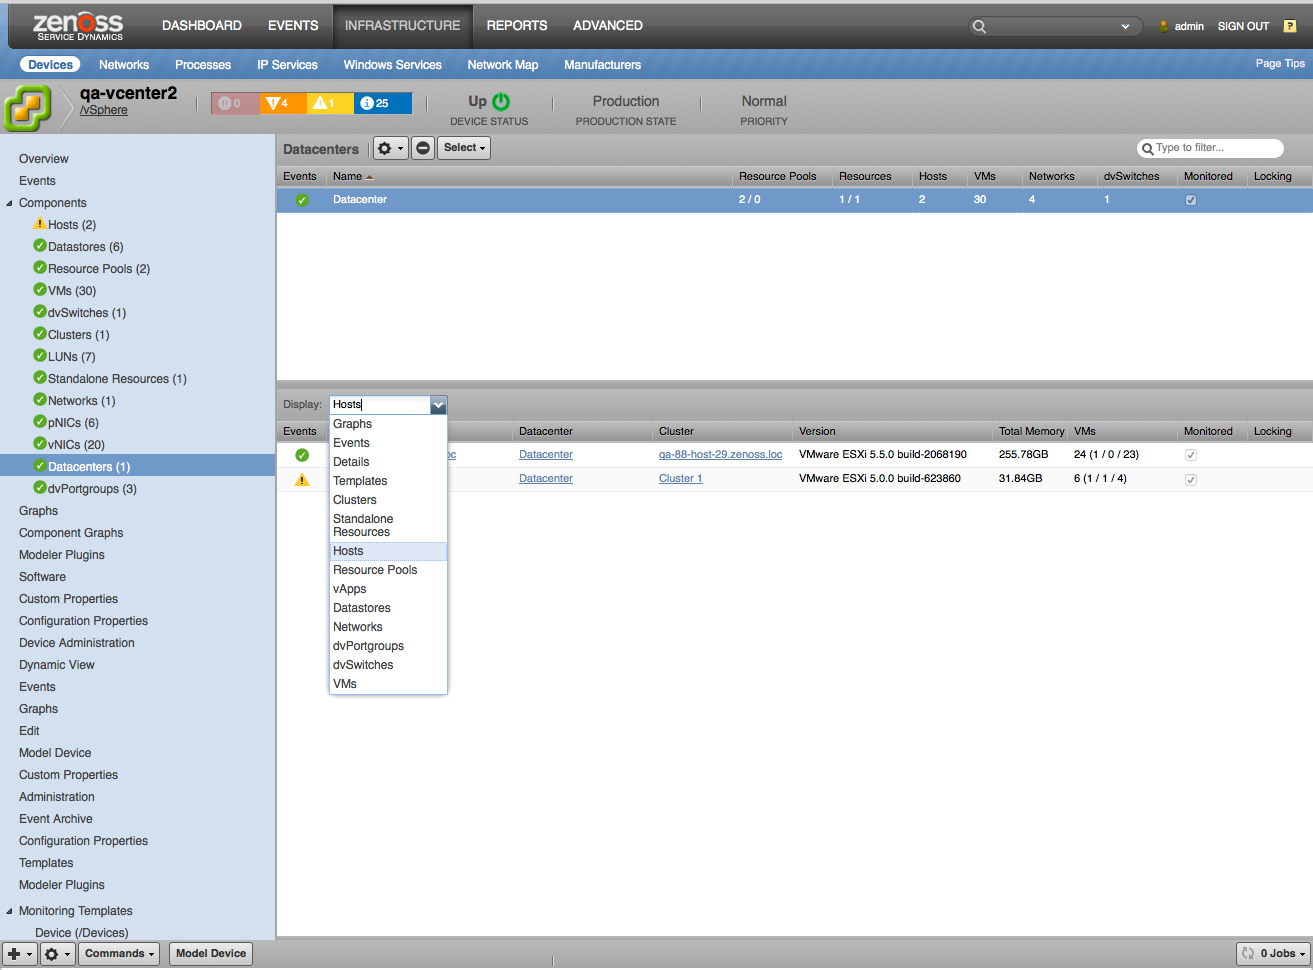
- Navigate to the Infrastructure page.
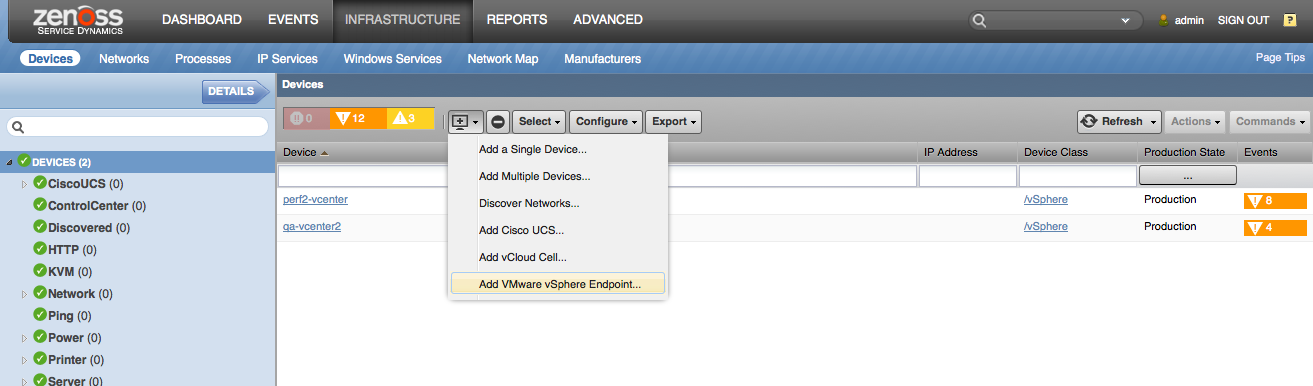
- Choose Add VMware vSphere Endpoint from the add device button.
- Fill out the form.
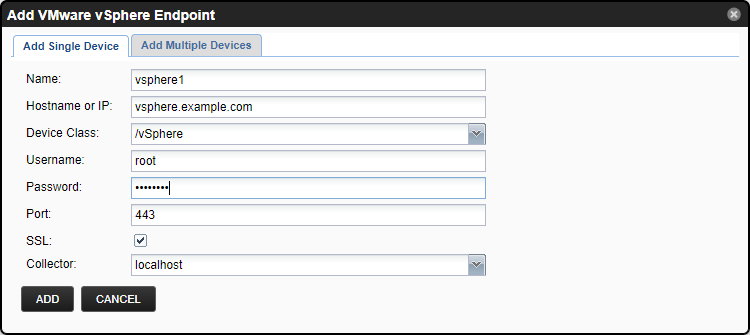
- Name can be anything you want.
- Hostname or IP must be resolvable and accessible from the collector server chosen in the Collector field.
- Username and Password are the same as what you'd use in the vSphere client.
- Port is the HTTP/HTTPS port to connect to (443 is normal if HTTPS is being used)
- SSL should almost certainly be left enabled.
- Click ADD.
Unlike other device types, it is possible to add the same vSphere Endpoint multiple times with the same IP but under different device IDs, which will result in duplicate data collection.
Alternatively, you can use zenbatchload to add vSphere endpoints from the command line. To do this, you must create a file with contents similar to the following. Replace all values in angle brackets with your values minus the brackets. Multiple endpoints can be added under the same /Devices/vSphere or /Devices/vSphere/Subclass section.
/Devices/vSphere loader='VMware vSphere', loader_arg_keys=['title', 'hostname', 'username', 'password', 'ssl', 'collector'] vcenter1 hostname='<address>', username='<username>', password='<password>'
You can then load the endpoint(s) with the following command.
zenbatchload filename
Monitoring ESX Host Preparation
If you are using VMWare NSX to provide software-defined networking functionality in your vSphere environment, each of your ESX hosts must be properly prepared and configured, in order to utilize NSX. This feature requires that you have both NSX and vSphere ZenPacks installed on your Zenoss instance.
In monitoring ESX host preparation, Zenoss must communicate directly with the ESX host, rather than through the vCenter endpoint. This requires additional configuration, detailed in the following steps.
- In the Device Detail page for your vSphere endpoint, click on Configuration Properties to edit the zProperties for this device.
- Click in the empty box under Name to search for zProperties by name.
- Find the property named
zVSphereHostSystemUserand set it to the username you use to access your ESX hosts via ssh and API. - Find the property named
zVSphereHostSystemPasswordand set it to the password you use to access your ESX hosts via ssh and API. - Find the property named
zVSphereHostCollectionClusterWhitelist. The whitelist filters the hosts which are monitored based on cluster names. You have several options for whitelist entries.- You can enter the full name of each cluster whose hosts you wish to monitor.
- You can enter a partial name that matches one or multiple clusters.
- You can enter a regular expression that matches one or multiple clusters.
- You can enter a
*as a wildcard to match every cluster attached to the vSphere endpoint.
- Once these values are set, if your hosts meet the criteria described below, the zenvsphere demon will begin shortly, and you will see additional data fields populated in your host details section.
The zVSphereHostCollectionClusterWhitelist is a list property that
accepts multiple entries. The patterns entered are used in an OR
pattern, rather than an AND pattern. That is to say, if a cluster
matches ANY pattern, it will be monitored. This means that if you use
the wildcard option to match all clusters, there is no reason to enter
anything else in the zProperty. Remember also, this whitelist is empty
by default. Thus, until values are entered here no hosts will be
monitored.
The host preparation monitoring tracks the following values:
- VXLAN VIB Install Date
- VXLAN VIB Version
- VSIP VIB Install Date
- VSIP VIB Version
- DVFilter Switch Security VIB Install Date
- DVFilter Switch Security VIB Version
- VDS Config Present
This monitoring is based on recommendations for troubleshooting connectivity on ESX hosts with NSX: https://kb.vmware.com/selfservice/microsites/search.do?language=en_US&cmd=displayKC&externalId=2107951
The checks recommended in this article are performed by the host collection, and an event is generated if the checks fail, alerting your team and allowing them to take steps to resolve the issue.
When collecting data from ESX hosts, certain assumptions are made about your host configuration:
- SOAP API is enabled and accessible
- API traffic is transmitted over SSL
- API traffic is handled on the default SSL port 443
- The ESX host's hostname is valid and routable from the Zenoss collector
- All ESX hosts managed by a given vCenter have the same username and password as each other
If any of these statements is not correct for your host, host data collection will not be possible, and this feature will not be used for that host.
Configuring Guest Device Discovery
Use the following steps to configure VM guest device discovery. Guest device discovery must be configured individually for each vSphere endpoint.
- Navigate to one of the vSphere endpoints.
- Navigate to the Configuration Properties panel and
in
zVSphereDiscoverLinuxDeviceClassandzVSphereDiscoverWindowsDeviceClasszProperties set device class for Linux and Windows VMs. - Verify that appropriate SSH, SNMP, or Windows credentials are configured for the chosen device class(es).
- Populate
zVSphereDiscoverPathszProperty with RegEx patterns matches VM's inventory paths you want to discover. By default, it's empty, which means no guest devices will be discovered. To discover all guest devices you may use.*pattern. Inventory path is entity location on the inventory in the form/My Folder/My Datacenter/vm/Discovered VM/VM1. You may get it on the VM's Details page. - In the Zenoss UI, find the gear icon menu in the bottom left corner of the window. Under this menu, click the option labeled "Discover Guest Devices". This will schedule a job for immediate execution, which will run the discovery process for each VM.
NOTE: VMWare Tools are required to be installed on VMs user wants to discover in order to obtain their IP addresses.
Zenoss monitors changes to VMs (adding/removing/IP or inventory path
changing) and will create or remove the linked guest devices if needed.
The guest device will be removed only if it was created by ZenPack
automatically and zVSphereRemoveGuests the property is set to True.
Reasons a Guest Device Fails to be Discovered
Several criteria must be met in order for a guest device to be discovered by the vSphere ZenPack. Those requirements are as follows:
- The VM must have inventory path matches
zVSphereDiscoverPathsconfiguration property. - Guest device classes must be defined. See the
zVSphereDiscoverLinuxDeviceClassandzVSphereDiscoverWindowsDeviceClassconfiguration properties. - The guest must have a valid IP, which could be only provided by VMWare Tools installed inside VM.
Configuring Auto Change of the Production State for Guest Devices
You can disable auto change of the production state for VMs, for this purpose you have to:
- Click on the Infrastructure tab.
- Select discovered VM or the appropriate device classes, in case you want to change the behavior for a group of underlying VMs.
- Navigate to the Configuration Properties panel.
- Change the
zVSphereAutoChangeProdStateproperty (default is true).
By default, the production state is changed to 'Production' (1000) for
running VMs, and to 'Decommissioned' (-1) for stopped ones. These states
may be customized by specifying the desired production state IDs
(numbers) in zVSphereAutoChangeProdStateRunning and
zVSphereAutoChangeProdStateStopped.
Controlling which VMs are Modeled
By default, all Virtual Machines managed by the vSphere endpoint are
modeled. Optionally, you may exclude certain VMs you do not wish Zenoss
to model through the use of the zVSphereModelExcludePaths and
zVSphereModelIncludePaths zProperties.
These work similarly to zVSphereDiscoverPaths (described above). Each
property contains one or more regular expressions (one per line), which
are matched against the inventory path of every VM.
Inventory paths are of the form
/My Folder/My Datacenter/vm/Discovered VM/VM1. For any VM that is
already modeled by Zenoss, the inventory path is shown in its Details
page. In addition, in the dialogs for zVSphereModelExcludePaths and
zVSphereModelIncludePaths, the Test the button shows all VMs that
are present on the endpoint, their inventory path, and whether they
would be modeled based on the current settings of
zVSphereModelExcludePaths and zVSphereModelIncludePaths.
When the modeler matches these patterns, it first checks
zVSphereModelExcludePaths against the path, and then
zVSphereModelIncludePaths. This means that zVSphereModelExcludePaths
must be set before zVSphereModelIncludePaths can be useful.
Examples:
- Model only VMs with
prodin their name- exclude:
.* - include:
^/(.+/)[^/]*prod[^/]*$
- exclude:
- Model only VMs in a specific datacenter
- exclude:
.* - include:
^/My Datacenter/
- exclude:
- Exclude a specific folder of VMs
- exclude:
^/My Datacenter/vm/Discovered - include:
(leave blank)
- exclude:
- Exclude VMs with
testin their name, unless they are in the 'prod' datacenter or haveprodin their name- exclude:
^/(.+/)[^/]*test[^/]*$ - include:
^/Prod Datacenter/ - include:
^/(.+/)[^/]*prod[^/]*$
- exclude:
- Exclude all VMs except those with
prodanywhere in their name, datacenter, folder, or VM name included.- exclude:
.* - include:
prod
- exclude:
It is recommended to test any settings using the 'Test' button of the zProperty dialog carefully, to avoid accidentally excluding VMs you do not wish to model.
Transitioning from ZenVMware
If you are installing this ZenPack on an existing Zenoss system or upgrading from an earlier Zenoss version you may have a ZenPack named ZenPacks.zenoss.ZenVMware is already installed on your system. You can check this by navigating to Advanced -> ZenPacks.
This ZenPack functionally supersedes ZenPacks.zenoss.ZenVMware, but does not automatically migrate monitoring of your VMware vSphere resources when installed. The ZenPacks can coexist gracefully to allow you time to manually transition monitoring to the newer ZenPack with better capabilities.
Depending on how heavily loaded your vCenter and Zenoss server(s) are you may wish to avoid monitoring the same vSphere resources twice in parallel. If this is the case, you should use the following instructions to first remove the existing vSphere monitoring before adding the new monitoring.
- Navigate to the Infrastructure page.
- Expand the VMware device class.
- Single-click to select a vCenter.
- Click the delete (-) button in the bottom-left.
- Click OK to confirm deleting the vCenter.
- Add the vCenter back using the Adding vSphere Endpoint instructions above. Be sure to select Add VMware vSphere Endpoint and not Add VMware Infrastructure.
- Repeat steps 3-6 for each vCenter.
If you're comfortable monitoring the vCenters twice in parallel for a time, you can simply follow the instructions under Adding vSphere Endpoint then delete the old vCenters from the /VMware device class once you're satisfied with the new monitoring.
Installed Items
Installing this ZenPack will add the following items to your Zenoss system.
Configuration Properties
-
zVSphereAlarmSeverities: List of alarm severities (colors) to control which alarms are collected.
- Default value: ["RED", "YELLOW", "GREEN"]
-
zVSphereAutoChangeProdState: Whether to change production states for guest devices when VM's state changes.
- Default value: True
-
zVSphereAutoChangeProdStateRunning : Production state to use for guest devices in running state.
- Default value: 1000
-
zVSphereAutoChangeProdStateStopped: Production state to use for guest devices in a stopped state.
- Default value: -1
-
zVSphereDiscoverLinuxDeviceClass: Device Class to use for discovered Linux VMs.
-
zVSphereDiscoverPaths: Create guest devices only for VM with inventory path matches one of the provided RegExes. If not set, discovering is disabled.
-
zVSphereDiscoverWindowsDeviceClass: Device Class to use for discovered Windows VMs.
-
zVSphereEndpointHost: Hostname or IP used to connect to vSphere Endpoint.
-
zVSphereEndpointPassword: Password used to connect to vSphere Endpoint.
-
zVSphereEndpointPort: Port used to connect to vSphere Endpoint.
- Default value: 443
-
zVSphereEndpointUser: User used to connect to vSphere Endpoint.
- Default value: admin
-
zVSphereEndpointUseSsl: Whether to use SSL when connecting to vSphere Endpoint.
- Default value: True
-
zVSphereEventTypes: List of event types to control which events are collected.
- Default value: ["info", "warning", "error", "user"]
-
zVSphereHostCollectionClusterWhitelist: The whitelist filters the hosts which are monitored based on cluster names.
-
zVSphereHostPingBlacklist: List of regular expressions to control which management IP address to ping (matches against hostname:nicname:ip). Note:
zVSphereHostPingWhitelisttakes precedence overzVSphereHostPingBlacklist. -
zVSphereHostPingWhitelist: List of regular expressions to control which management IP address to ping (matches against hostname:nicname:ip). Note:
zVSphereHostPingWhitelisttakes precedence overzVSphereHostPingBlacklist. -
zVSphereHostSystemPassword: Password used to access ESX hosts via ssh and API.
-
zVSphereHostSystemUser: Username used to access ESX hosts via ssh and API.
-
zVSphereLUNContextMetric : Whether to use LUN-specific metric names when storing performance data. Note: Changing value will cause historical metrics to become inaccessible.
- Default value: False
-
zVSphereModelAdmSoftLimit: Advanced tuning parameter, consult Zenoss support.
- Default value: 500
-
zVSphereModelCache: List of regular expressions to configure caching (change detection) for a specific set of properties.
-
zVSphereModelExcludePaths: List of regular expressions (matched against VM inventory path) to control which VMs are NOT modeled. Note:
zVSphereModelIncludePathstakes precedence overzVSphereModelExcludePaths. -
zVSphereModelIgnore: List of regular expressions to suppress collection of attributes matched (See Tuning Modeling).
-
zVSphereModelIncludePaths: List of regular expressions (matched against VM inventory path) to control which VMs are modeled. Note:
zVSphereModelIncludePathstakes precedence overzVSphereModelExcludePaths. -
zVSphereModelMpIndexObjs : Advanced tuning parameter, consult Zenoss support.
- Default value: 50
-
zVSphereModelMpLevel: Advanced tuning parameter, consult Zenoss support.
- Default value: 0
-
zVSphereModelMpObjs: Advanced tuning parameter, consult Zenoss support.
- Default value: 250
-
zVSphereModelVdisks: Enable modeling of Vdisks components.
- Default value: False
-
zVSphereModelVSAN: Enable modeling of vSAN components.
- Default value: True
-
zVSpherePerfDelayCollectionMinutes: How long in minutes to lag performance data collection (See Performance Data Collection: Tuning).
-
zVSpherePerfHealthFailsThreshold: Generate an event when performance collection fails percentage exceeds a specified threshold.
- Default value: 10
-
zVSpherePerfHealthTimeoutsThreshold: Generate an event when performance collection timeouts count exceeds a specified threshold.
- Default value: 50
-
zVSpherePerfMaxAgeMinutes: An upper limit on how far back Zenoss will query vSphere for performance data.
- Default value: 28
-
zVSpherePerfParallelQueries: How many queries to execute against vSphere in parallel.
- Default value: 8
-
zVSpherePerfQueryChunkSize: The maximum number of metrics to include in each query for managed objects stored on the ESX hosts (Hosts, LUNs, pNICs, VMs).
- Default value: 250
-
zVSpherePerfQueryRaw20: Whether to actually use the 'raw data feed' query option for the managed object types it is normally used for: Hosts, LUNs, pNICs, VMs.
- Default value: True
-
zVSpherePerfQueryTimeout : How long to allow each API call to respond.
- Default value: 25
-
zVSpherePerfQueryVcChunkSize: The maximum number of metrics to include in each query for managed objects stored in the vSphere database (Clusters, Datastores, ResourcePools).
- Default value: 64
-
zVSpherePerfQueryVcRaw20: Whether to actually use the 'raw data feed' query option for the managed object types is not normally used for: Datacenters, Clusters, Resource Pools.
- Default value: False
-
zVSpherePerfRecoveryMinutes: When an error occurs in querying a specific metric, it is blacklisted for this number of minutes before it is retried.
- Default value: 20
-
zVSpherePerfTimeoutRecoveryMinutes: When a timeout error occurs in querying a specific metric, it is "blacklisted" for this number of minutes before it is retried. This avoids repeated errors due to attempts to query a metric that is not working properly. The default is fairly long (1 hour), and it can be safely lowered if desired or if gaps appear in the graphs.
- Default value: 60
-
zVSphereRemoveGuests: Remove discovered guest device if linked VM is removed on vSphere.
- Default value: False
-
zVSphereVMContextMetric: Whether to use VM-specific metric names when storing performance data. Note: Changing value will cause historical metrics to become inaccessible.
- Default value: False
-
zVSphereVSANRetriggerAlarms: Controls re-triggering of VSAN alarms based on failing health checks. One of "all" (check all alarms), "current" (only check alarms for health checks that are currently failing), or "never" (do not re-trigger alarms).
- Default value: all
Device Classes
- /vSphere
Modeler Plugins
- vmware.vSphere
Datasource Types
- VMware vSphere
- Python vSphere
- VMware vSphere Modeled
- vSphere VSAN Performance
Monitoring Templates
- Endpoint (in /vSphere)
- Cluster (in /vSphere)
- Cluster-VSAN (in /vSphere)
- Datacenter (in /vSphere)
- Datastore (in /vSphere)
- Datastore-ESX (in /vSphere)
- dvPortgroup (in /vSphere)
- dvSwitch (in /vSphere)
- Host (in /vSphere)
- Host-VSAN (in /vSphere)
- LUN (in /vSphere)
- Network (in /vSphere)
- pNIC (in /vSphere)
- RDM (in /vSphere)
- ResourcePool (in /vSphere)
- ResourcePool-ESX (in /vSphere)
- StandaloneResource (in /vSphere)
- vApp (in /vSphere)
- VM (in /vSphere)
- VM-VSAN (in /vSphere)
- VDisk (in /vSphere)
- vNIC (in /vSphere)
- vSANDisk (in /vSphere)
- vSANCacheDisk (in /vSphere)
- vSANCapacityDisk (in /vSphere)
- vSANDiskGroup (in /vSphere)
Event Classes
- /vSphere
- /Perf/vSphere
- /Perf/vSphere/Utilization
Collector Daemons
- zenvsphere
Troubleshooting
If any issues are encountered with the functionality offered by this ZenPack, the following checklist should be followed to verify that all configurations are correct.
Configuration Checklist
- Verify that Zenoss has been fully restarted after the ZenPack was installed.
- Verify that the endpoint's address, username, and password are
correct. Check the
zVSphereEndpointHost,zVSphereEndpointUserandzVSphereEndpointPasswordconfiguration properties for the endpoint device. See Login Credentials below. - Verify that the Zenoss collector server to which the endpoint device is assigned has network connectivity through any firewalls to the endpoint address on port 443/TCP (HTTPS).
- Verify that the zenvsphere daemon is running on the collector to which the endpoint device is assigned.
- Check the logs. See Logging below.
- Kill zenvmware-client subprocess. See Java Subprocess below.
- Tune configuration properties according to Performance Data Collection: Tuning instructions below if necessary.
Modeling
As of version 3.3.0, modeling for vSphere devices is performed continuously by the zenvsphere collector daemon. Because the modeling is handled by a daemon, it may not be performed immediately upon adding a new vSphere endpoint. This does not necessarily mean anything is wrong. Wait a few minutes and see if model data begins to populate.
If you do not see any data after waiting a few minutes, check the logs to see if there were any errors encountered during modeling, see Logging.
One common problem when adding a new vSphere endpoint is incorrect login details. In the logs, you should see something like this:
ERROR zen.PythonClient: Authentication error: [com.vmware.vim25.InvalidLoginFaultMsg] Cannot complete login due to an incorrect user name or password. Check `zVSphereEndpointUser` and `zVSphereEndpointPassword`.
If this occurs, you should verify and re-enter your vSphere login credentials, see Login Credentials.
If you see any other errors, consult the included documentation, this wiki, Zenoss Support, and whatever other resources you have at your disposal.
Normally, it should not be necessary to restart zenvsphere since any model updates will be received automatically from vSphere. But if you deem it necessary to restart the collector daemon, you can do so, see Daemon Restart. Please note the caveats outlined in that section before proceeding.
Daemon Restart
The vSphere ZenPack uses its own service or daemon which runs continuously in the background to collect modeling data, events, and performance data about your vSphere environment. Running as a separate service allows for greater flexibility in handling some constraints of the vSphere architecture and allows for greater performance.
Under normal circumstances, you should never need to restart the daemon. It automatically pulls in data about new devices and components, even changing zProperties and other configuration values. Additionally, this will cause a significant delay in data collection. Restarting the collector daemon closes the open session with the vSphere API, which means the collector has to start over the modeling data collection process from the very beginning, rather than pulling incremental updates. In a smaller environment, this may not be a serious issue, but in complex vSphere environments, with a lot of components, this could be very time-consuming. Thus, if you restart the daemon in such an environment, expect to wait a while.
However, if the daemon is clearly malfunctioning, or you have otherwise determined it is necessary to force remodeling, you can restart the collector daemon using the steps described below.
If you are running Zenoss 5.0 or greater, the zenvsphere daemon runs in its own Docker container, managed by Control Center. To restart it, follow these steps:
- Open the Zenoss UI.
- Click the Advanced tab, and then select Control Center.
- Find 'zenvsphere' in the list and click the restart button.
If you are running an older version of Zenoss than 5.0, there is no Control Center and there are no Docker containers. Instead, follow these steps:
- Open the Zenoss UI.
- Click the Advanced tab, then go to Settings -> Daemons.
- Find the 'zenvsphere' daemon and click the restart button.
Login Credentials
- Find your vSphere device in the Infrastructure section of the Zenoss UI.
- Go to the Configuration Properties section.
- Enter 'vSphereEndpoint' in the Name filter and hit Enter.
- You should see a list of configuration properties, including
zVSphereEndpointHost,zVSphereEndpointUserandzVSphereEndpointPassword. - Double-click an entry to edit its value.
- Ensure the user, host, password, or any other values are correct. Specifically, make sure that you can use the vSphere client with this same information.
NTP
An often-overlooked Zenoss deployment issue is the synchronization of time between data sources and data collectors, especially when the collected data is timestamped at the source. It is not unusual for the hardware clocks in computers to drift by seconds per day, accumulating to significant error in just a week or two.
The Zenoss data collector for vSphere will adjust for time zone and clock skew differences every 2 hours (by comparing the server current time with the collector's) so even without NTP, events and graphs will have correct timestamps in Zenoss. If the clocks are not synchronized, however, the timestamps shown in Zenoss and vSphere for the same event will not match, and this can cause considerable confusion.
- Be sure that both Zenoss collector and ESX endpoint are configured for automatic time correction using NTP.
- To further reduce confusion, it is recommended that the collector and endpoint be configured for the same time zone.
Logging
On Zenoss 4, the log file can be found at
$ZENHOME/log/<collectorname>/zenvsphere.log. On Zenoss 5, the log file
is inside the zenvsphere container, and may be accessed as follows:
serviced service attach zenvsphere- A log can be found at
/opt/zenoss/log/zenvsphere.log
By default, only INFO and higher priority messages will be logged. To
temporarily increase the logging level to include DEBUG messages you
can run zenvsphere debug as the Zenoss user without restarting the
daemon. The next time it restarts, logging will resume at the
preconfigured level. Alternatively, you can run zenvsphere debug again
to return logging to the preconfigured level.
On Zenoss 5, you must attach to the zenvsphere container before running
zenvsphere debug, or alternatively, you may skip that step by using
the command serviced service debug zenvsphere
Note that if you have multiple collectors under Zenoss 5, you will need
to specify the specific zenvsphere service ID rather than zenvsphere
in the serviced commands above.
Java Subprocess
The zenvsphere daemon spawns a java process named zenvmware-client
as needed to communicate with vSphere endpoints. It may be possible that
this java process encounters a problem that zenvsphere is unable to
detect or recover from. If you're experiencing issues you can run
pkill -9 -f zenvmware-client as the Zenoss user to kill the java
process. It will be automatically restarted.
On Zenoss 5, the java process runs within each zenvsphere container, so
you may attach it to the container
(serviced service attach zenvsphere) and kill the process, or you may
restart the entire service (which will restart both zenvsphere and the
java subprocess) with the command serviced service restart zenvsphere.
(If you have multiple zenvsphere containers, you will need to specify
the service ID)
Performance Data Collection: Health Report

For support purposes, an overall health report is generated for each vSphere device, indicating the elapsed time and any relevant errors encountered during the last polling cycle for that device.
This report may be accessed by visiting the device in the Zenoss UI, and changing the URL from
[...]/zport/dmd/Devices/vSphere/devices/[device id]/devicedetail[...]
To
[...]/zport/dmd/Devices/vSphere/devices/[device id]/health
Detailed interpretation of this report is best done by a Zenoss support engineer, however, the header will show the "Last valid data collected" time and "Last perf collection task total elapsed time" fields.
If the last time is not recent, or the elapsed time is greater than 300 seconds, this may indicate that tuning is required.
Some key metrics from the health report are now available in the device graphs. Simply navigate to your device in the web interface and click Graphs in the left navigation bar.
Performance Data Collection: maxQueryMetrics and zVSpherePerfQueryVcChunkSize
In vSphere 5.5U2d and 6.x, a limitation has been introduced by VMware on how many performance metrics may be queried at a time. Since Zenoss performs bulk queries of all monitored metrics every 5 minutes, it can run into this limit.
If it does, the query is automatically split in half and retried, so
there should not be any functional problem, but it is less efficient and
can crowd the zenvsphere.log file with errors. (These errors will
mention querySpec.size (5.5) or vpxd.stats.maxQueryMetrics (6.0))
The limit normally defaults to 64 on current versions of vSphere, and
Zenoss has a zproperty (zVSpherePerfQueryVcChunkSize) which should be
set to the same, or lower, value to avoid these errors. This zProperty
defaults to 64 as well, so it is not normally necessary to adjust it
unless you see errors like those described above.
For more details on this limit and how to change it, see https://kb.vmware.com/selfservice/microsites/search.do?language=en_US&cmd=displayKC&externalId=2107096
Performance Data Collection: Gaps in Resource Pool Graphs
If you are having problems with Resource Pool graphs specifically, with the following symptoms:
- Gaps in one or more graphs on resource pools
- No data in the "CPU Entitlement" graph
- No data in the "Consumed" and "Overhead" lines of the "Memory Usage" graph
- Errors referring to
querySpec.size(5.5) orvpxd.stats.maxQueryMetrics(6.0) in the Performance Health report for some resource pools.
This problem has been observed in at least some versions of vSphere 5.5 and 6.0.
The root causes of these three specific datapoints (memOverhead, cpuEntitlement, and memEntitlement) on Resource Pools, vSphere does not properly calculate the number of metrics being queried.
For example, in vSphere, each Cluster has a top-level resource pool that contains all resources (sub-pools, and ultimately VMs) in the cluster. If we query for a single metric on that top-level pool, say, memEntitlement, instead of being counted as one metric, it is counted as one per VM in the entire cluster. That is, vSphere is expanding our one query into a bunch of internal queries, and counting them all against the maxQueryMetrics limit described above. In practice, this means that in any cluster that has more than 64 VMs, these three metrics will not be available on that top-level resource pool, because there is no way to query them without them being counted as more than 64 metrics.
The same problem applies to all resource pools that contain, directly or through sub-pools, more than 64 VMs.
The only workaround is to disable the vpxd.stats.maxQueryMetrics setting on the vSphere side, as described above, or to raise it to a very high number (under current versions of the zenpack, it would need to be a bit more than 3 times the number of VMs in the cluster - future versions will subdivide these queries further so that it only needs to be the number of VMs)
Note that there will also be gaps in the "CPU Usage" graph because the
Zenoss collector will stop trying to collect any metrics from a given
resource pool after it encounters these errors, for 20 minutes by
default (configurable via zVSpherePerfRecoveryMinutes). It will then
try again, and fail again. Occasional data may get through due to the
way Zenoss batches its queries, which can cause partial data to show up
on affected resource pools.
If you need these graphs to work on these pools, but are unable to raise or disable vpxd.stats.maxQueryMetrics, you may disable the memOverhead, cpuEntitlement, and memEntitlement datapoints in the ResourcePool monitoring template. This should avoid the problem.
Performance Data Collection - Tuning
As of version 3.3, the performance collection mechanism of the vSphere
ZenPack is more optimized and self-tuning and generally will not require
adjustment. This is primarily due to the fact that the time window of
data polled in each cycle is now dynamic, and is based on what data has
already been collected. Therefore, rather than tuning the specific
window as was done in previous versions of the zenpack using the (no
longer supported) zVSpherePerfWindowSize option, the collector will
automatically collect as much data as is available since the last time
it collected each metric.
This, in combination with other changes, means that the collector is better able to compensate for large vCenter installations or slow response times.
However, a number of configuration variables are still available for advanced tuning:
zVSpherePerfDelayCollectionMinutes: If set, will cause collection to be delayed by the specified number of minutes. This may be useful if the most recent data value for each counter is untrustworthy, for instance. The collector will already handle a known case where the most recent data value may show up as a0erroneously without the use of this option, so it would only be used if some other similar, but unanticipated problem occurred. This is a very safe option to experiment with, with the only side effect being delayed data on the graphs.zVSpherePerfMaxAgeMinutes: An upper limit on how far back Zenoss will query vSphere for performance data. It is highly recommended not to change this value, as it reflects VMware's recommendation to only query within the last 30 minutes.zVSpherePerfRecoveryMinutes: When an error occurs in querying a specific metric, it is "blacklisted" for this number of minutes before it is retried. This avoids repeated errors due to attempts to query a metric that is not working properly. The default is to wait 20 minutes, and it may be lowered if desired. Lowering it is not particularly beneficial though, since the data that was missed during this gap will normally be retroactively filled in if it starts working again within that 20-minute window.zVSpherePerfTimeoutRecoveryMinutes: When a timeout error occurs in querying a specific metric, it is "blacklisted" for this number of minutes before it is retried. This avoids repeated errors due to attempts to query a metric that is not working properly. The default is fairly long (1 hour), and it can be safely lowered if desired or if gaps appear in the graphs.zVSpherePerfParallelQueries: How many queries to execute against vCenter in parallel. The default is 8, but it may be lowered if this is putting excessive load on vCenter, or raised if doing so increases throughput.zVSpherePerfQueryTimeout: How long to allow each API call to respond. When a timeout or other error occurs, the metrics in that query will be divided in half and each half retried, and if a specific metric persistently times out or produces an error, it will be blacklisted as described underzVSpherePerfRecoveryMinutes. The default value for this property is 25 seconds.zVSpherePerfQueryChunkSize: The maximum number of metrics to include in each query for managed objects for which we normally use theraw data feedquery option (data stored on the ESX hosts): Hosts, LUNs, pNICs, VMszVSpherePerfQueryVcChunkSize: The maximum number of metrics to include in each query for managed objects for which we normally use the5-minutequery option (data stored in the vCenter database): Clusters, Datastores, ResourcePools. The default is 64, but it may be lowered or raised, depending on the needs of the environment. The collector automatically adjusts the number of metrics to request by splitting the request in half if the query fails. However, if the request consistently fails, starting with a lower chunk size will allow the collector to skip these adjustments, reducing the total number of queries required.zVSpherePerfQueryRaw20: Whether to actually use theraw data feedquery option for the managed object types it is normally used for: Hosts, LUNs, pNICs, VMs. Setting this to False will cause the less efficient5-minutequery option to be used, but could be useful if there is a problem with the raw data feed.zVSpherePerfQueryVcRaw20: Whether to actually use theraw data feedquery option for the managed object types is not normally used for: Datacenters, Clusters, Resource Pools. It is not recommended to change this value from its default of False.
When adjusting the chunk sizes, there may be tradeoffs to values that
are too large or too small. On systems with large numbers of datastores
and resource pools or vApps, it may be beneficial to raise
zVSpherePerfQueryVcChunkSize. However, if vSphere 6.x is being used,
zVSpherePerfQueryVcChunkSize must be 64 or less. This restriction can
be lifted if vpxd.stats.maxQueryMetrics, an advanced vCenter
configuration property, is also adjusted, as described at
http://kb.vmware.com/selfservice/microsites/search.do?language=en_US&cmd=displayKC&externalId=2107096
NOTE: As of version 3.3 of the vSphere ZenPack, the
zVSpherePerfWindowSize configuration property is no longer used, and
the meaning zVSpherePerfQueryChunkSize has been changed slightly. It
used to describe a number of query specifications (groups of metrics on
a specific entity), and now it describes the number of metrics instead.
This change was made to align its meaning with that of
vpxd.stats.maxQueryMetrics.
Tuning Modeling
Normally, the set of objects and attributes to be modeled and how they
should be processed is predefined in this ZenPack. However, a limited
amount of tuning is possible via the properties zVSphereModelIgnore
and zVSphereModelCache.
zVSphereModelIgnore is used to suppress the collection of an attribute
or attributes, perhaps because it changes too frequently or is not of
interest in a particular environment. Its value is a list of regular
expressions which must match against a string of the format "
NOTE: These are values are VMware classes and properties, not Zenoss classes and properties. They are generally similar, but there are exceptions. For a list of allowed values, consult $ZENHOME/ZenPacks/ZenPacks.zenoss.vSphere*/ZenPacks/zenoss/vSphere/gather_config.json
zVSphereModelCache is used to configure caching (change detection) for
a specific set of properties. This is also defined as a set of regular
expressions, only this time, the value is <zenoss class
name>:<zenoss property/method name>. It is especially rare
that you would need to use this configuration option. It is specifically
intended for situations where issues with the vSphere data model or API
cause use to be repeatedly notified about a property that has not
actually changed its value. When caching is turned on for the affected
attribute, the collector will keep track of the prior value of the
property, and will only notify zenhub if the value actually changes.
This saves unnecessary load on zenhub. A list of properties that need
this functionality is built into the collector, and this configuration
option is only used to add additional properties to the list, should a
new one be found. There is generally no benefit to using this caching
feature where it is not needed, but no major downside either, other than
increased memory usage on the collector. Should you find a property
where this caching is needed, please notify Zenoss so that we may make
this behavior the default in future versions of this ZenPack.
Advanced tuning of modeling to accommodate the addition of very large
vSphere instances to Zenoss, which may otherwise time out during their
initial modeling may be performed using the zVSphereModelMpLevel,
zVSphereModelMpObjs, zVSphereModelMpIndexObjs, and
zVSphereModelAdmSoftLimit variables. At this time we do not recommend
that these values be changed without assistance from Zenoss Support.
ESX Host Ping Monitoring
By default, the management IP reported by VMware for each host will be pinged. This may be disabled completely by setting zPingMonitorIgnore to true.
In some situations, a host may have multiple management IPs. In this
case, the default is for the first one to be pinged. (according to the
order that the physical NICs are reported for that host in the VMware
API). If this default is not acceptable, the zVSphereHostPingBlacklist
property may be used to filter out undesired IP addresses.
Its value is a list of regular expressions which must match against a
string of the format <hostname>:<pnic name>:<ip
address>.
For example esx1.zenoss.com:vmk0:10.0.2.3 could be matched by
esx1.zenoss.com, :vmk0, 10\\.0\\.2\\.3, or other patterns.
This can be used to filter out specific NICs (:vmk0:), subnets
(:10\\.0\\.2), or hosts (esx1.zenoss.com)
zVSphereHostPingBlacklist maybe combined with
zVSphereHostPingWhitelist to create exceptions, for instance, one
could set zVSphereHostPingBlacklist to ignore vmk1 on all hosts, but
then zVSphereHostPingWhitelist to make an exception fo a specific
hostname or subnet.
One useful way to combine these is to set the
zVSphereHostPingBlacklist to .\* (that is, disable all ping
monitoring), and then specifically enable your management subnets in
zVSphereHostPingWhitelist, one pattern for each subnet.
Note that since these are regular expressions, any . in the IP address
should be escaped with a backslash, as shown above. If this is not done,
the . will match any character.
Zenoss Analytics
This ZenPack provides additional support for Zenoss Analytics. Perform the following steps to install extra reporting resources into Zenoss Analytics after installing the ZenPack.
- Copy vsphere-analytics.zip from $ZENHOME/ZenPacks/ZenPacks.zenoss.vSphere*/ZenPacks/zenoss/vSphere/analytics/ on your Zenoss server.
- Navigate to Zenoss Analytics in your browser.
- Log in as a superuser.
- Remove any existing vSphere ZenPack folder.
- Choose Repository from the View menu at the top of the page.
- Expand Public in the list of folders.
- Right-click on vSphere ZenPack folder and choose Delete.
- Confirm the deletion by clicking OK.
- Add the new vSphere ZenPack folder.
- Choose Server Settings from the "Manage" menu at the top of the page.
- Choose Import on the left page.
- Remove checks from all checkboxes.
- Click Choose File to import a data file.
- Choose the vsphere-analytics.zip file copied from your Zenoss server.
- Click Import.
You can now navigate back to the vSphere ZenPack folder in the repository to see the resources added by the bundle.
The vSphere Domain can be used to create ad hoc views using the following steps.
- Choose Ad Hoc View from the Create menu.
- Click Domains at the top of the data chooser dialog.
- Expand Public then vSphere ZenPack.
- Choose the vSphere Domain domain
Known issues
SSL Errors with Certain VMware versions
Resource Manager 5.2.x and higher may be unable to monitor certain
versions of ESXi 5.5 directly (vCenter seems to be unaffected). This is
believed to be a compatibility issue between the java 1.8 JVM used by
Zenoss and the version of OpenSSL included in these versions of ESXi. If
this problem is occurring, the error
HTTP transport error: javax.net.ssl.SSLHandshakeException: Remote host closed connection during handshake
will be found in the zenvsphere.log.
To correct it, either update ESXi to 5.5 build 4722766 or later, or edit the zenvsphere.conf file and set the following option:
vmargs -Dhttps.protocols=TLSv1
Note that setting this option, may have negative side effects, so it should only be used when necessary. In particular, it will prevent zenvsphere from being able to collect to newer versions of VMware, which have disabled TLSv1 support in favor of TLSv1.1 or TLSv1.2. See https://kb.vmware.com/s/article/2145796 for a detailed breakdown of which versions of VMware have had TLSv1 support disabled. There are options (described in the KB article) to re-enable it if required.
A similar issue may occur with Zenoss 4.2.5 through 5.1.x when
attempting to monitor a version of VMware newer than 6.5. Again, it will
manifest as an
HTTP transport error: javax.net.ssl.SSLHandshakeException: Remote host closed connection during handshake
error. This occurs because VMware is now requiring the use of TLSv1.2,
which is not enabled by default in these older versions of Zenoss. To
correct this, set the following option in zenvsphere.conf:
vmargs -Dhttps.protocols=TLSv1,TLSv1.1,TLSv1.2
Note that this requires the use of Java 7, which may not be installed by
default on RM 4.2.5 systems. You can check the installed version of java
by running java -version on the Zenoss collector.
Analytics
Analytics stores history for devices and components. In some cases, this may cause reports to show 2x/3x/… larger data. Turning off "deleted dimensions" may help.
To change this setting permanently in the data warehouse to not keep deleted dimensions around you can do the following on your analytics server:
-
mysql -u root reporting -e “update meta_setting set setting_value = 1 where setting_name = ‘remove_deleted_dimensions’;” -
Wait 24 hours for the next MODEL extract and load to take place and account for this change in configuration.
If you want to test this out before making the setting permanent to see its impact in your environment before you make the change permanent, you can execute the following command on your analytics server:
mysql -u root reporting -e "call remove_deleted_dimensions;"
Note that you will also need to "blow out" all the jaspersoft ad hoc caches that cache results of queries to see the impact of changing the data in the database in your view.
To do this:
- Log into analytics as Internal Authentication->superuser/superuser and navigate to Manage->Server Settings->Ad Hoc Cache.
- Click on the "Clear all" button at the bottom of the screen.
- Load up the Datastore View again and confirm the removal of deleted dimensions has corrected the issues with the "duplication" of your data.
Upgrades from 3.5.x
When upgrading from 3.5.x to a newer version, a message such as the following may be displayed:
ERROR Monitoring template /vSphere/LUN has been modified since the
ZenPacks.zenoss.vSphere ZenPack was installed. These local changes will
be lost as this ZenPack is upgraded or reinstalled. The existing
template will be renamed to 'LUN-upgrade-1484782049'. Please review and
reconcile local changes
If the only difference shown is the 'component' field on the
diskReadRequests datasource and a change in the ordering of some other
properties on the template, this may be disregarded, and the
LUN-upgrade-
In addition, as described in the Resource Manager Administration Guide, all Zenoss services except zeneventserver should be stopped prior to installing or upgrading any zenpack. This is particularly *critical* with this upgrade. Failure to stop the services may cause migration steps required for this upgrade to fail.
Upgrading from any previous version to 3.7.x or 4.0.x
Installing 3.7.x or 4.0.x of this zenpack involves a migration step that adds a new relationship to all existing vSphere devices. This can take several minutes, and if a model update comes in during this time, a database conflict will occur and cause the zenpack installation to start over, potentially multiple times. On large enough systems, it may never be able to complete without a conflict.
It is therefore recommended to ensure that the zenvsphere service is
shut down prior to upgrading this zenpack, and only restart it once the
upgrade is complete. This will eliminate the issue and speed up the
upgrade process.
When upgrading to these versions, the Snapshots submenu, "Discover Guest
Devices" option, and some vSAN related screens may be not available. If
this issue is encountered, restart the zproxy service (by restarting)
top-level Zenoss.resmgr application in Control Center. It is not
necessary to restart the child services.
Configuring JAVA heap size
By default, the zenvsphere daemon does not set a heap size. The
service definition assumes 1G, but often this is exceeded because the
daemon allows the JVM to choose a default heapsize based on the total
RAM.
In case of need, this value may be tuned in
/opt/zenoss/etc/zenvsphere.conf by uncommenting javaheap option and
setting it to the proper value (in MB). To determine the current heap
one should run java -XX:+PrintFlagsFinal -version 2>&1 \| grep
MaxHeapSize command in zenvsphere container.
Error vmodl.fault.MethodNotFound
If this error is coming from vSAN and there is no vSAN on the vSphere device, setting zVSphereModelVSAN to False should resolve this issue.
Changes
4.2.1
- Fixed Reports generation issue for Resource Pools (ZPS-9142)
- Tested with Zenoss 6.8, Zenoss Cloud and Service Impact 5.7.0.
4.2.0
- Improved error handling for vSphere modeling (ZPS-7464)
- Fixed modeling of highly scalable VMWare systems (ZPS-7836)
- Improved error handling for VSAN datasources (ZPS-8084)
- Added support for VMware vSphere 8 (ZPS-8641)
- Tested with Zenoss 6.7, Zenoss Cloud and Service Impact 5.6.0.
4.1.2
- Fixed modeling of large environments (ZPS-7961)
- Fixed modeling for cases when totalMemory was unchanged (ZPS-7689)
- Fixed modeling of VirtualAHCIControllers (ZPS-6759)
- Fixed Alarm severity mapping (ZPS-7518)
- Fixed processing of com.vmware.vc.StatelessAlarmTriggeredEvent (ZPS-7505)
- Tested with Zenoss 6.6.0, Zenoss Cloud and Service Impact 5.5.5.
4.1.1
- Resolve issue with huge datamaps being produced causing failures in zenhub (ZPS-7130)
- Fix issue when vSphere can sometimes show 100% usage for all datastore components (ZPS-7170)
- Tested with Zenoss Cloud, Zenoss 6.5.0, and Service Impact 5.5.3.
4.1.0
- Fix issue with linking existing guest devices (ZPS-5523)
- Return datastoreUsedPercent datasource (ZPS-7112)
- Better control of polling events from vConsole (ZPS-7166)
- Add new values to the CallHome report to calculate Nutanix VMs on vSphere (ZPS-7293)
- Support of monitoring vSphere 7 (ZPS-7296)
- Add support for Java 11 JVM (ZEN-32976)
- Tested with Zenoss Cloud, Zenoss 6.5.0, and Service Impact 5.5.3.
4.0.3
- Fix modeling failure of vDisk if control is of NVME type (ZPS-6595)
- Fix traceback during vsphere_gather operation with apiVersion '6.7.2' (ZPS-6594)
- Fix modeling failure caused by atypical VSAN configuration (ZPS-6526)
- Tested with Zenoss Resource Manager 6.4.1, Zenoss Cloud and Service Impact 5.5.1
4.0.2
- Fix invalid threshold for memory capacity on vSphere hosts (ZPS-4979)
- Changing zVSphereModelVSAN property also switch monitoring templates (ZPS-5216)
- Add support for NSX OpaqueNetworks (ZPS-5076)
- Fix "vmodl.fault.MethodNotFound" error from vSAN monitoring against vCenter v6.0 (ZPS-5545)
- Handle a situation where VMware Tools return a guest IP address with spaces in it (ZPS-5536)
- Fix sporadic "'NoneType' is not iterable" errors caused by model-monitored datapoints whose values are not updated frequently. (ZPS-5067)
- Migrate Property datasources to vSphere Modeled in local copies of monitoring templates. (ZPS-5628)
- Tested with Zenoss Resource Manager 6.3.2, Zenoss Cloud
4.0.1
- Improve vSAN 6.2 version detection, add zVSphereModelVSAN property (ZPS-4810)
4.0.0
- vSAN support (Disk Groups, Cache and Capacity disk modeling, and monitoring, vSAN Cluster Health, vSAN Objects, Compliance status)
- Lower default configsipsize from 25 to 5 in zenvsphere.conf in order to facilitate pulling large configs from ZenHub. (ZPS-798)
- Changed thresholds related to performance to not affect availability in Service Impact (ZPS-3702). This changes events from being in "/vSphere/Utilization" to be in the "/Perf/vSphere/Utilization" class
- Ensure consistent treatment of CPU Usage (%) in thresholds and Analytics (ZPS-3589)
- Renamed ResourcePool threshold High CPU Usage to "High Load" (ZPS-3589)
- Plot ResourcePool Memory Overhead and Memory Consumption on separate graphs (ZPS-369)
- Added migration script for upgrade-related catalog index issues (ZPS-3922)
- Removed transform that was introduced in 3.7.x on the /vSphere event class (ZPS-4306)
- Fix
NotInDatacenterExceptionerror when permissions are restricted on a folder withoutpropagate to children(ZPS-4232) - Add impact relations between vSphere vSAN Datastores and Dell PowerEdge Physical Disks. (ZPS-4518)
- Ignore blank lines in zVSphereModelIgnore (ZPS-1423)
- Add Test button to zVSphereHostPingWhitelist/zVSphereHostPingBlacklist zProperties (ZPS-3464)
- Reports do not automatically run when selected (ZPS-4172)
- Added an authoritative list of event types to monitor ESX directly (ZPS-3695)
- Fixed clearing for hbr.primary.NoConnectionToHbrServerEvent events (ZPS-4019)
- Allowed to put devices in sub-classes of /vSphere while initially adding them (ZPS-3996)
- Reduce excessive CPU and memory consumption by zenvsphere container (ZPS-643)
- Tested with Zenoss Resource Manager 5.3.3, Zenoss Resource Manager 6.2.1, Zenoss Cloud and Service Impact 5.3.3
3.7.2
- Reduce memory usage when used with the Layer2 ZenPack (ZPS-2172)
- Tested with Zenoss Resource Manager 6.1.2, Zenoss Resource Manager 4.2.5 RPS 743, Zenoss Cloud and Service Impact 5.3.0
3.7.1
- vSphere Report organizer not present with a fresh install (ZPS-3727)
- Fix sporadic modeling failures related to empty snapshots data (ZPS-3586)
- Fix KeyError that could sometimes occur during performance collection when a VM was removed or its monitoring turned off. (ZPS-3820)
- Tested with Zenoss Resource Manager 5.3.3 and 6.1.2, Zenoss Resource Manager 4.2.5 RPS 743, and Service Impact 5.3.0
3.7.0
- Support for vSphere 6.7
- Upgraded from ZenPackLib v1 to ZenPackLib v2. Note: ZenPackLib ZenPack is a new prerequisite, and must be installed separately.
- Automatically add vSphere Guest OS devices (optionally) (ZPS-340)
- Added Dynamic View (overview) (ZPS-2227)
- Disable event collection from hosts that are in maintenance mode.
- Added monitoring of Snapshots (ZPS-351)
- Added (optional) modeling and monitoring of Vdisks
- Added additional perf collection device-level graphs
- Fix Datastore to LUN mapping when datastore use local storage (ZPS-323)
- Add capacity thresholds to Hosts, pNICs, Datastores, and Clusters (ZPS-2694)
- Add zVSphereModelIncludePaths/zVSphereModelExcludePaths to control which VMs are modeled
- When new VMs are discovered, disable monitoring for the discovered VM if the host or cluster it is in has its monitoring turned off.
- Fix potential file descriptor leak in zenvsphere (ZPS-3435)
- Fix situation where config changes may not be properly cached in zenvsphere. (ZPS-3427)
- Performance improvements and bugfixes in vsphere_queryperf tool
- Tested with Zenoss Resource Manager 5.3.3 and 6.1.2, Zenoss Resource Manager 4.2.5 RPS 743, and Service Impact 5.3.0
3.6.3
- Fix issue that can cause duplicated components (ZPS-1614)
- Include vSphere devices in standard device tables in analytics (ZPS-1501)
3.6.2
- Fix zVSphereLUNContextMetric NameError in zenhub.log. (ZPS-1184)
3.6.1
- Support new contextMetric capability in Zenoss 5.2.3. (ZEN-27004)
3.6.0
- Support for vSphere 6.5
- Support monitoring of disk usage on datastores on ESX endpoints (ZPS-504). ZenPacks.zenoss.PropertyMonitor >= 1.1.1 is required for this. 1.1.0 is sufficient for vCenter endpoints.
- Alarms missing descriptions ("Alarm_alarm-123 status is red") on vSphere 6.0 targets (ZPS-397)
- Fix modeling of certain datastores on ESX endpoints (ZPS-512)
- Modeler suppresses objects which should not be modeled, including references from other objects. Support added for "effectiveRole" based filtering to exclude VMs from the model if the user has the NoAccess role on the host or cluster that the VM is hosted on. Fix suppression-related issues for LUNs and VM Templates. (ZEN-22233, ZEN-21904, ZEN-25884, ZEN-25625)
- Added zVSphereHostPingWhitelist and zVSphereHostPingBlacklist to control the selection of management IPs to ping (ZPS-335)
- Updated to zenpacklib 1.1.2.
- Fix modeling errors with VMs that are inside nested resource pools within vApps (ZPS-387)
- Suppress events when vSphere host is in maintenance mode (by setting Host and VM productionState accordingly) (ZPS-332)
- Clarify resource pool counts on Datacenter components (ZPS-389)
- Remove broken
folderlinks from component details (ZPS-396) - Fix error while displaying VMs report (ZPS-337)
- Fix calculation of missedRuns in zenvsphere by not counting event and modeler tasks (they are run constantly, and can never be "late") (ZPS-399)
- Fix improperly rounded "Total" value on "Performance Data Collection Counters" graph (ZPS-392)
- [Analytics] Count vSphere devices in the overall device inventory (add to dim_device) (ZPS-398)
3.5.3
- Fix TypeError while adding vSphere hypervisor (ZEN-26197)
3.5.1
- Fix RRD file paths on Zenoss 4.x (ZEN-25807)
3.5.0
- General
- Converted zenpack to use zenpacklib. Small UI differences and improved functionality throughout.
- Hide password in the "Add Multiple Endpoint" dialog. (ZEN-25387)
- Improve performance of "Resource Pool" and "Hosts and VMs" reports (ZEN-21039)
- Documented analytics behavior and workaround for deleted dimensions (ZEN-24333)
- Add HostSystem->Datastore DV/impact relation, only in the case where a datastore is stored on a local disk on that host. (ZEN-23166)
- Add labels and descriptions to vSphere zProperties
- Change severity of incorrect username or password in the model log from WARNING to ERROR and update message (ZEN-21003)
- Add additional filtering options to all reports (ZEN-23157)
- Allow addition of vSphere devices under subclasses of /Devices/vSphere (ZEN-22015)
- Improvements to performance of component grid with large numbers of components. (componentCatalogs and linkable optimizations)
- Disable ping monitoring based on the 'monitored' setting for host components. (ZEN-22206)
- Fix CPU/Mem Reservation fields display. (ZEN-21112)
- Add labels and descriptions to vSphere zProperties. (ZEN-21278)
- Modeling
- Add advanced tuning of modeling transactions via zVSphereModelMpLevel, zVSphereModelMpObjs, zVSphereModelMpIndexObjs.
- Reduce likelihood ConflictError during modeling of large vSphere devices. (ZEN-25488)
- Add support for java 8 JVM (ZEN-25482)
- Fix units for memEntitlement graph (ZEN-25460)
- Extend 'Model Time' field to show also "Waiting For Modeling" (ZEN-21012)
- Event Processing
- Ensure that repeat count increases on open alarms until they are closed so that events do not clear in Zenoss prematurely. (ZEN-25342)
- Auto clear internal heartbeat events on restore (ZEN-24144)
- Fix bug where events may be timestamped in UTC time (ZEN-22724)
- Fix misleading ping-down message on vSphere hosts. (ZEN-22203)
- Performance data collection
- Changed recovery behavior- recover non-timeout errors more frequently. (20 minutes, rather than 4 hours). Place a limit on how much time will be spent on recovery per task, leaving remaining entries for a future polling cycle. This allows more frequent recovery to occur without risking a serious impact on the overall polling cycle time.
- Lowered default query timeout (zVSpherePerfQueryTimeout) from 200 seconds to 25. Failures due to timeout are retried as smaller queries anyway, and a faster failure is good for overall collection time.
- Change default value of zVSpherePerfParallelQueries from 6 to 8, to improve overall query performance, especially on large targets.
- Group all metrics being polled through the raw data feed by the host and cluster to which they relate, when possible. Hash the hosts over a set of 6 sub-tasks, and collect each one separately. This keeps a bad host from slowing down all the collection tasks randomly. (Any such slowdown is restricted to 1/6 of the data being collected)
- Add extensive details to the health report, with an emphasis on grouping errors by host/cluster as described above. Raise events when a particular host or cluster is showing large numbers of errors. Calculate average response times, and distinguish between transient and permanent errors in these reports where appropriate.
- Graph high-level performance collection metrics at the device level (# of counters polled, retries vs normal queries, total elapsed time by task type, etc)
- Impact
- When a ping failure event is found for a host, consider the host to be DOWN, rather than ATRISK, regardless of powerState/connnectionState values (ZEN-24612)
3.4.1
- Support multiple –query options in vsphere_queryperf tool
- Improved component grid performance with Zenoss 5.1.4+
- Use epoll reactor in zenvsphere to support >1024 descriptors.
- Fix off-by-one in chunk size calculation (ZEN-22805)
- Monitor ESX host preparation for NSX networking (ZEN-21157)
- Remove Dynamic View component from navigation, since it is not fully supported (ZEN-16277)
3.4.0
- vSphere Devices can no longer be modeled by zenmodeler or the "Model Device" UI option. Modeling is performed automatically by zenvsphere when new devices are added. The "Model Time" timestamp will reflect the last time a full model was done. These are only performed when needed when zenvsphere is restarted or the connection is lost to vsphere. Otherwise, regular ongoing changes are applied continuously, updating the "Last Change" timestamp only.
- Performance data collection was rewritten to improve its scalability.
- Remove explicit host -> impacts -> cluster impact relationship. (ZEN-20722)
- Prevent VM templates from being modeled. (ZEN-20724)
- Add "Provider" links for datastores, RDMs and LUNs. (ZEN-18029)
- Ensure that modeler optimization is used when possible (ZEN-10279, ZEN-19701)
- Enabled "monitored" checkbox for vSphere components (ZEN-19125)
- Fixed sorting for numeric columns in reports (ZEN-9023)
- Fix for problem on Zenoss 5.0.x where some metric data is lost in large vCenter environments (ZEN-20039)
- User Session events (vim.event.AlreadyAuthenticatedSessionEvent, vim.event.BadUsernameSessionEvent, vim.event.NoAccessUserEvent, vim.event.ServerStartedSessionEvent, vim.event.SessionTerminatedEvent, vim.event.UserLoginSessionEvent, vim.event.UserLogoutSessionEvent) are now sent directly to history.
- Default severity of several events (vim.event.AlarmEmailFailedEvent, vim.event.AlarmScriptFailedEvent, vim.event.AlarmSnmpFailedEvent, vim.event.BadUsernameSessionEvent, vim.event.NoAccessUserEvent) is lowered to Info.
- ESX failure events (esx.net.connectivity, esx.net.dvport.connectivity, esx.net.dvport.redundancy, esx.net.redundancy, esx.net.vmnic.linkstate, esx.scsi.device.io.latency, esx.scsi.device.state, esx.scsi.device.state.permanentloss, esx.storage.connectivity, esx.storage.redundancy) are now mapped so that their corresponding "clear" events will clear the event in Zenoss.
- Enable ping monitoring of vSphere Hosts on their management IPs (ZEN-8412)
- Allow use of nonstandard HTTP/HTTPS ports for vSphere endpoint (ZEN-15110)
- Added requirement for PropertyMonitor 1.0.1 (ZEN-20688)
- Moved "VM to Datastore" report from Enterprise Reports section to vSphere section (ZEN-16153)
- Removed unused "Software" component from the navigation on Device Detail (ZEN-20531)
- Updated legend for "Memory Usage" graph in Clusters for clarity (ZEN-16422)
- Removed tracebacks for authentication errors when hitting vSphere API, because if it's a login error, we know what's wrong and don't need a traceback (ZEN-18760)
- Added "LUNs" report
3.2.1
- Fix for CiscoUCS startup issue (ZEN-18814)
3.2.0
- Improve reliability of modeling of vSphere alarm events (model pre-existing alarms at startup and apply updates to alarms based on change events).
- Make alarm events more easily filtered, with an eventGroup of
vim.event.AlarmEventand an eventClassKey of the vSphere alarm systemName for vmware's predefined events, oruserdefined.<id>for user defined alarms. - Remove the "overall status" column and stop collecting this value from vSphere. Compute equivalent value based upon the most severe active alarm on the element.
- Impact now relies upon active events (alarms) and ignores the "overall status". Undesired alarms may now be more easily suppressed or transformed to improve impact view, and the root cause will reflect the responsible alarms. (ZEN-16728)
- Add model collection tuning options (zVSphereModelIgnore, zVSphereModelCache)
- Reduce zenhub load by suppressing duplicate (unnecessary) setDiskNames calls on datastores
- Add several predefined thresholds (disabled by default)
- Improved logging and idle connection cleanup in java txvsphere process
- Improved connection performance and FD leak in java txvsphere process when an endpoint is unresponsive
- Add support for Layer2 ZenPack and network map
- Fix time zone handling for event collection
- Add a link from LUN to an underlying storage device (ZEN-18029)
- Increase default all vSphere API calls. Lowered timeout during login, and raised during performance querying.
- Collect host hardware vendor/model and management IP addresses
- Fix error encountered when a vApp contains child resource pools (ZEN-17670)
3.1.3
- Fix potentially missed linkage of UCS service profiles to vSphere hosts. (ZEN-18631)
3.1.2
- Fix ConnectionStateError. (ZEN-16924)
3.1.1
- Fix bug that halted data collection that after a single TimeoutError (ZEN-10927)
- Fix handling of broken standalone resources in vSphere (ZEN-16382)
- Background java process exits when zenvsphere is shut down (ZEN-15431)
- Ensure java process is restarted automatically if zenpack is upgraded
- Restart the java process with proper settings if it is started with default memory settings by zenmodeler (ZEN-16833)
- Fixes to VMware Utilization report (ZEN-15523)
- Add hypervisor version to UI (ZEN-15901)
- Model optimization on Zenoss >= 4.2.4 SP728, 4.2.5 SP316 and 5.0.0. (ZEN-17058)
3.1.0
- Add support for Zenoss Analytics
- Add support for VMware vSphere 5.5
- Improvements to impact model
- This zenpack now depends upon ZenPacks.zenoss.PropertyMonitor.
- Corrected handling of errors in performance data collection (ZEN-11086)
- Improved vsphere_queryperf and added interactive testing of data sources in monitoring templates
- Fix traceback that can occur after a connection has been lost and reconnected (ZEN-11033)
- Fix datastore-released performance data collection under vmware 4.1 (ZEN-11110)
- Fixed file descriptor leak that would result in an endless cycle of TimeoutErrors under certain conditions (ZEN-10927)
- Avoid "pool exhaustion" errors by terminating the oldest connection to vsphere when the session limit is exceeded, rather than immediately failing. (ZEN-10325)
- Model linkSpeed on physical NICs and compute bandwidth utilization.
- The model used uncommitted percentages on datastores, and add graphs of capacity utilization over time (ZEN-11256)
- Add graphs of VM state (ZEN-11255)
- Add total memory to Cluster and Host graphs (ZEN-10890)
- Add VMWare tools, VM Hardware, and ESX software versions. (ZEN-13442)
- Correct units for storageCommitted and storageUncommitted (ZEN-15233)
- Separate vApp and Pool counts on Datacenter grid (ZEN-15272)
- Fix potential exception in default event mapping for vSphere (ZEN-12410)
- Improve error reporting when invalid or duplicate hostnames or IPs are specified while adding an endpoint (ZEN-11907, ZEN-14272)
- Properly indicate if there are open events for VMs and DistributedVirtualSwitches (ZEN-12434)
- Ignore invalid NICs with no mac address (ZEN-10154)
- Calculate vm_count for ResourcePools recursively. (ZEN-14262)
- Correct issue where relationships between Datastore and LUN could be missed during the initial model (ZEN-13124)
- Add support for performance counters on vNICs (ZEN-12106)
3.0.4
- Reduction of invalidations caused by vSphere model changes. (ZEN-10838)
- Remove modeling of guestHeartbeatStatus. (ZEN-10838)
- Ignore pNICs with empty MAC addresses. (ZEN-10836)
3.0.2
- Disable modeling optimization that led to POSKeyError errors.
- Multiple improvements in vSphere API error recovery and session management.
- Reduce pool exhaustion issues. Add related tuning options.
- Continue collecting data when /Status/Ping events exist for endpoints.
- Fix error caused by /usr/bin/java being non-existent or the wrong JRE.
- Fix error caused by noexec option on /tmp filesystem. (ZEN-10076)
- Notify the user of an attempt to add a duplicate endpoint. (ZEN-10741)
- More detailed logging.
3.0.1
- Add vsphere_gather and vsphere_queryperf command-line troubleshooting tools.
- Add power state to VM component display panel.
- Add LUN ID to LUN component display panel.
- Add proper counting of VMs for licensing purposes.
- Fix bug that would prevent editing of VMware vSphere datasources on Zenoss 4.1.
- Fix SAN storage impact relationships.
- Fix modeling bug on some vSphere endpoints.
3.0.0
- Initial release.