Google Cloud Platform
ZenPacks.zenoss.GoogleCloudPlatform
The Google Cloud Platform ZenPack adds support for monitoring resources deployed in Google Cloud.
Currently the following services are supported.
- Compute Engine (GCE)
- Kubernetes Engine (GKE)
- Cloud Dataflow
- Cloud Functions
- Cloud Storage
- BigTable
Releases
Version 1.2.1 Download
- Released: 2024-05-02
- Required ZenPacks: ZenPackLib ZenPack, PythonCollector ZenPack
- Compatible with Zenoss Cloud, and Zenoss 6.7
Version 1.2.0 Download
- Released: 2019-12-13
- Required ZenPacks: ZenPackLib ZenPack, PythonCollector ZenPack
- Compatible with Zenoss Cloud, and Zenoss 6.7
Features
The following features are available to help you monitor resources deployed in Google Cloud Platform.
Discovery
The following component types will be automatically discovered through Google Cloud Platform APIs. The components, their properties, and their relationships will be periodically remodeled to provide automatically up-to-date monitoring.
Projects
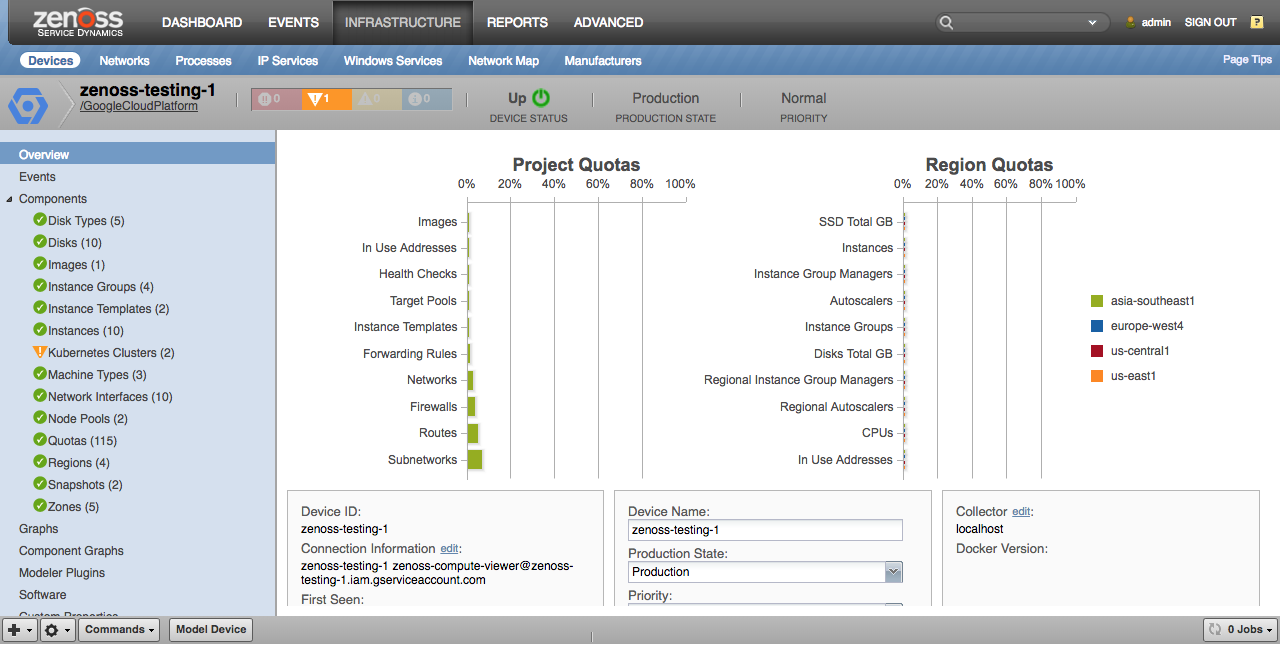
Each Google Cloud Platform project to be monitored must be added to Zenoss. The resulting Zenoss "device" equates to this project, and all of the resources within that project become components of the project in Zenoss.
Projects
Properties
- n/a
Relationships
- Regions
- Zones
- Images
- Snapshots
- Instance Templates
- Kubernetes Clusters
- Quotas
- Dataflows
All Compute Engine (GCE) components will have the following standard properties.
Properties
- Name
- Creation Timestamp
- Kind
- GCE ID
- GCE Self-Link
All Kubernetes Engine (GKE) components will have the following standard properties.
Properties
- Name
- Creation Timestamp
- Self-Link
Regions
Regions will only be discovered if the project contains instances in the region.
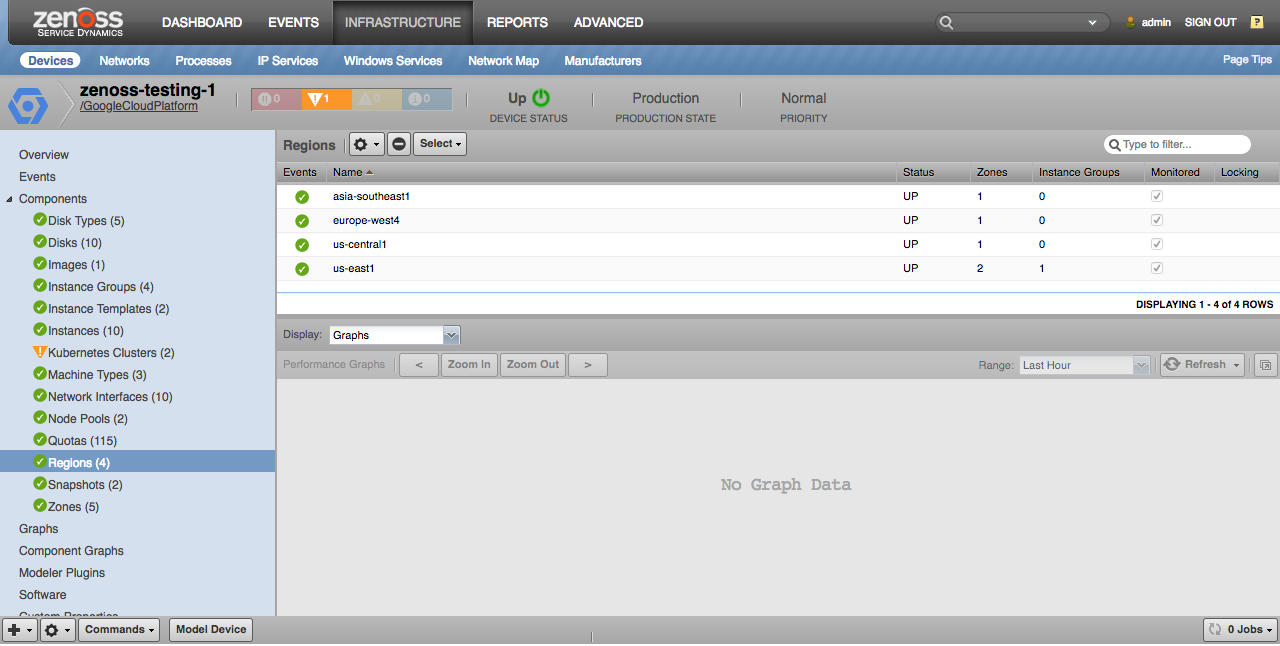
Properties
- Description
- Status
Relationships
- Project
- Zones
- Instance Groups
- Quotas
- Functions
- Dataflows
Zones
Zones will only be discovered if the project contains instances in the zone.
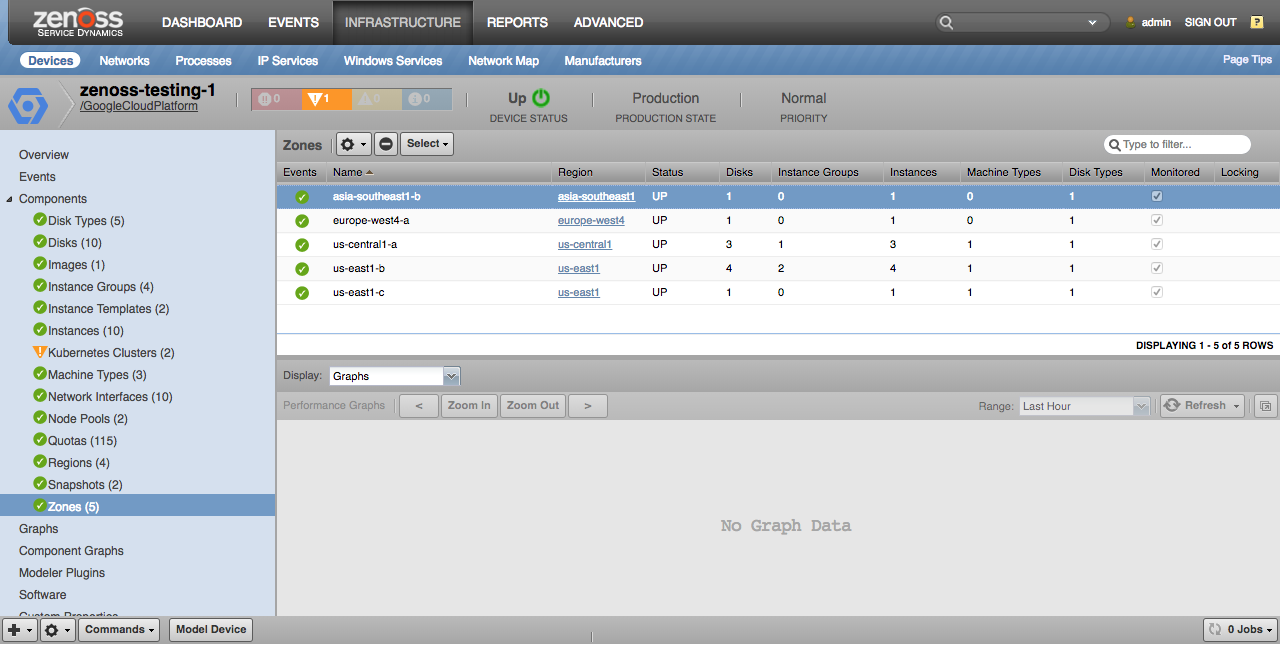
Properties
- Description
- Status
Relationships
- Project
- Region
- Instance Groups
- Machine Types
- Disk Types
- Disks
- Instances
Images
Images will only be discovered if they're the source image for at least one disk within the project.
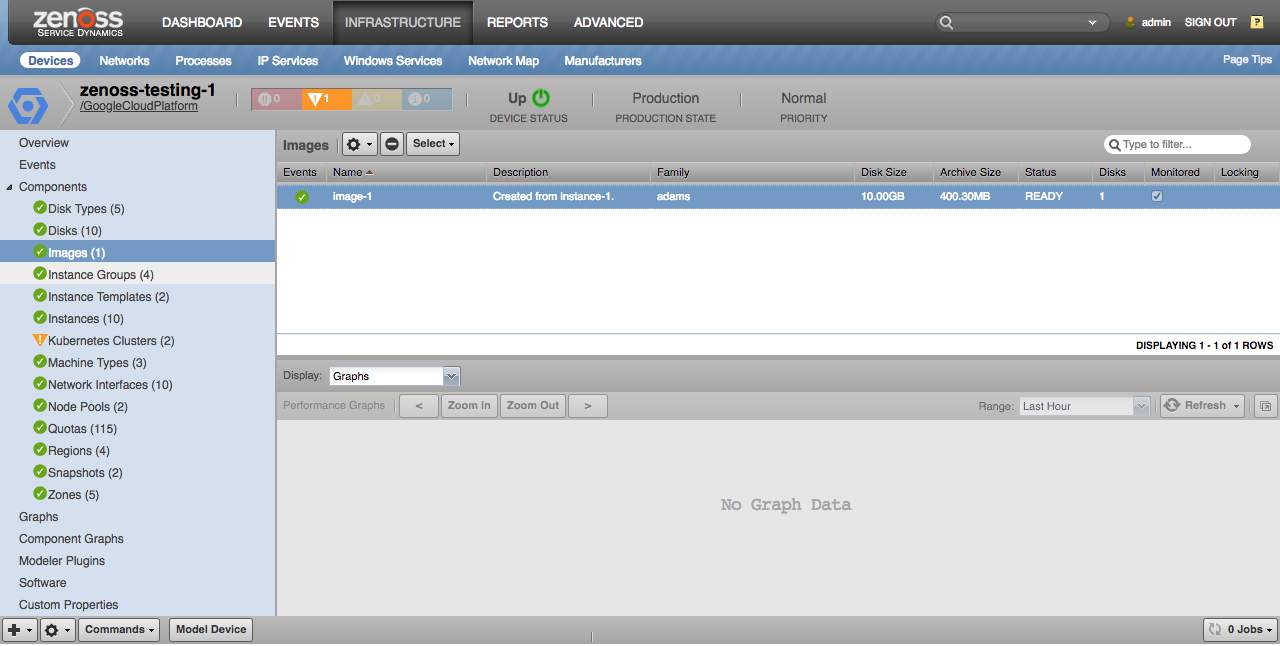
Properties
- Description
- Family
- Disk Size
- Archive Size
- Status
Relationships
- Project
- Disks
Snapshots
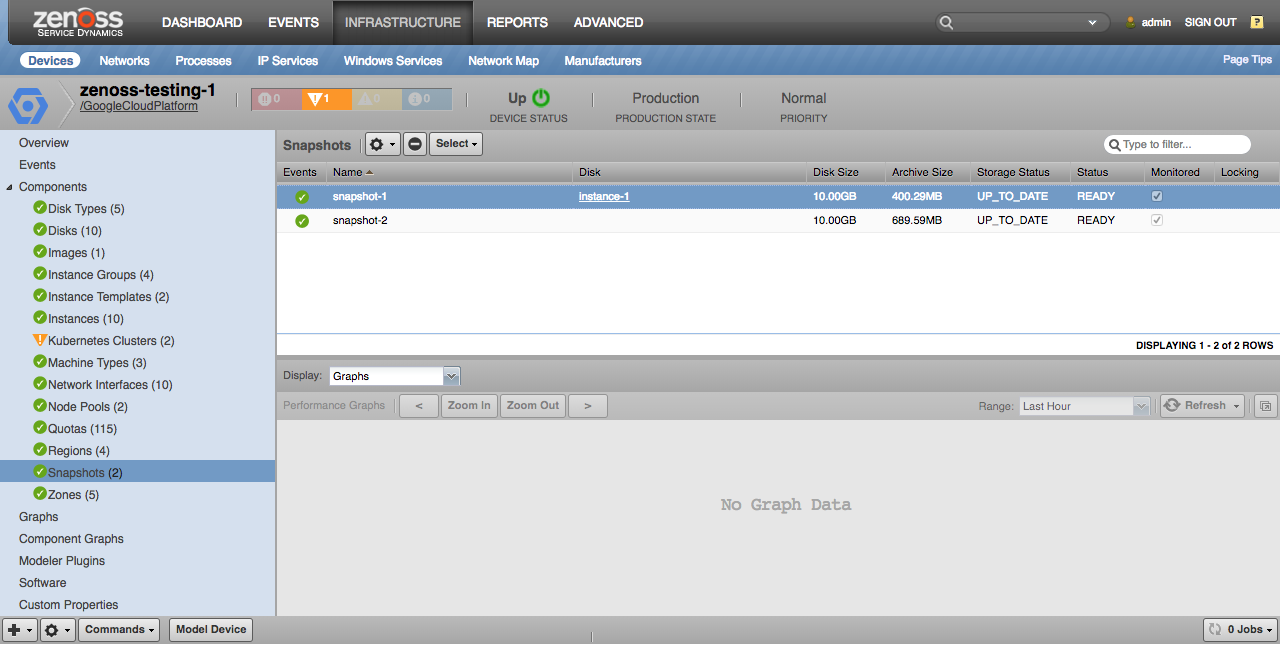
Properties
- Disk Size
- Archive Size
- Storage Status
- Status
Relationships
- Project
- Source Disk
Instance Templates
Instance templates will only be discovered if they were the template for an instance within the project, or if they're the template for a managed instance group in the project.
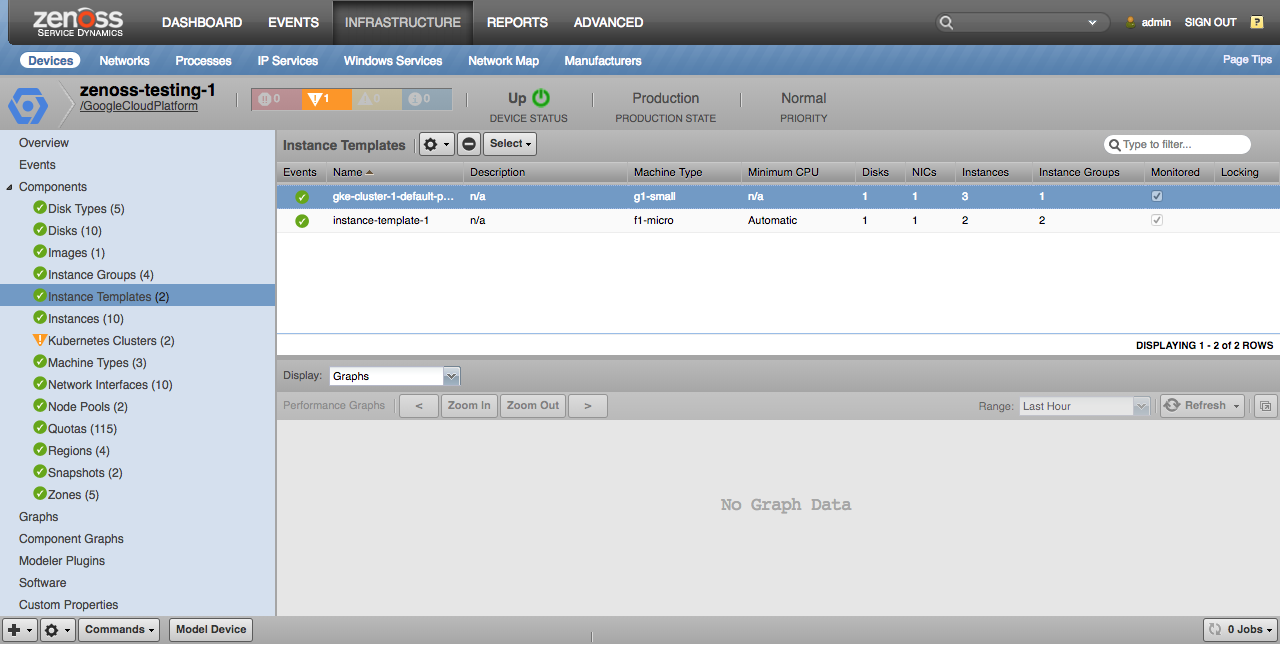
Properties
- Description
- Machine Type
- Minimum CPU Platform
- Number of Disks
- Number of Network Interfaces
Relationships
- Project
- Instances
Quotas
All project-level and region-level quotas with a limit set will be modeled.
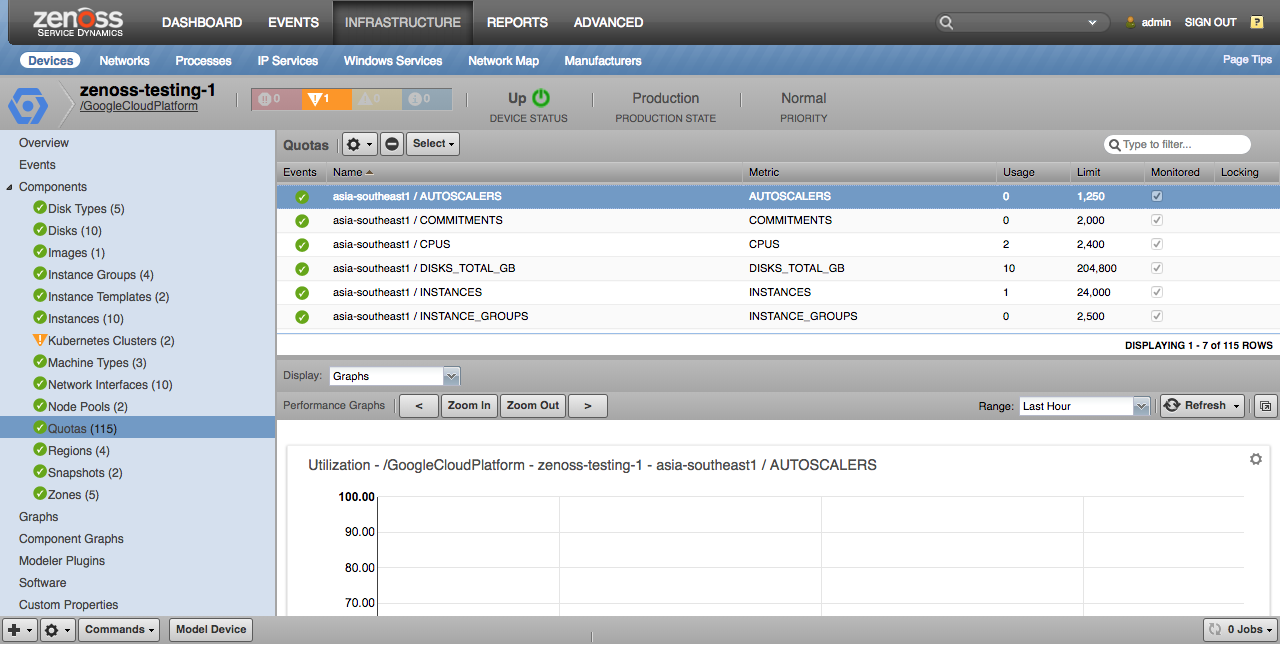
Properties
- Metric
- Usage
- Limit
Relationships
- Project or Region
Instance Groups
Instance groups will only be discovered if they contain at least one instance. This includes multi-zone (region) instance groups, single-zone instance groups, and managed and unmanaged instance groups.
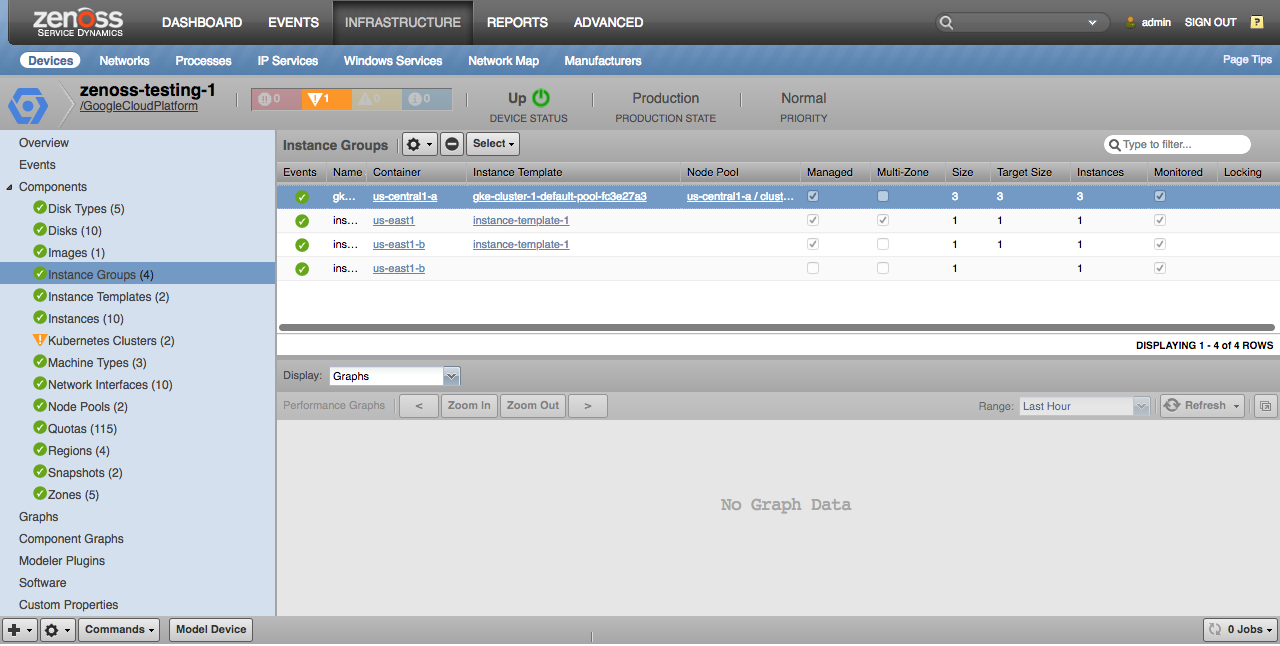
Properties
- Description
- Managed
- Multi-Zone
- Size
- Target Size
- Base Instance
Relationships
- Region or Zone
- Instance Template
- Instances
- Kubernetes Node Pool
Machine Types
Machine types will only be discovered if used by an instance within the project. Note that it is possible for a machine type of the same name to vary in capabilities from region to region. So you will see multiple machine types of the same name that only vary by their zone.
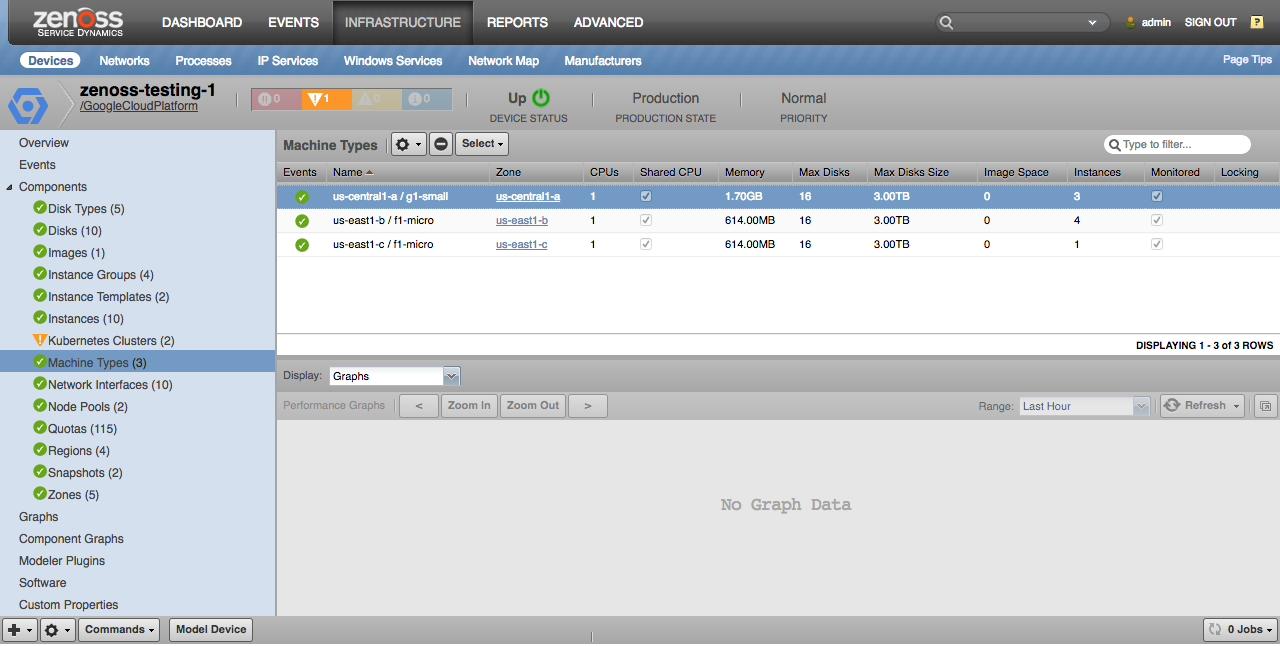
Properties
- Description
- Guest CPUs
- Shared CPUs
- Memory
- Maximum Persistent Disks
- Maximum Persistent Disk Size
- Image Space
Relationships
- Zone
- Instances
Disk Types
Disk types will only be discovered if used by a disk within the project. Note that it is possible for a disk type of the same name to vary in capabilities from region to region. So you will see multiple disk types of the same name that only vary by their zone.
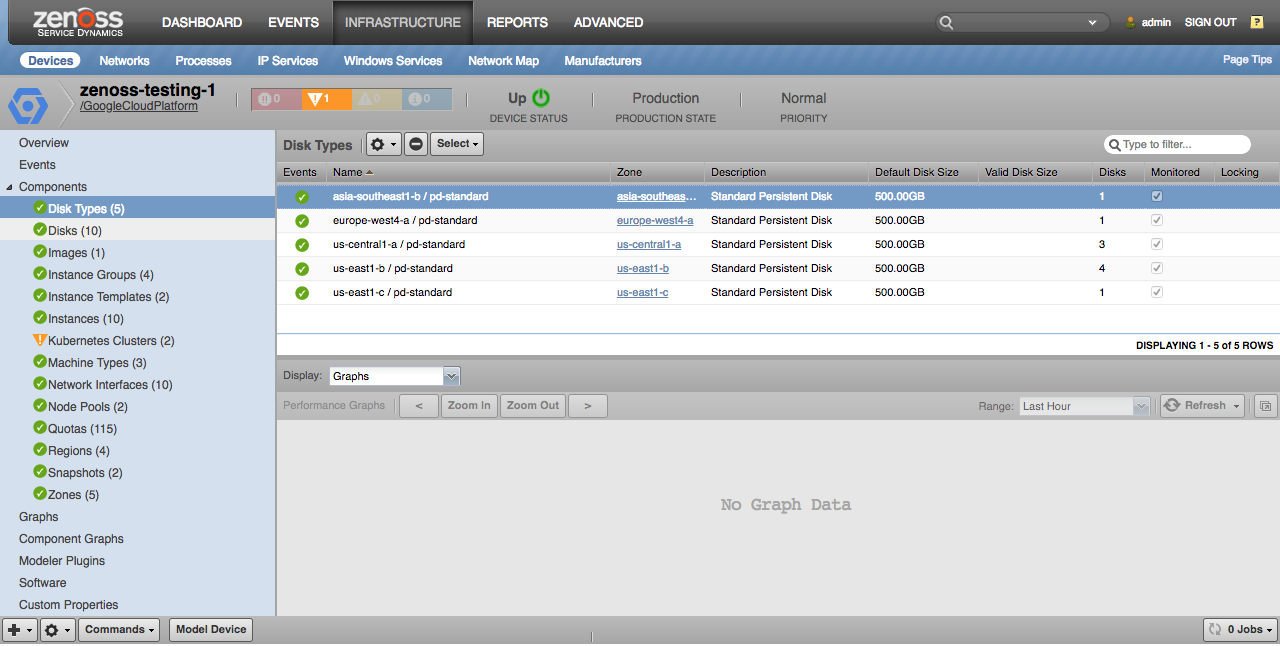
Properties
- Description
- Default Disk Size
- Valid Disk Size
Relationships
- Zone
- Disks
Disks
Disks will only be discovered if they're attached to at least once instance within the project.
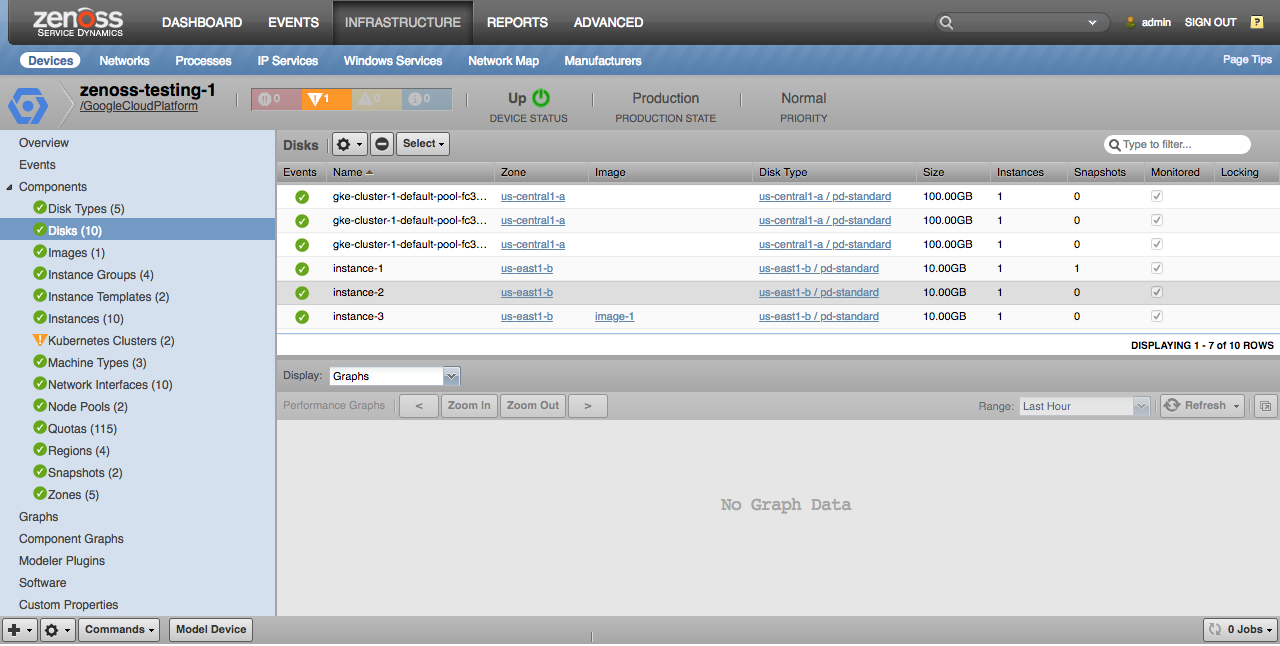
Properties
- Size
- Last Attach Timestamp
- Last Detach Timestamp
Relationships
- Zone
- Disk Type
- Source Image
- Snapshots
- Instances
Instances
All instances within the project will be discovered.
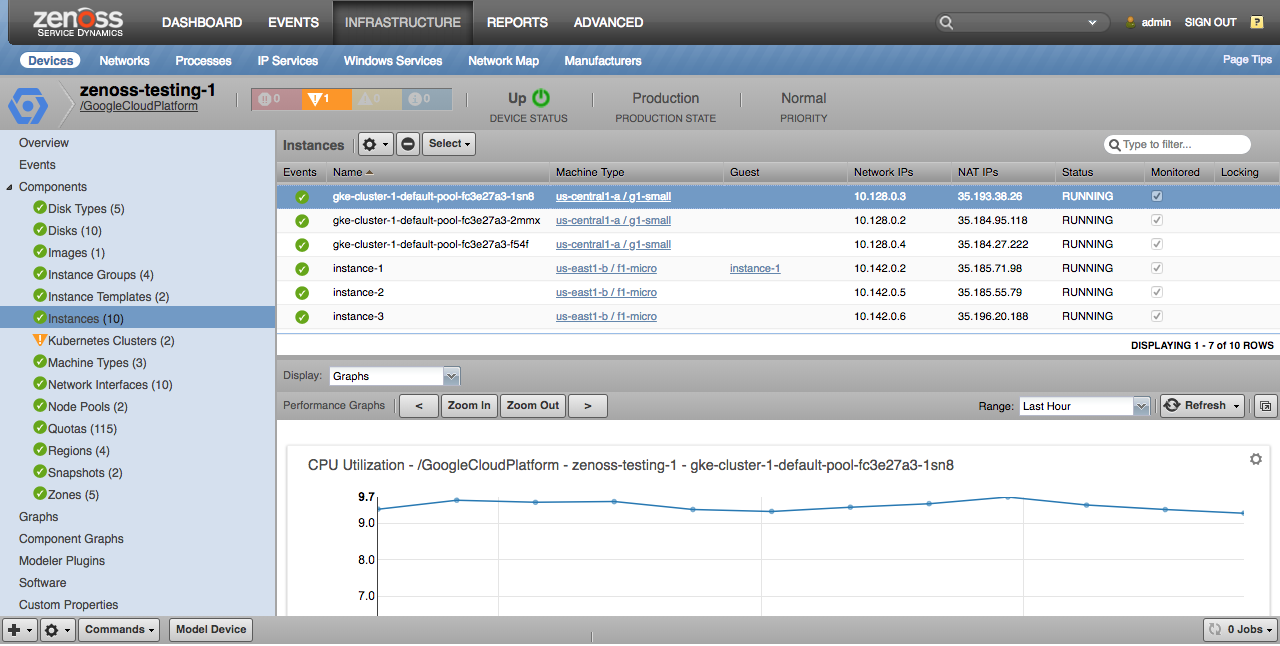
Properties
- Description
- Guest
- CPU Platform
- Management IP
- Network IPs
- NAT IPs
- IP Forwarding
- In Kubernetes
- Kubernetes ZenPack Node
- Status
Relationships
- Zone
- Machine Type
- Disks
- Network Interfaces
- Instance Group
- Instance Template
Network Interfaces
All instance network interfaces within the project will be discovered.
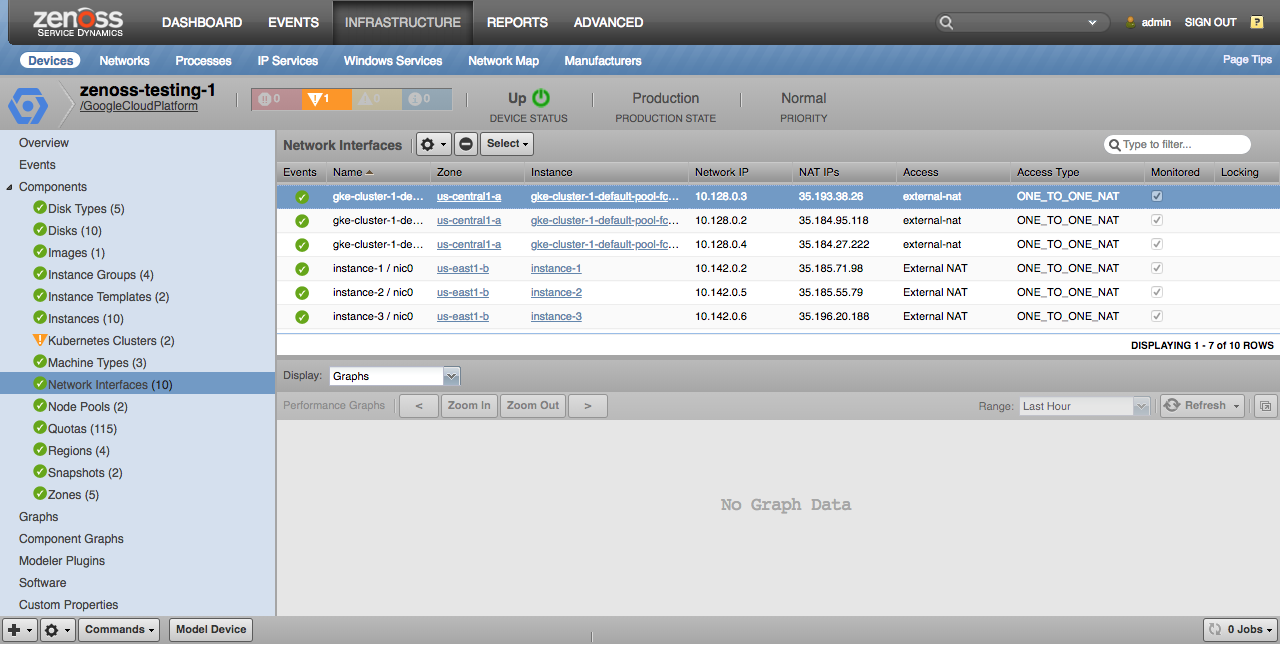
Network Interfaces: Properties: Network IP, NAT IPs, Access, Access Type: Relationships: Instance
Kubernetes Clusters
All Kubernetes clusters within the project will be discovered.
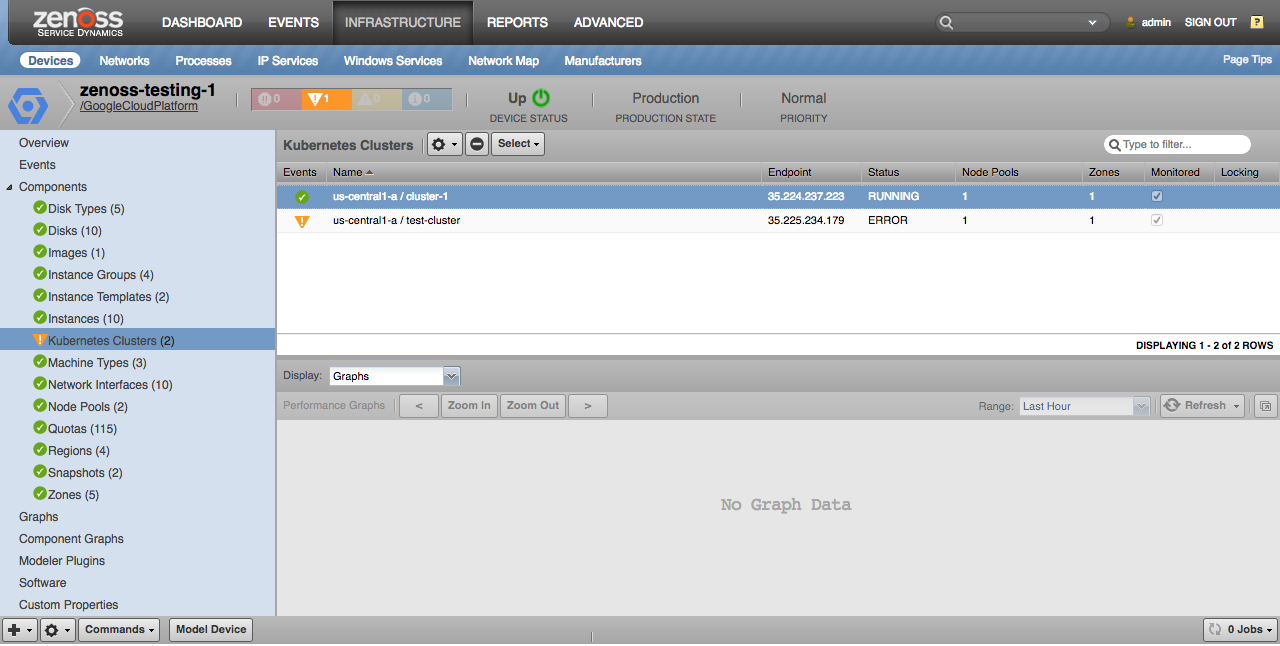
Kubernetes Clusters: Properties: Cluster Ipv4 CIDR, Node Ipv4 CIDR Size, Services Ipv4 CIDR, Current Master Version, Initial Cluster Version, Logging service, Monitoring service, Endpoint, Network, Subnetwork, Current Node Count, Kubernetes ZenPack Cluster, Status: Relationships: Project, Zones, Node Pools
Kubernetes Node Pools
All Kubernetes node pools within the project will be discovered.
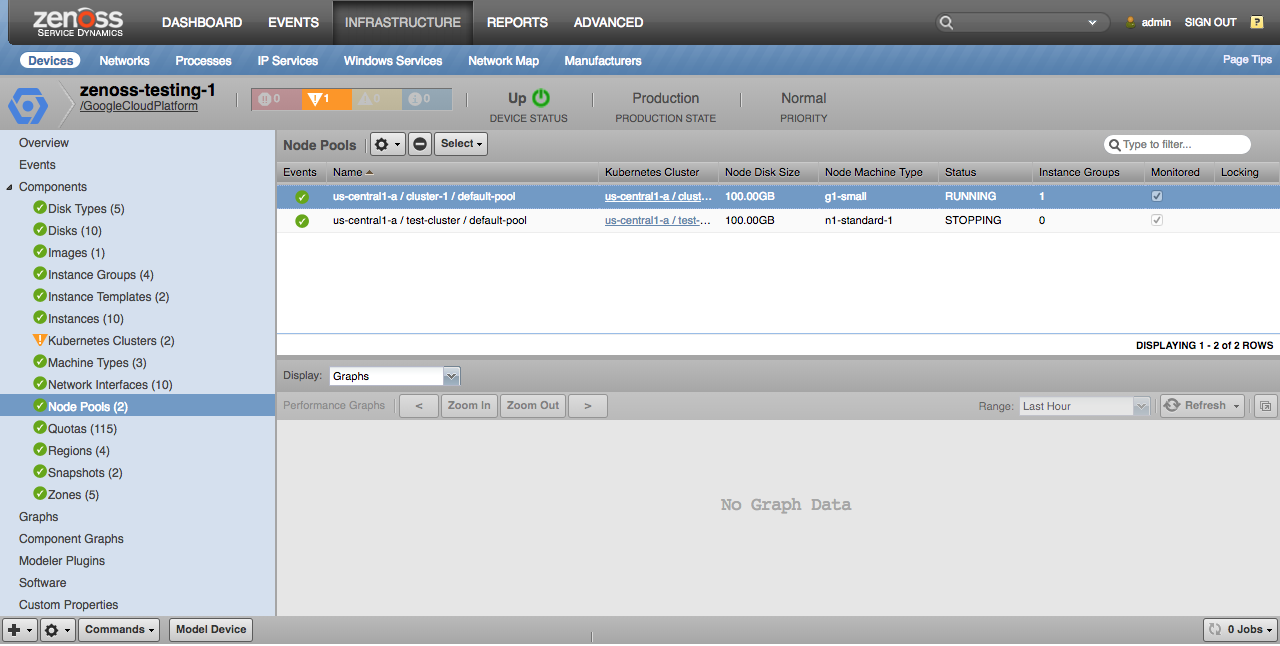
Kubernetes Node Pools: Properties: Version, Initial Node Count, Node Disk Size, Node Image Type, Node Service Account, Node Machine Type, Status: Relationships: Cluster, Instance Groups
Cloud Functions
All Cloud Functions within a region will be discovered.
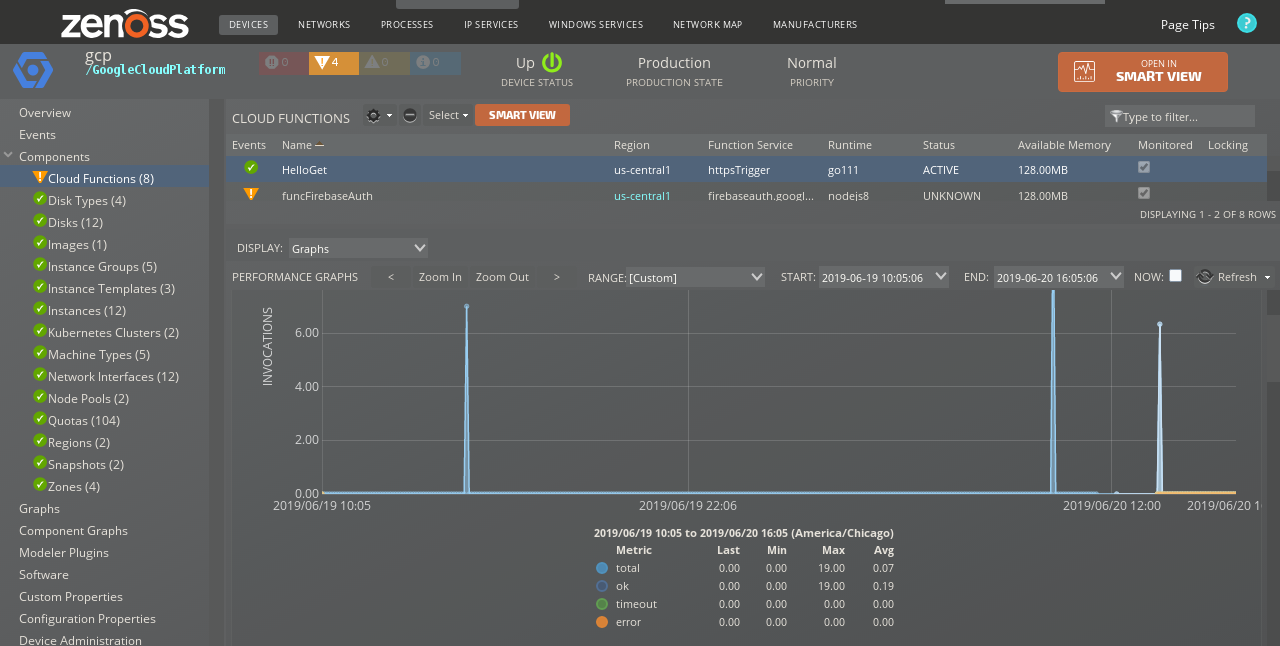
Cloud Functions
Properties: Full Name, Service, Runtime, Status, Available Memory, Account Email Relationships : Project, Region
Dataflow Jobs
Dataflow Jobs within a project will be discovered with appropriate zGoogleCloudPlatformDataflowJobNamesModeled.
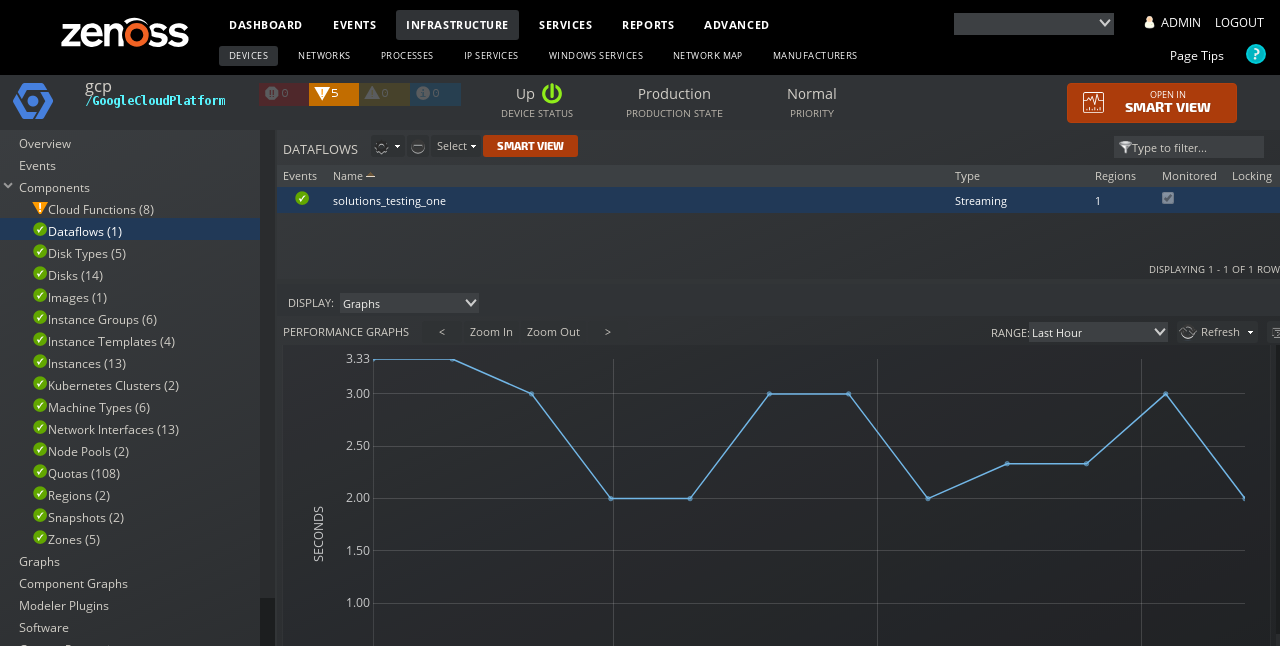
Dataflow Jobs
Properties: Name, Job Type, Current State Time, Create Time, Start Time, Version, SDK Version, Display Name, SDK Support Status Relationships : Project, Region
BigQuery Datasets
BigQuery Datasets within a project will be discovered with appropriate zGoogleCloudPlatformBigQueryDatasetsModeled.
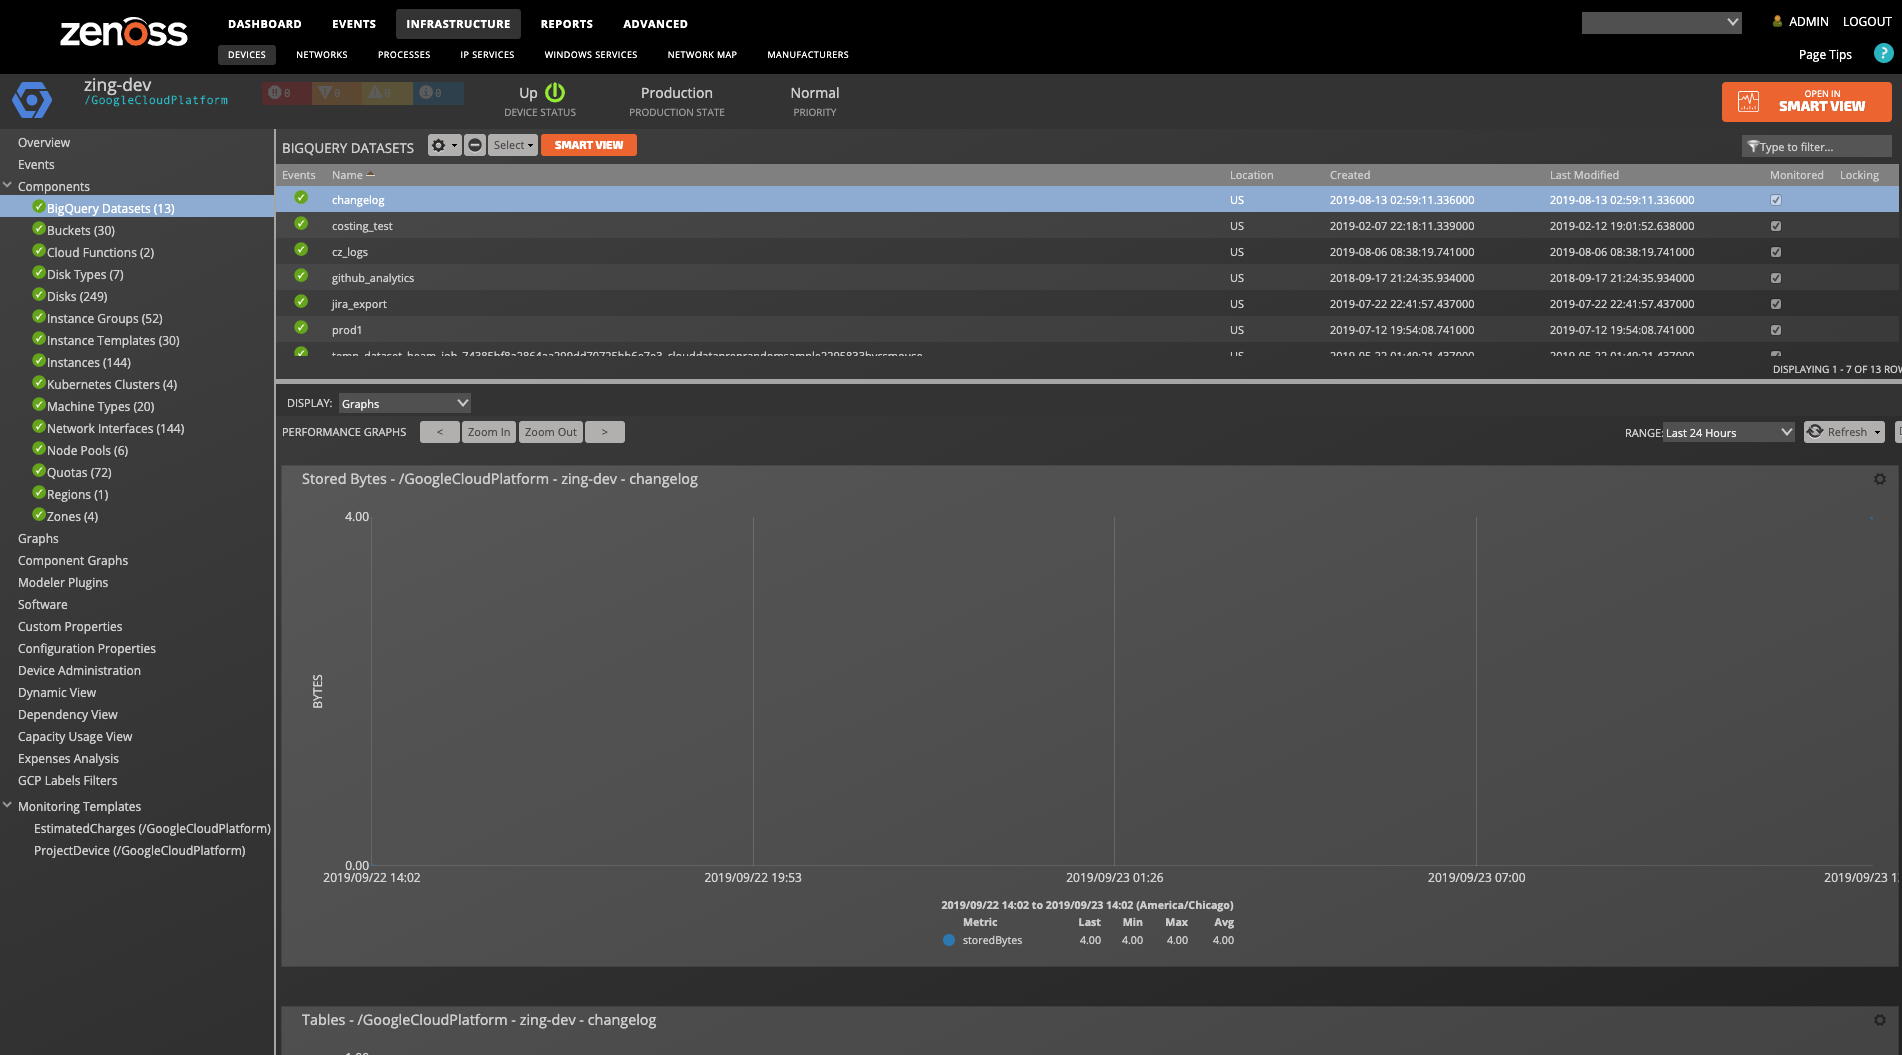
BigQuery Datasets
Properties: Name, Friendly Name, Location, Creation Time, Last Modified Time, Access Relationships : Project
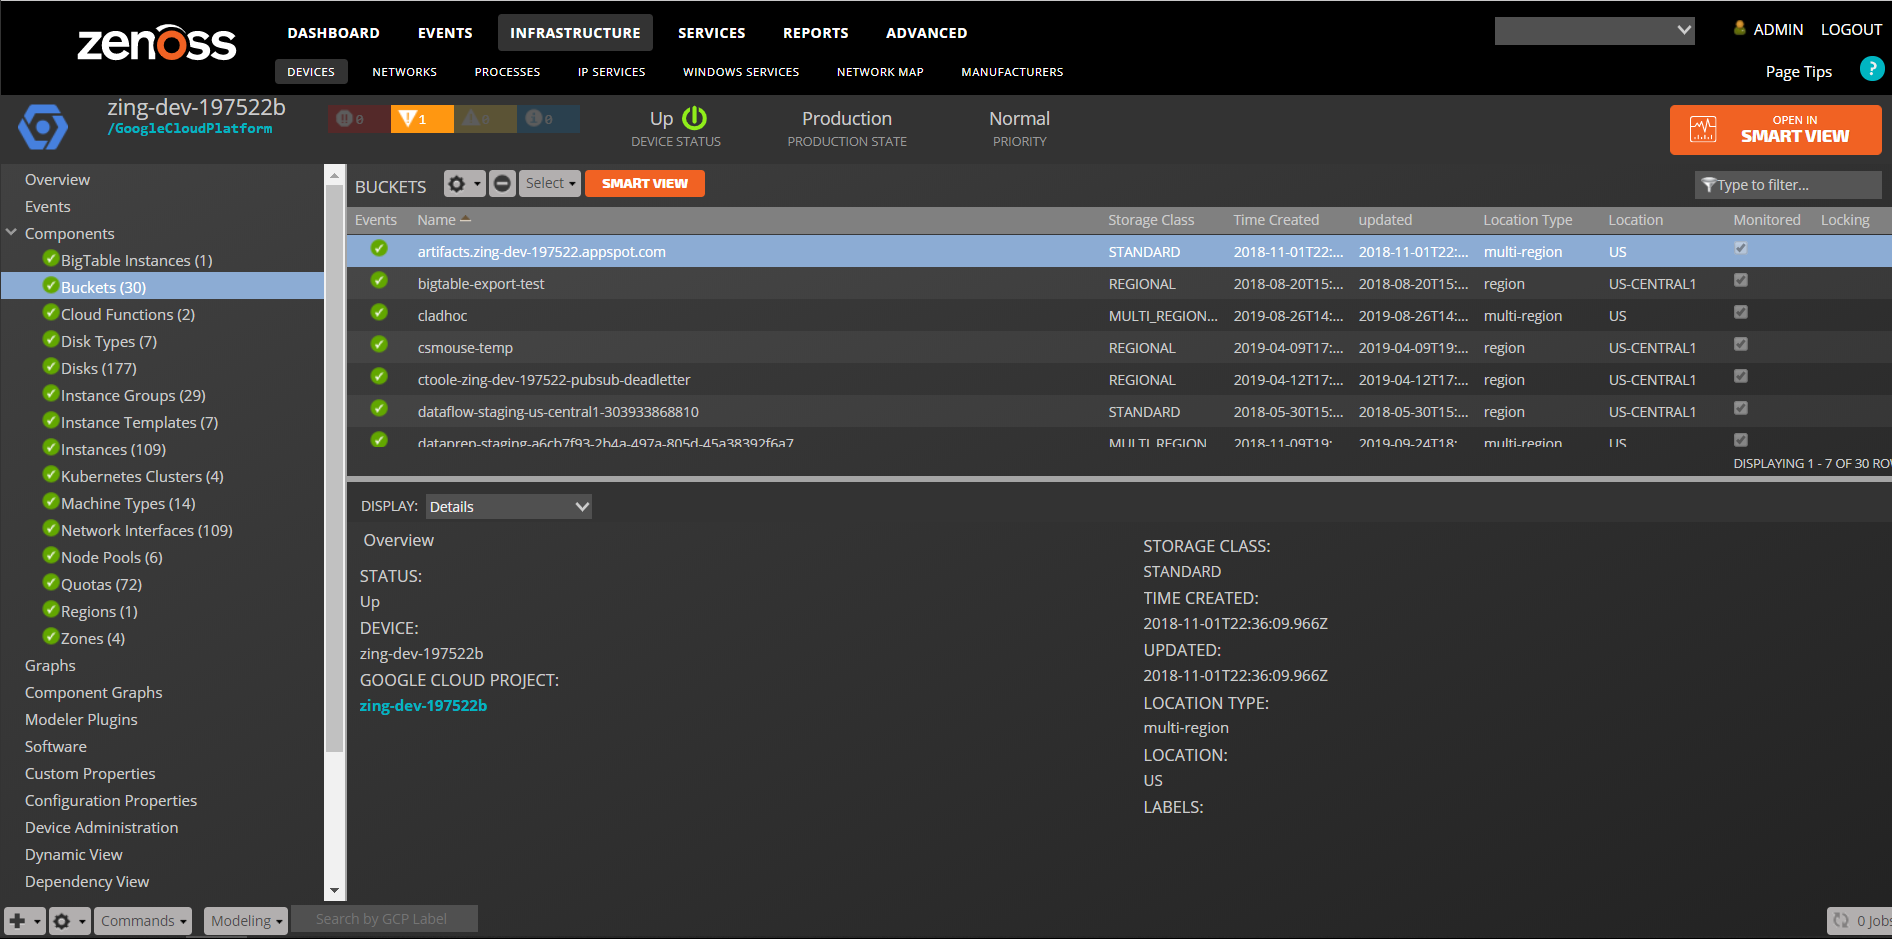
Storage Buckets
Properties: Name, Storage Class, Time Created, Time Updated, Location, Location Type, Lablels Relationships : Project
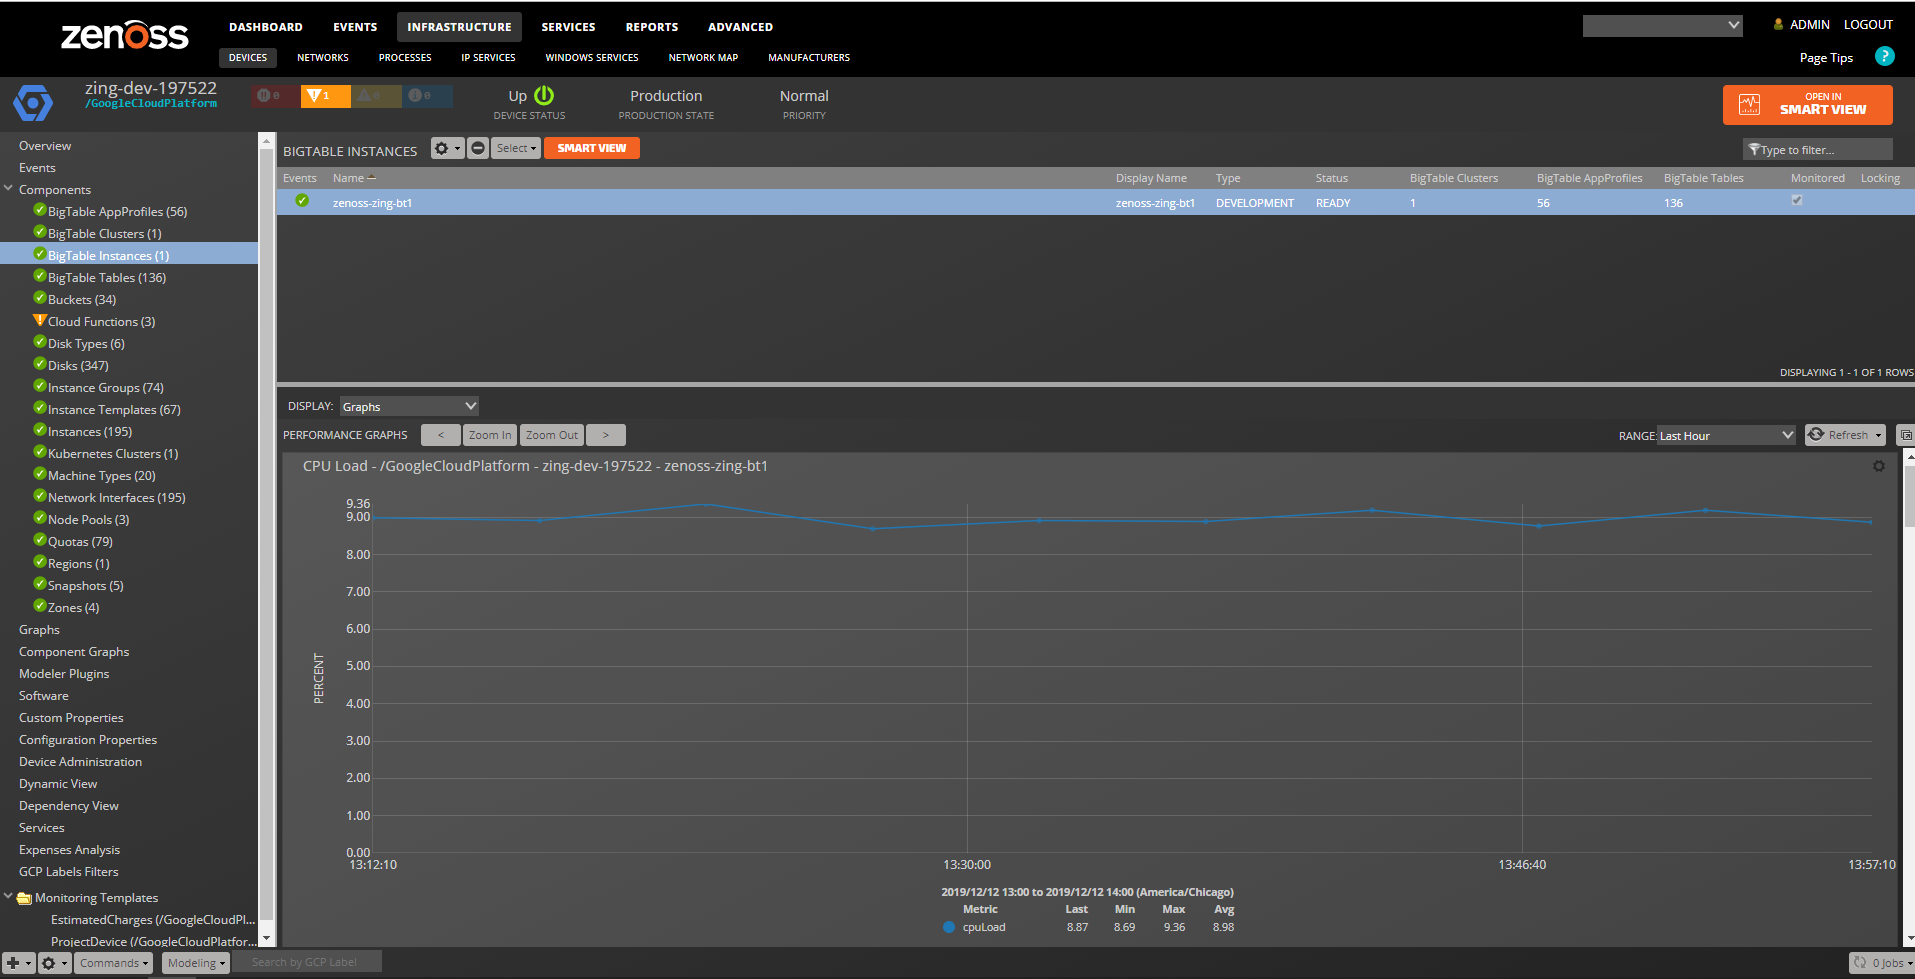
BigTable Instances
Properties: Full Name, Display Name, Instance Type, Lablels Relationships : Project, BigTable Clusters, BigTable AppProfiles
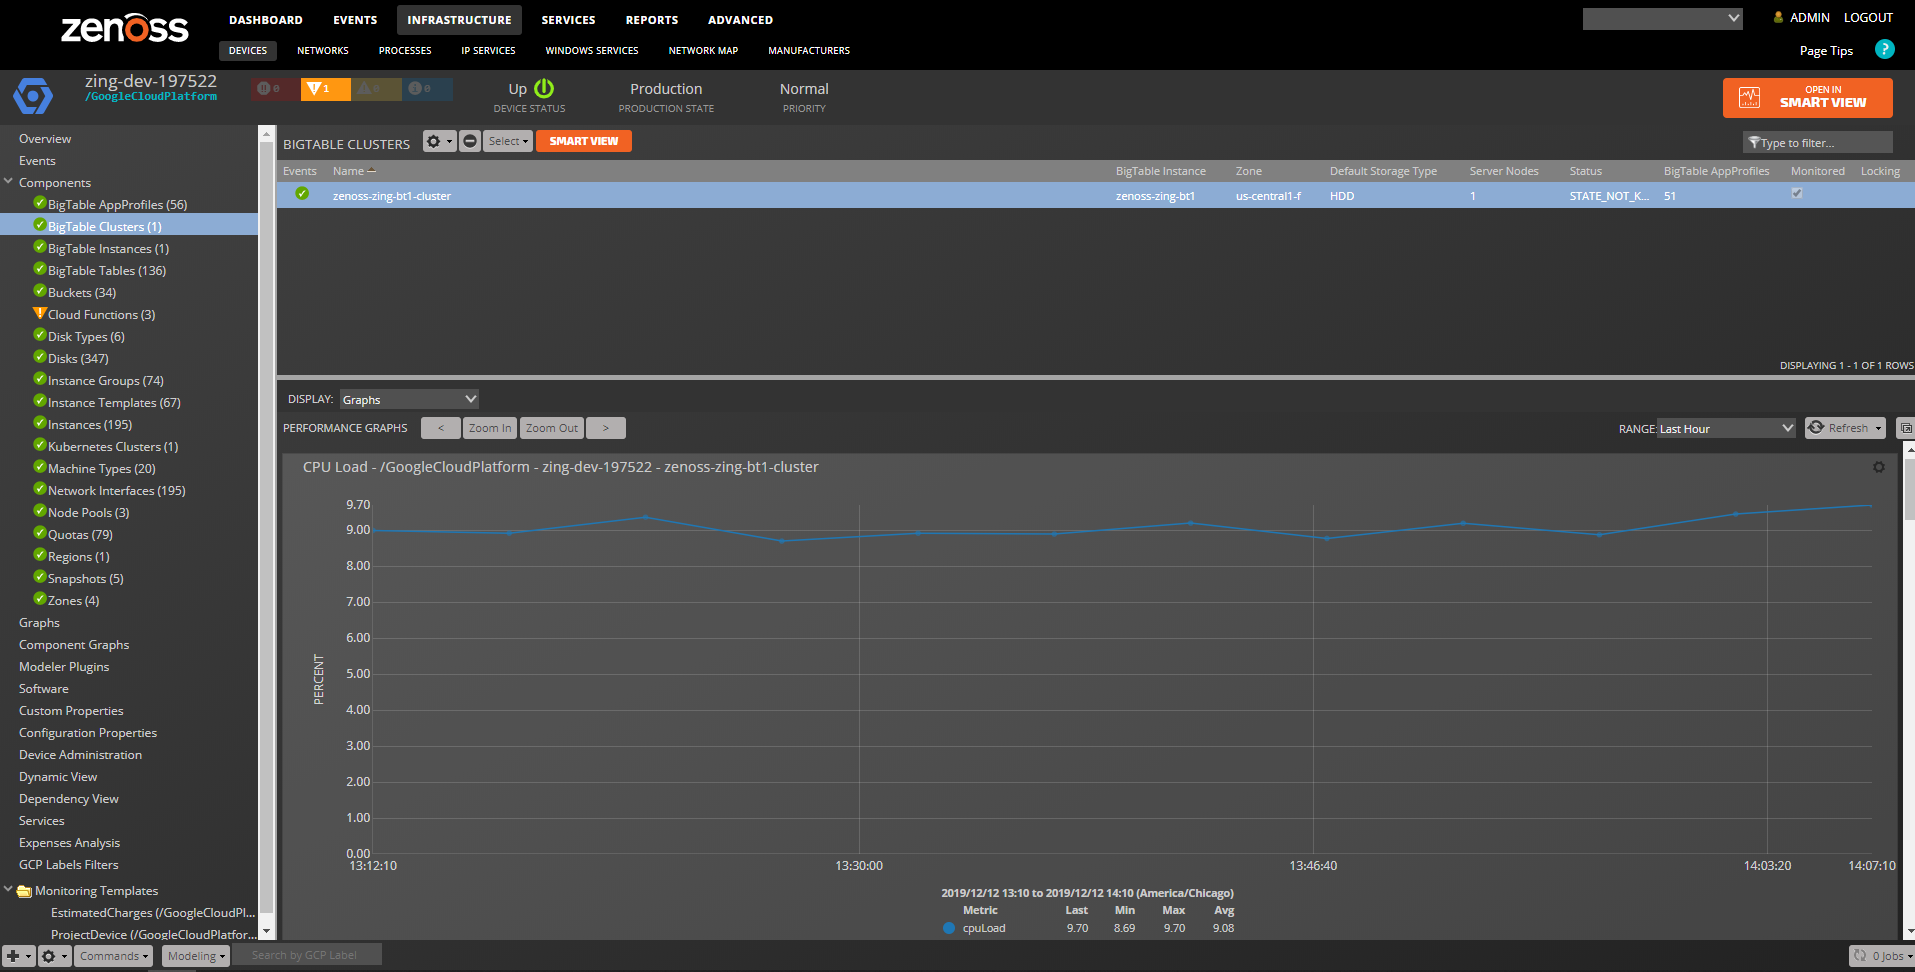
BigTable Clusters
Properties: Full Name, Default Storage Type, Server Nodes Relationships : Zone, BigTable Instance, BigTable AppProfiles
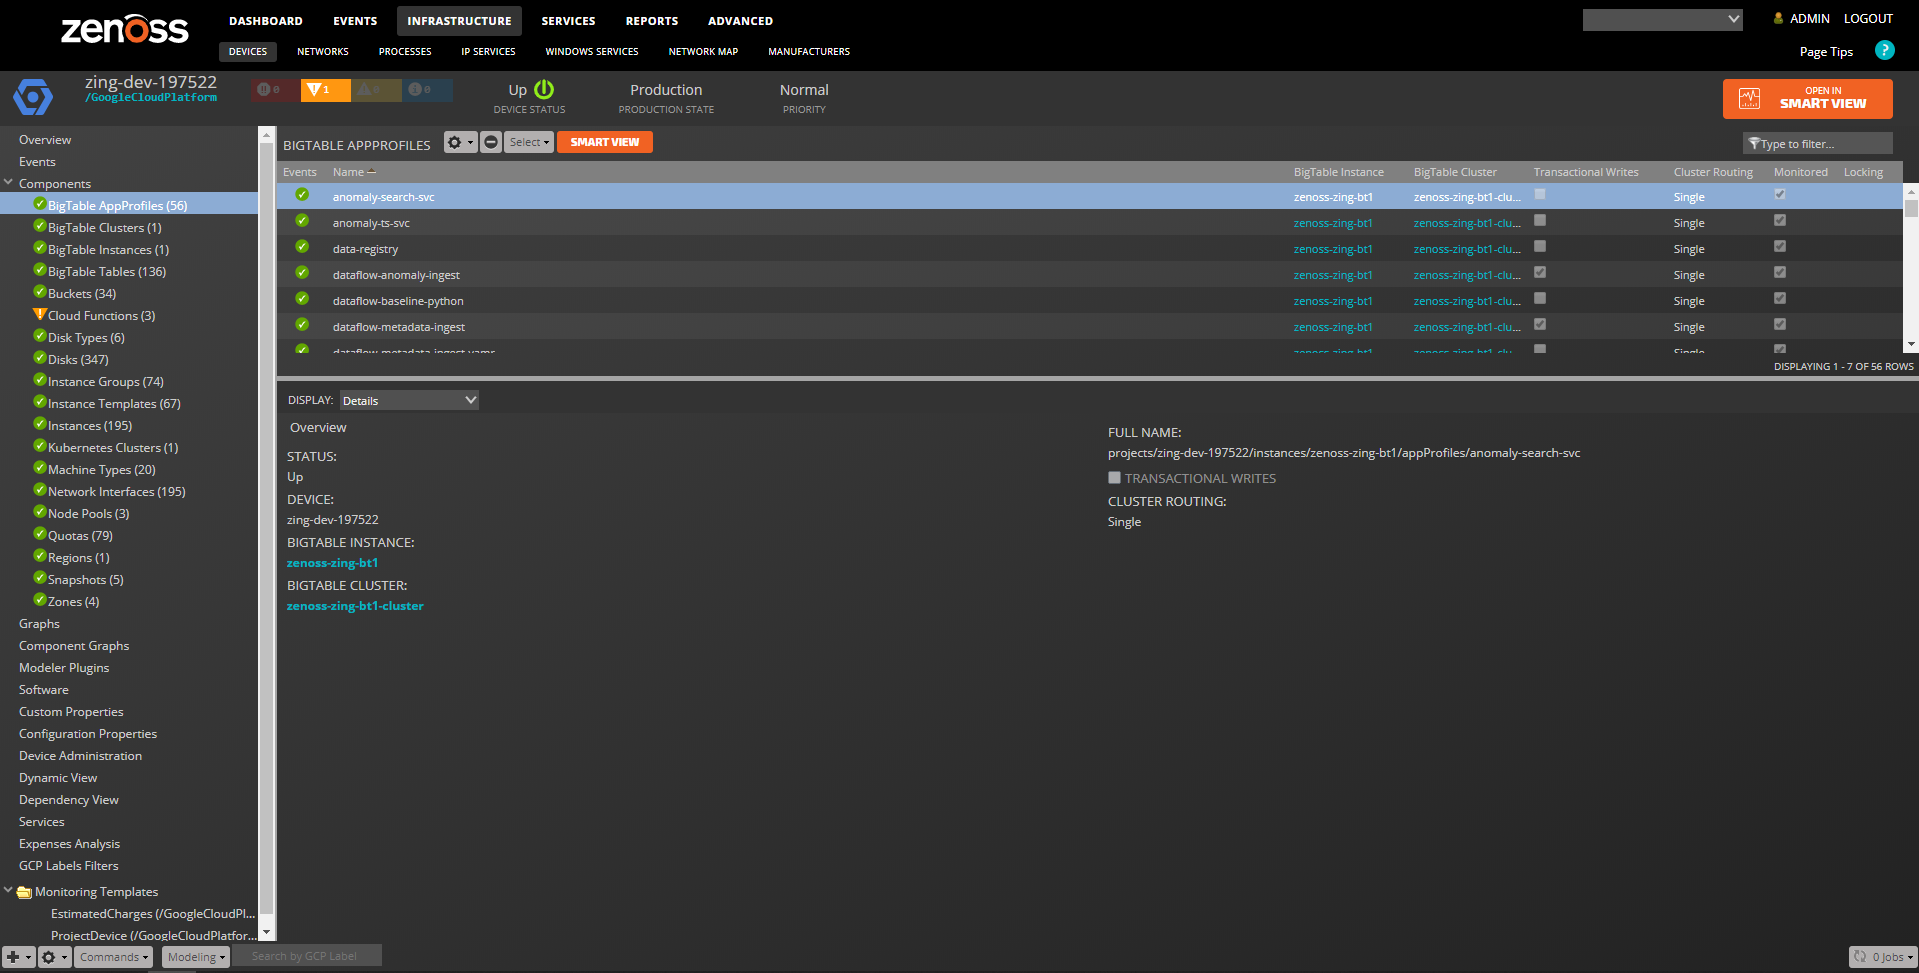
BigTable App Profiles
Properties: Full Name, Allow Transactional Writes, Cluster Routing Relationships : BigTable Instance, BigTable Cluster
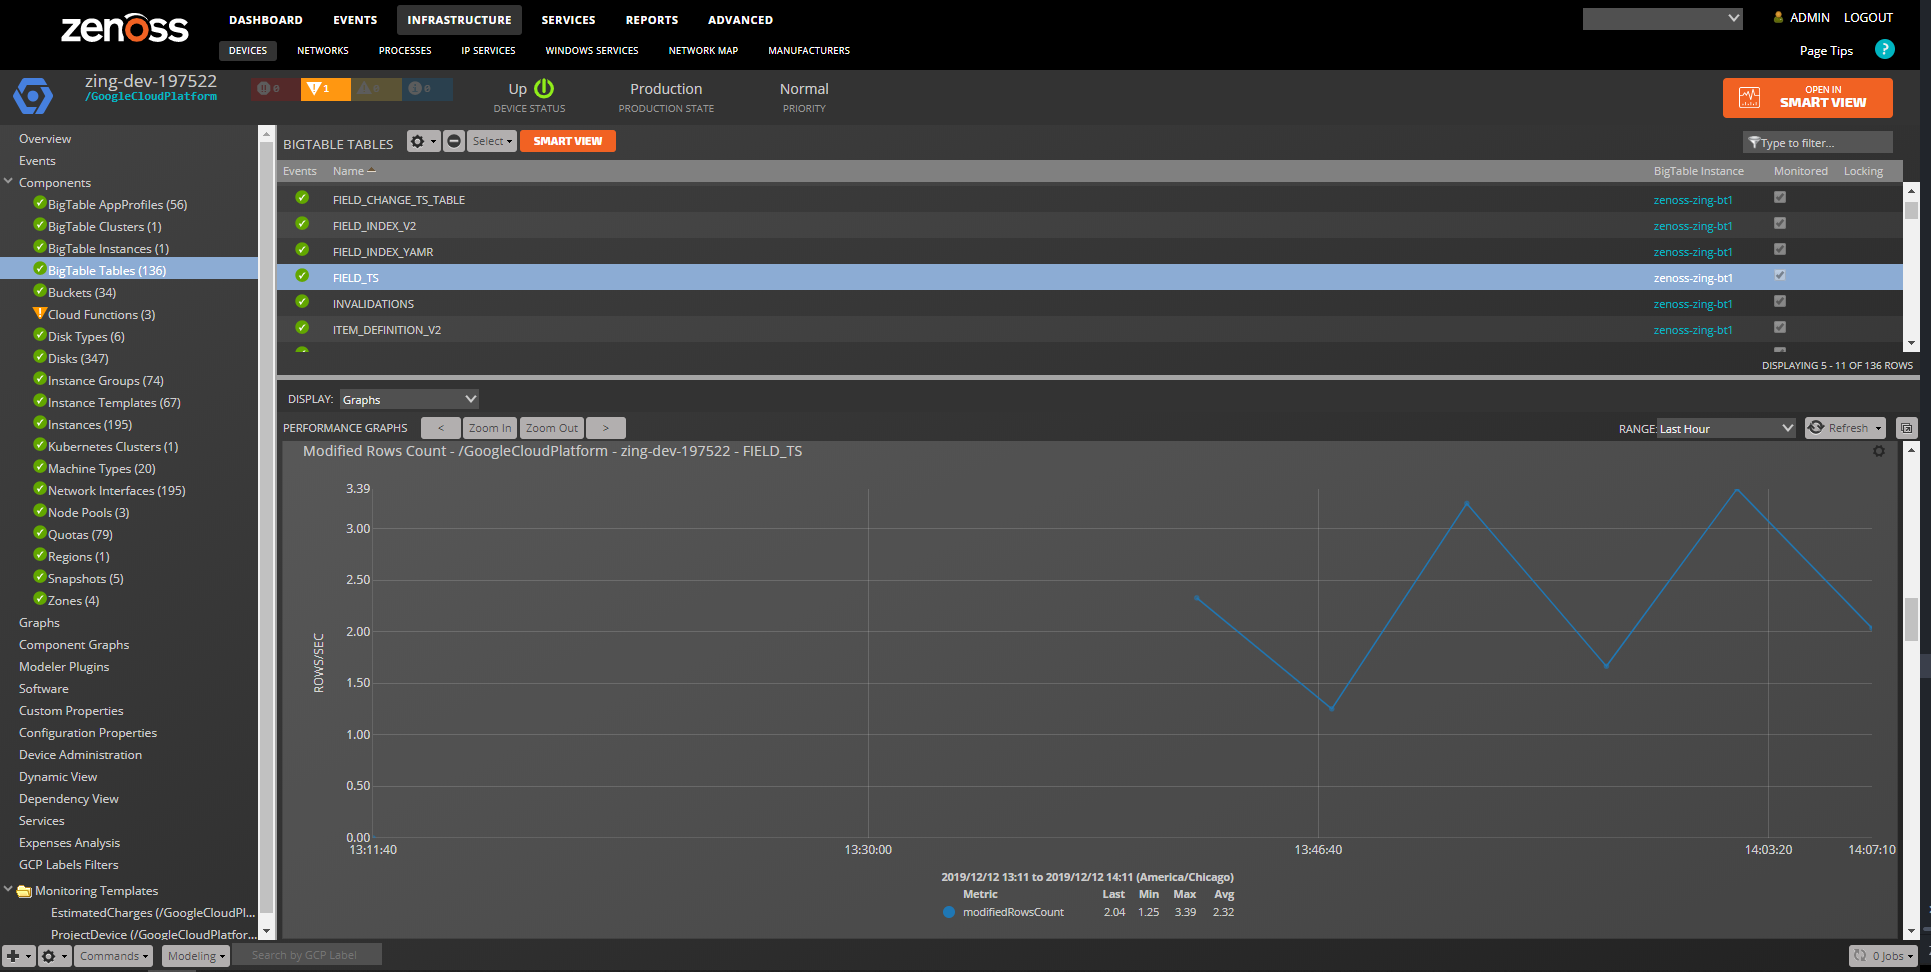
BigTable Tables
Properties: Full Name Relationships : BigTable Instance
Status Monitoring
Many of the discovered resources have a status available via the Google Cloud Platform APIs. All of these are monitored by default by this ZenPack.
In addition to the per-resource-type status values listed below, each of these resource types can also have one of the following non-API status values.
- PENDING: Zenoss has not yet (or recently) collected status for the resource.
- MISSING: Resource no longer exists in Google Cloud, and will likely be removed the next time modeling occurs.
- UNKNOWN: An unexpected status value not known to exist for the resource type.
Regions: Status: DOWN, UP: Event: DOWN, MISSING
Zones: Status: DOWN, UP: Event:: DOWN, MISSING
Images: Status: FAILED, PENDING, READY: Event: FAILED
Snapshots: Status: CREATING, DELETING, FAILED, READY, UPLOADING: Storage Status: UNKNOWN, UP_TO_DATE, UPDATING: Event: FAILED
Instances: Status: PROVISIONING, STAGING, RUNNING, STOPPED, SUSPENDING, SUSPENDED, TERMINATED
Kubernetes Clusters: Status: STATUS_UNSPECIFIED, PROVISIONING, RUNNING, RECONCILING, STOPPING, ERROR, DEGRADED: Event: ERROR, DEGRADED
Kubernetes Node Pools: Status: STATUS_UNSPECIFIED, PROVISIONING, RUNNING, RUNNING_WITH_ERROR, RECONCILING, STOPPING, ERROR: Event: RUNNING_WITH_ERROR, DEGRADED
Cloud Functions
Status : CLOUD_FUNCTION_STATUS_UNSPECIFIED, ACTIVE, OFFLINE, DEPLOY_IN_PROGRESS, DELETE_IN_PROGRESS, Event : CLOUD_FUNCTION_STATUS_UNSPECIFIED, OFFLINE, DEPLOY_IN_PROGRESS, DELETE_IN_PROGRESS, UNKNOWN
BigTable Instances
Status : PENDING, MISSING, STATE_NOT_KNOWN, READY, CREATING, RESIZING, DISABLED Event : STATE_NOT_KNOWN
BigTable Clusters
Status : PENDING, MISSING, STATE_NOT_KNOWN, READY, CREATING Event : STATE_NOT_KNOWN, DISABLED
Performance Monitoring
Performance (metric) monitoring is done via the Stackdriver Monitoring API. The following metrics are monitored by default.
Project
- BigQuery Execution Time
- BigQueryExecutionTime: bigquery.googleapis.com/query/execution_times
- BigQuery Scanned Bytes Billed
- BigQueryScannedBytesBilled: bigquery.googleapis.com/query/statement_scanned_bytes_billed
- BiqQuery Scanned Bytes
- BigQueryScannedBytes: bigquery.googleapis.com/query/scanned_bytes
Slot Metrics Known Issues
Since Slot metrics in StackDriver are inconsistent, they are not collected by Zenoss. This is documented as 'Known Issues' in the following reference: https://cloud.google.com/bigquery/docs/monitoring
Instances
- CPU Utilization
- Average: compute.googleapis.com/instance/cpu/utilization
- Total Disk Throughput
- Read: compute.googleapis.com/instance/disk/read_bytes_count
- Write: compute.googleapis.com/instance/disk/write_bytes_count
- Throttled Disk Throughput
- Read: compute.googleapis.com/instance/disk/throttled_read_bytes_count
- Write: compute.googleapis.com/instance/disk/throttled_write_bytes_count
- Total Disk Operation Rate
- Read: compute.googleapis.com/instance/disk/read_ops_count
- Write: compute.googleapis.com/instance/disk/write_ops_count
- Throttled Disk Operation Rate
- Read: compute.googleapis.com/instance/disk/throttled_read_ops_count
- Write: compute.googleapis.com/instance/disk/throttled_write_bytes_count
- Total Network Throughput
- Received: compute.googleapis.com/instance/network/received_bytes_count
- Sent: compute.googleapis.com/instance/network/sent_bytes_count
- Total Network Packet Rate
- Received: compute.googleapis.com/instance/network/received_packets_count
- Sent: compute.googleapis.com/instance/network/sent_packets_count
- Firewall Throughput
- Dropped: compute.googleapis.com/firewall/dropped_bytes_count
- Firewall Packet Rate
- Dropped: compute.googleapis.com/firewall/dropped_packets_count
- Container CPU Usage (Kubernetes Nodes Only)
- CPU Usage: container.googleapis.com/container/cpu/usage_time
- Container Memory (Kubernetes Nodes Only)
- Total: container.googleapis.com/container/memory/bytes_total
- Used: container.googleapis.com/container/memory/bytes_used
- Container Memory Faults (Kubernetes Nodes Only)
- Major: container.googleapis.com/container/memory/page_fault_count
- Minor: container.googleapis.com/container/memory/page_fault_count
Disks
- Disk Throughput
- Read: compute.googleapis.com/instance/disk/read_bytes_count
- Write: compute.googleapis.com/instance/disk/write_bytes_count
- Throttled Disk Throughput
- Read: compute.googleapis.com/instance/disk/throttled_read_bytes_count
- Write: compute.googleapis.com/instance/disk/throttled_write_bytes_count
- Disk Operation Rate
- Read: compute.googleapis.com/instance/disk/read_ops_count
- Write: compute.googleapis.com/instance/disk/write_ops_count
- Throttled Disk Operation Rate
- Read: compute.googleapis.com/instance/disk/throttled_read_ops_count
- Write: compute.googleapis.com/instance/disk/throttled_write_bytes_count
Functions
- Invocations:
cloudfunctions.googleapis.com/function/execution_count
- Total
- Ok
- Timeout
- Error
- Execution Times
- Active Instances
- Memory Use
- Network Egress
Dataflow Jobs
- Memory Use:
dataflow.googleapis.com/job/total_memory_usage_time
- MemoryUsageTime (byte-seconds)
- Disk Usage:
dataflow.googleapis.com/job/total_pd_usage_time
- DiskUsageTime (byte-seconds):
- CPU Usage:
dataflow.googleapis.com/job/total_vcpu_time
- Total: (seconds)
- Elements:
dataflow.googleapis.com/job/element_count
- ElementCount
- System Lag:
dataflow.googleapis.com/job/system_lag
- SystemLag: (seconds)
BigQuery Datasets
- Stored Bytes
- storedBytes: bigquery.googleapis.com/storage/stored_bytes
- Tables
- tables: bigquery.googleapis.com/storage/table_count
- Uploaded Rows
- uploadedRows: bigquery.googleapis.com/storage/uploaded_row_count
Storage Buckets
- Total Bytes
- totalBytes: storage.googleapis.com/storage/total_bytes
- Object Count
- objectCount: storage.googleapis.com/storage/object_count
- Received Bytes Count
- receivedBytesCount: storage.googleapis.com/network/received_bytes_count
- Sent Bytes Count
- sentBytesCount: storage.googleapis.com/network/sent_bytes_count
- Last Updated
- thirtyDays: objects updated 30 to 60 days ago
- sixtyDays: objects updated 60 days ago
BigTable Instances
- Cpu Load:
- btiCpuLoad: bigtable.googleapis.com/cluster/cpu_load
- Cpu Load Hottest Node:
- btiCpuLoadHottestNode: bigtable.googleapis.com/cluster/cpu_load_hottest_node
- Node Count:
- btiNodeCount: bigtable.googleapis.com/cluster/node_count
- Disk Load:
- btiDiskLoad: bigtable.googleapis.com/cluster/disk_load
- Storage Utilization:
- btiStorageUtilization: bigtable.googleapis.com/cluster/storage_utilization
- Disk Bytes Used:
- btiDiskBytesUsed: bigtable.googleapis.com/disk/bytes_used
- Storage Capacity:
- btiStorageCapacity: bigtable.googleapis.com/disk/storage_capacity
CPU utilization
Google Recommended thresholds: 70% for instances with 1 cluster or multiple clusters and single-cluster routing; 35% for instances with 2 clusters and multi-cluster routing. For instances with more than 2 clusters and multi-cluster routing, see google's threshold guidance.
CPU utilization (hottest node)
Google Recommended thresholds: 90% for instances with 1 cluster or multiple clusters and single-cluster routing; 45% for instances with 2 clusters and multi-cluster routing. For instances with more than 2 clusters and multi-cluster routing, see google's threshold guidance.
BigTable Clusters
- Cpu Load:
- btiCpuLoad: bigtable.googleapis.com/cluster/cpu_load
- Cpu Load Hottest Node:
- btiCpuLoadHottestNode: bigtable.googleapis.com/cluster/cpu_load_hottest_node
- Node Count:
- btiNodeCount: bigtable.googleapis.com/cluster/node_count
- Disk Load:
- btiDiskLoad: bigtable.googleapis.com/cluster/disk_load
- Storage Utilization:
- btiStorageUtilization: bigtable.googleapis.com/cluster/storage_utilization
- Disk Bytes Used:
- btiDiskBytesUsed: bigtable.googleapis.com/disk/bytes_used
- Storage Capacity:
- btiStorageCapacity: bigtable.googleapis.com/disk/storage_capacity
BigTable Tables
- Replication Max Delay:
- bttReplicationMaxDelay: bigtable.googleapis.com/replication/max_delay
- Replication Latency
- bttReplicationLatency: bigtable.googleapis.com/replication/latency
- Error Count:
- bttErrorCount: bigtable.googleapis.com/server/error_count
- Modified Rows Count:
- bttModifiedRowsCount: bigtable.googleapis.com/server/modified_rows_count
- Server Latencies:
- bttServerLatencies: bigtable.googleapis.com/server/latencies
- Received Bytes Count:
- bttReceivedBytesCount: bigtable.googleapis.com/server/received_bytes_count
- Request Count:
- bttRequestCount: bigtable.googleapis.com/server/request_count
- Returned Rows Count:
- bttReturnedRowsCount: bigtable.googleapis.com/server/returned_rows_count
- Sent Bytes Count:
- bttSentBytesCount: bigtable.googleapis.com/server/sent_bytes_count
- Table Bytes Used:
- bttTableBytesUsed: bigtable.googleapis.com/table/bytes_used
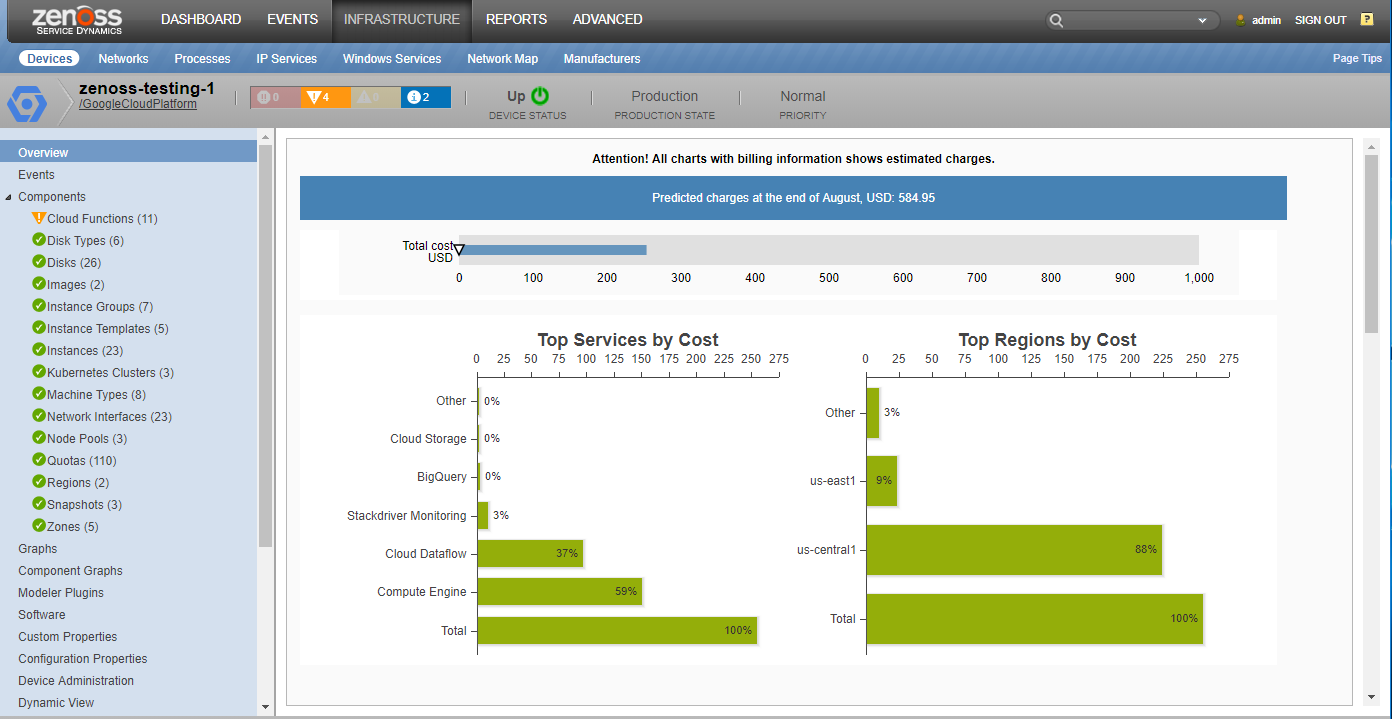
Billing Monitoring
This Zenpack also supports monitoring of Google Cloud Services for a project. Costs can be separated by region, services and labels. Overview graphs and project-level graphs are available after configuration. All regions and services are not monitored by default. New datasources may need to be created for desired services and regions.Billing monitoring requires some usage of BigQuery so additional Google Cloud Services costs will be present.
Billing Monitoring Configuration
- Enable Exporting Billing Data to BigQuery
- Give the service account JobUser and DataViewer permissions to BigQuery for the billing project.
- On the Zenoss side you will need to configure two zProperties, zGoogleCloudPlatformBillingTableId and zGoogleCloudPlatformBillingProjectId to start collecting data.
- You may also want to configure zGoogleCloudPlatformBillingCostThreshold to setup alerts and events for billing costs.
Label Filters
The ZenPack now provides a way to group and collect Google Cloud Services components on an project based on GCP Labels.
By creating a label filter will allow you to view all components of any type matched by the filter, along with their graphs.
In addition, you can use this Label Filter to view estimated billing information for the group of labels in the Expenses Analysis section. The GCP Label Filters use a special monitoring template, LabelFilter, which is not visible in the device-level monitoring template section,
but is visible if you go to Advanced > Monitoring Templates.From here, you can add modify the template, should you need to do so
Adding Label Filters
- You can define a label filter by navigating to your project device and by using the + menu in the lower left part of the screen select "Add GCP Label Filter" .
- Using the dialog menu, give your Label Filter a name, and select the label you want to track. You can combine multiple tags with the AND and OR operators.
- You can also generate a Component Group based on the Label Filter.
- Click Submit when finished. The Label Filter will be visible in the the navigation bar, and the "GCP Label Filters" section.
Incremental Instance Monitoring
Compute instances can be incrementally model on the same interval as zGoogleCloudPlatformStackDriverMonitoringInterval.
Ensure your service account has permissions to retrieve and access logging information. Incremental modeling will add, delete and update
compute instances. Incremental only supports partial modeling and will not retrieve all information. Any information missing will be added on next
full model. Guest Devices will also be created just like normal modeling if configured.
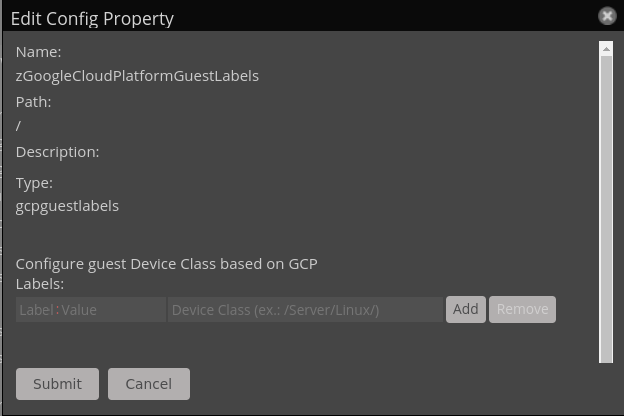
Guest Device Discovery
Guest devices are devices that are created based on instance components that GCP discovers. This facility is mean to simplify creation of Linux/Windows/Other guests that GCP creates. In order for guest devices to be properly created you need to provide two pieces of information:
-
Set the zGoogleCloudPlatformDiscoverGuests property to True in the GCP device Configuration Properties.
-
From the Configuration Properties, and open the zGoogleCloudPlatformGuestLabels dialog (at right):
-
From here you will see two text boxes. The first box is a Label:Value expression. It must be in the form of two simple regular expressions separated by a colon. The following are all valid:
- label1:value1
- label1.*:value2.*
- label.*one:value.*two
-
The second text box is the Device Class field, which must be filled with a valid path to an existing device class. For example:
- /Server/SSH/Linux
- /Server/Microsoft/Windows
-
If the dialog detects any mis-formatted entries it will reject attempts to add that Label-DeviceClass entry.
-
You can have multiple entries to allow for a broader set of services but only the first match will apply to a given instance, so ensure your order is correct before starting.
-
Once your zGoogleCloudPlatformGuestLabels entries are set, you need to remodel your GCP device.
-
If all is correct, Instances whose GCP labels match one in zGoogleCloudPlatformGuestLabels will be scheduled to be created with the associated device class.
-
When an instance component is removed from GCP, the associated guest device will automatically be removed.
-
Manual deletion of guest devices is permanent until next modeling cycle occurs.
NOTE: The GCP ZenPack makes no attempt to ensure credentials are set on guest devices. The default values should be set appropriately.
zGoogleCloudPlatformResetGuestCollector and zGoogleCloudPlatformAutoChangeProdState must be set on GCP device for guest device management.
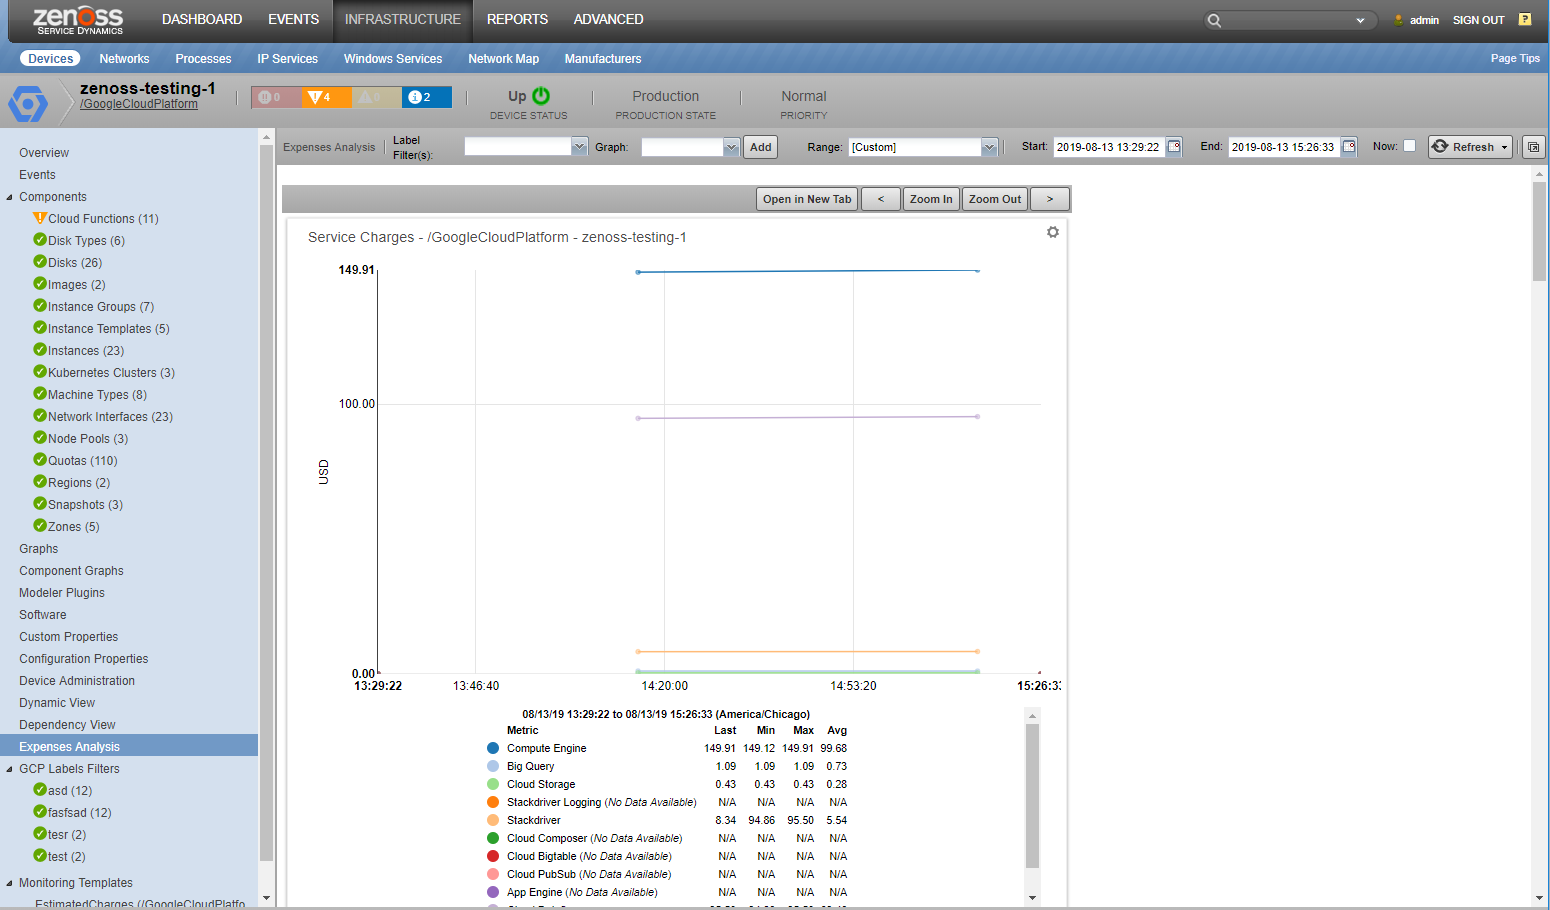
Expense Analysis
You can track Google Cloud Services estimated usage charges for a project, given label or label group, and grouped by specific services or regions.
In order to set this up, you must create a Label Filter to match the label or label in which you are interested in and then you must configure
exporting billing data to BigQuery as mentioned earlier.
Dynamic View
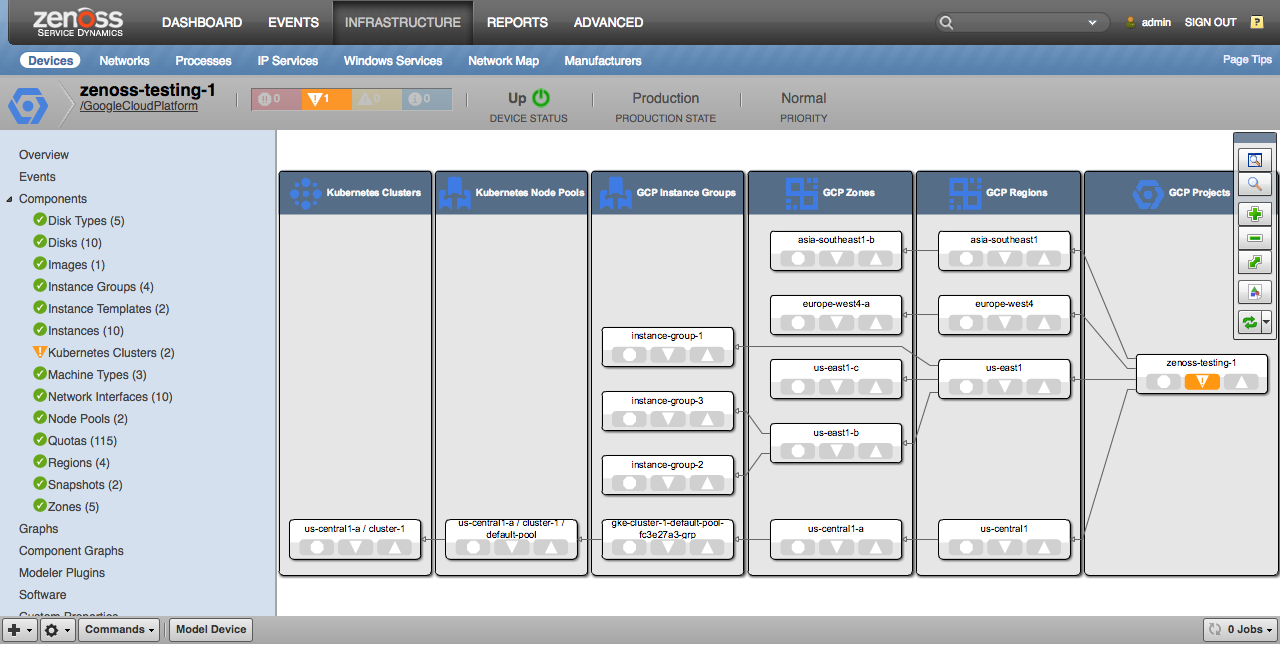
Dynamic View support is enabled for projects, and all resources that have an impactful relationship to other resources. See the Service Impact and Root Cause Analysis section for more detail on what the specific impact relationships are.
The project-level Dynamic View shows a high-level logical overview of the discovered project's resources instead of the typical (what impacts the project) view because nothing would typically impact the project as a whole.
Service Impact and Root Cause Analysis

When combined with the Zenoss Service Dynamics product, this ZenPack adds built-in service impact and root cause analysis capabilities for services running on Google Cloud. The service impact relationships described below are automatically added. These will be included in any services that contain one or more of the explicitly mentioned components.
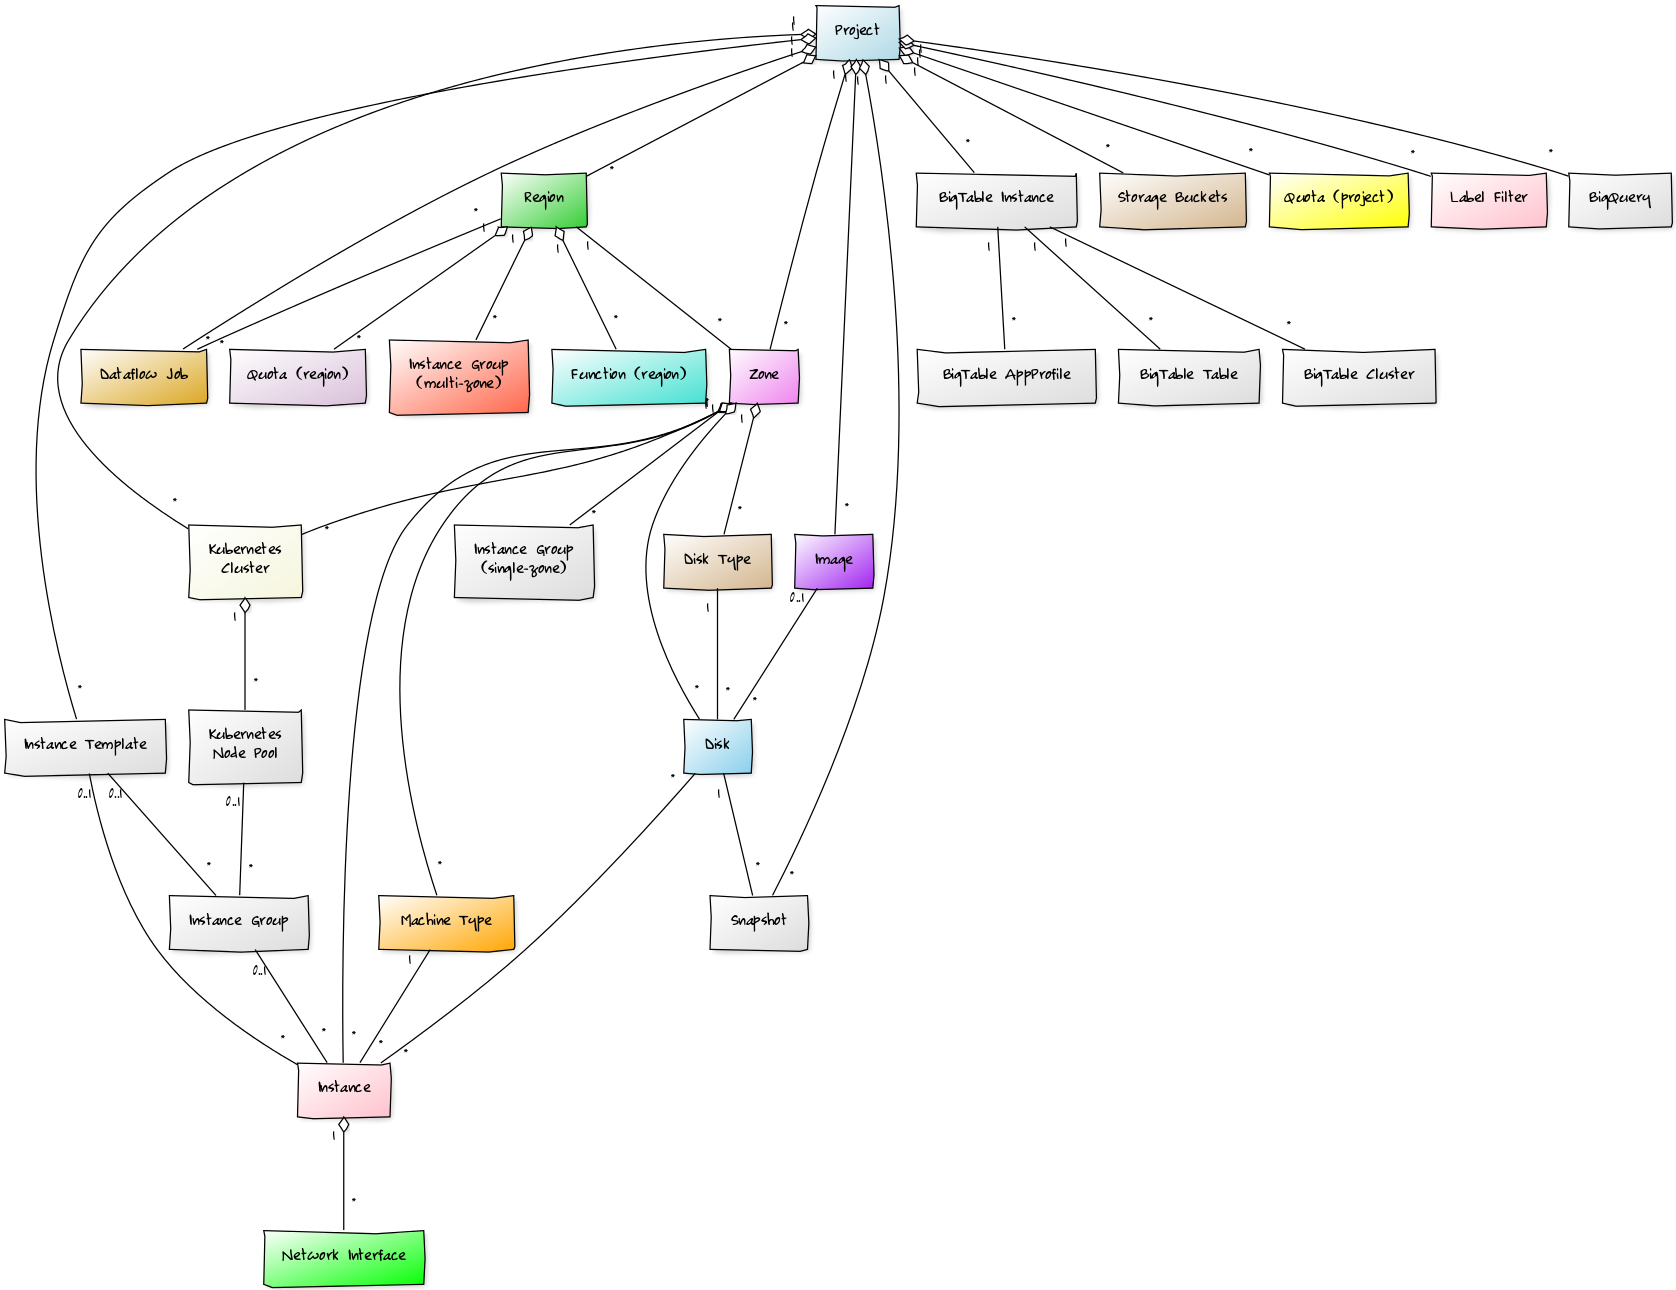
Impact Diagram
Impact Relationships
Kubernetes node pools impact their Kubernetes Cluster.
Kubernetes clusters impact their associated Kubernetes ZenPack Clusters.
Instance groups impact any associated Kubernetes Node Pool.
Instances impact their associated Guest OS Devices.
Instances impact their associated Kubernetes ZenPack nodes.
Instances impact any Instance Group to which they belong.
Network Interfaces impact their Instance.
Disks impact any Instance to which they're attached.
Zones impact any contained Instances.
Regions impact all Zones in the Region and Functions.
Projects impact all Regions, Dataflows and BigQuery Datasets.
Usage
Creating a Service Account
Adding a Google Cloud Platform Project to Zenoss requires a service account with the Project View role. This role allows Zenoss to view all resource information within the project, but not make any changes.
Use the following steps to setup a service account.
Open the Google Cloud Console.
Choose the project you want to monitor.
Navigate to the IAM & admin service.
Navigate to Service accounts.
Click Create Service Account.
Enter a name for the account.
Choose the Project / Viewer role.
Select Furnish a new private key.
Select the JSON key type.
Save the JSON document:
Be sure to save the downloaded JSON file to a safe place. Open this JSON file in any text editor. You'll be needing the full values from the project_id, client_email, and private_key keys to add the project to Zenoss
Restricted Access
If the monitoring user has restricted access to any part of GCP API, full modeling and monitoring will be restricted!
You must provided specialized Viewer access for each component that needs to be monitored. We recommend using the Viewer role at the project level as we outline above.
Adding a Project
Use the following steps to add a Google Cloud Platform project to Zenoss.

Navigate to the Infrastructure page.
Click the Add Devices menu button above the devices grid.
Choose the Add Google Cloud Project... menu option.
Complete the form..
- Device Name: Any valid Zenoss device name.
- Project ID: project_id from the service account's JSON file.
- Client Email Address: client_email from the service account's JSON file.
- Private Key: private_key from the service account's JSON file.
- Guest Devices Use External IP: Select this if you plan to monitor the operating systems running on instances via their NAT IP addresses. Deselect it if you will monitor them via their internal Google IP addresses.
- Collector: The Zenoss collector responsible for monitoring the project.
Click Add.
Alternatively you can use zenbatchload to add projects from the command line. To do this, you must create a file with contents similar to the following. Replace all values in angle brackets with your values minus the brackets. Multiple projects can be added under the same /Devices/GoogleCloudPlatform section.
/Devices/GoogleCloudPlatform
my-project-3 \
    zGoogleCloudPlatformProjectId='<project_id>', \
    zGoogleCloudPlatformClientEmail='<client_email>', \
    zGoogleCloudPlatformPrivateKey='<private_key>'
You can then load the endpoint(s) with the following command.
zenbatchload <filename>
Installed Items
This ZenPack installs the following items into the Zenoss system.
Configuration Properties
zGoogleCloudPlatformActivityLogInterval: Polling interval (in seconds) for activity logs. Default 300.
zGoogleCloudPlatformActivityLogSubscriptionName: Subscription name that will be used to pull activity logs. Default none.
zGoogleCloudPlatformBigQueryDatasetsModeled: List of regular expression to match BigQuery Datasets for modeling. Default none.
zGoogleCloudPlatformBillingCostThreshold: GCP Project Billing Cost Threshold for events and alerts in dollars. Default 1000.
zGoogleCloudPlatformBillingProjectId: Project Id of billing data table. Default none.
zGoogleCloudPlatformBillingTableId: BigQuery Table Id to use for retrieving billing data. Default none.
zGoogleCloudPlatformClientEmail: Client email address to use for monitoring. Default None. Required.
zGoogleCloudPlatformComputeMaxResults: Maximum number of results per page for Compute Engine API requests.Default 500.
zGoogleCloudPlatformDataflowJobNamesModeled: List of regular expression to match Dataflow Jobs for modeling. Default none.
zGoogleCloudPlatformFunctionWhitelist: Regular Expression patterns to specify Cloud Function modeling. Default all: [".*"].
zGoogleCloudPlatformGuestUseExternalIP: Use external (NAT) IP for creating and linking guest devices. Default true.
zGoogleCloudPlatformDiscoverGuests: Enable auto-discovery of GCP instance guest devices. Default false.
zGoogleCloudPlatformGuestLabels: Label to DeviceClass association for GCP instance guest devices. Default none.
zGoogleCloudPlatformResetGuestCollector: Allow the guest discovery process to reset guest device collectors during update with GCP Project's collector. Default false.
zGoogleCloudPlatformAutoChangeProdState: Automatically change production states for guests when instance state changes. Default false.
zGoogleCloudPlatformMonitoringPageSize: Maximum number of points per page for Monitoring API requests. Default 100,000
zGoogleCloudPlatformPrivateKey: Private key to use for monitoring. Default none: Required.
zGoogleCloudPlatformProjectId: Project ID to monitor. Default none: Required.
zGoogleCloudPlatformQuotaInterval : Polling interval (in seconds) for quota datasources. Default 300.
zGoogleCloudPlatformStackDriverMonitoringInterval: Polling interval (in seconds) for Stackdriver Monitoring datasources. Minimum 240, Default 300.
zGoogleCloudPlatformStatusInterval: Polling interval (in seconds) for status datasources. Default 300.
zGoogleCloudPlatformBigTableInstancesModeled: Regular Expression patterns to specify BigTable Instance. Default none: [] Required to model BigTable components .
zGoogleCloudPlatformBigTableClustersModeled: Regular Expression patterns to specify BigTable Cluster modeling. Default none: []
zGoogleCloudPlatformBigTableAppProfilesModeled: Regular Expression patterns to specify BigTable AppProfile modeling. Default none: []
zGoogleCloudPlatformBigTableTablesModeled: Regular Expression patterns to specify BigTable Table modeling. Default none: []
Device Classes
/GoogleCloudPlatform: All Google Cloud Platform projects are added to this device class.
Modeler Plugins
GoogleCloudPlatform.Project: Models all components for a Google Cloud Platform project.
Datasource Types
Google Cloud Platform Activity Log Monitoring
Google Cloud Platform Billing Monitoring
Google Cloud Platform Instance Group Monitoring
Google Cloud Platform Quota
Google Cloud Platform Stackdriver Monitoring
Google Cloud Platform Status
Google Cloud Platform Storage Bucket Monitoring
Google Cloud Platform Instance Audit Log Monitoring
Monitoring Templates
/GoogleCloudPlatform
- ProjectDevice
- BigQuery
- CloudFunction
- ComputeRegion
- ComputeImage
- ComputeDisk
- ComputeInstance
- ComputeInstanceGroup
- ComputeSnapshot
- ComputeZone
- Dataflow
- EstimatedCharged
- KubernetesNode
- KubernetesCluster
- KubernetesNodePool
- LabelFilters
- StorageBuckets
- BigTableInstance
- BigTableCluster
- BigTableTable
Event Classes
/GoolgleCloudPlatform
Event Class Mappings
/Status
- gcp-status-api
- gcp-status-region
- gcp-status-image
- gcp-status-snapshot
- gcp-status-snapshot-storage
- gcp-status-zone
- gcp-status-instance
- gcp-status-kubernetes-cluster
- gcp-status-kubernetes-nodePool
- gcp-status-function: {}
- gcp-status-bigtable-instance: {}
- gcp-status-bigtable-cluster: {}
StackDriver Monitoring
StackDriver Monitoring Configuration
Stackdriver datasources can be customized to various services and metrics. To add a new datasource:
First select a component type and select the Template drop-down.
Click on the + and provide a datasource name and select Stackdriver type.
Edit that datasource
Choose the appropriate API Service.
Then choose the Metric Type from the pulldown.
Choose the Cross-Series Reducer (optional)
Choose the Per-Series Aligner (optional)
Enter a Filter (optional) if required
Choose Aggregation Function under Post Processing
Save
Testing the StackDriver Datasource
You can test the datasource you created (or modified) above by going into the datasource configuration and scroll down to the Test Against a Device area:
Choose a valid GCP device name
Hit the Test button
If all goes well you should see information on:
- Requested Parameters
- Metrics
- Datapoints
If you get an error during the test, you can check:
- GCP permissions if indicated
- Compatibility with the metrics, aligners, and reducers in the datasource
Adding Data Points to the StackDriver Datasource
Once you have tested your datasource as above you can add data points as indicated in the Testing section above.
Stackdriver Filters
Stackdriver filters allow you to narrow your search by various parameters. Filters are optional. You will find the filters Format for the filters are: key = value. Some examples of filters are:
metric.type = "compute.googleapis.com/instance/cpu/usage_time"
metric.labels.instance_name = "my-instance-name"
project_id = "zenoss-proto-1" and function_name = "HelloDolly"
Notes for Filters:
You don't need to put in a metric.type filter: That is done automatically.
You can have multiple filters joined by "and" as in the 3rd example above.
Stackdriver Reducers
Stackdriver Reducers or Cross-Series Reducers are used to aggregate data according to different algorithms. This is the approach to be used to combine time series. Not all reducer functions may be applied to all time series, depending on the metric type and the value type of the original time series. See https://googleapis.github.io/google-cloud-python/latest/monitoring/gapic/v3/types.html for specific details. In general you should note:
Not all reducer functions may be applied to all time series
You can use the Test button in the datasource UI to validate your reducer
When I doubt, you should go to the Metrics Explorers at Google to validate your reducers and filters at:
Limitations and Known Issues
This ZenPack has the following known limitations and issues:
Adding Project
-
Adding using the Add Multiple Devices or Add Multiple Devices requires that an IP address or resolvable name be entered for the device. Google Cloud Platform projects don't have an IP or resolvable name, so something arbitrary such as cloud.google.com must be used. It is recommended that the Add Google Cloud Project menu item be used to add projects instead because it doesn't require a resolvable name be entered
-
Dialogue option may not appear in Firefox Browser.
Upgrades to 1.1.0 and Missing Components
Expenses Analysis and GCP Labels Filters may be missing in Zenoss UI after upgrading from an older version of the zenpack. If this issue is encountered, restart the zproxy service (by restarting) top-level "Zenoss.resmgr" application in Control Center. It is not necessary to restart the child services.
Model Accuracy
-
Continuous modeling is not currently supported by this ZenPack. This means that the model seen in Zenoss may be up to 12 hours old because it is only updated every 12 hours by default.
-
Monitoring for GCP Functions is inconsistent when datapoint are sparse or singletons. The graphs will show zero for various cloud function graphs.
-
Some datapoint values such as "storage/object_count" and "storage/total_bytes" are only reported by google once a day.
-
Manual Modeling may intermittently fail.
Datasource Timeouts
- Datasources for large projects may timeout Intermittently.
Changes
1.2.1
- Make GoogleCloudPlatform ZenPack compatible with Ubuntu-based CZ 7.2.0 (ZPS-8848)
- Tested with Zenoss Cloud, Zenoss Resource Manager 6.7 and Service Impact 5.6.0
1.2.0
- Add support for BigQuery. (ZPS-6363)
- Add Management of guest device (ZPS-5808)
- Add support of Google Cloud Storage (ZPS-6235)
- Add support for BigTable (ZPS-6332)
- Tested with Zenoss Cloud, Zenoss Resource Manager 6.4.x and Service Impact 5.5.1
1.1.0
- Add support for Dataflow Jobs. (ZPS-5801)
- Add support for Cloud Functions. (ZPS-5719)
- Support "reducer" in Stackdriver Monitoring datasource. (ZPS-5558)
- Support "filter" in Stackdriver Monitoring datasource. (ZPS-5559)
- Support "group by" in Stackdriver Monitoring datasource
- Add support for Instance Group Monitoring (ZPS-3501)
- Add support for Billing Monitoring with services and region analysis (ZPS-5807)
- Support for tags for all components (ZPS-5809)
- Support for Billing reports based on tags and labels (ZPS-6024)
- Tested with Zenoss Cloud, Zenoss Resource Manager 6.3.x, Zenoss Resource Manager 6.4 and Service Impact 5.5.1
1.0.2
- Fixing compatibility with DynamicView 1.8.0 and Impact 5.5. (ZPS-5666)
- Tested with Zenoss Cloud and Zenoss Resource Manager 6.3.x and Service Impact 5.5.1.
1.0.1
- Fix false positives for quotas with a limit of 1 and usage of 0. (ZPS-4567)
- Fix "too many items" error when modeling instances belonging to multiple instance groups. (ZPS-4695)
- Provide links and impacts between GKE components and Kubernetes ZenPack components. (ZPS-4778)
- Prevent false modeling changes when nothing changed in modeled project. (ZPS-5207)
- Tested with Zenoss Resource Manager 6.3.2, Zenoss Cloud, and Service Impact 5.3.4.
1.0.0
- Initial release.
| ZenPack Classification | |
|---|---|
| Commercial | This ZenPack is developed and supported by Zenoss Inc. Commercial ZenPacks are available to Zenoss commercial customers only. Contact Zenoss to request more information regarding this or any other ZenPacks. Click here to view all available Zenoss Commercial ZenPacks. |
| Organization | Zenoss, Inc. |
| Name | ZenPacks.zenoss.GoogleCloudPlatform |
| Applications Monitored | Google's Cloud Platform |