Citrix NetScaler (Commercial)
ZenPacks.zenoss.NetScaler
This ZenPack provides support for monitoring Citrix NetScaler. Monitoring is performed through a NetScaler VPX using SNMP.
The features added by this ZenPack be summarized as follows. They are each detailed further below.
- Initial discovery and continual synchronization of relevant components
- Performance monitoring
- Event management
- Operational reports
Commercial
This ZenPack is developed and supported by Zenoss Inc. Commercial ZenPacks are available to Zenoss commercial customers only. Contact Zenoss to request more information regarding this or any other ZenPacks. Click here to view all available Zenoss Commercial ZenPacks.
Support
This ZenPack is included with commercial versions of Zenoss and enterprise support for this ZenPack is provided to Zenoss customers with an active subscription.
Releases
Version 2.0.0- Download
- Released on 2020/03/23
- Compatible with Zenoss Resource Manager 6.2+, Zenoss Cloud
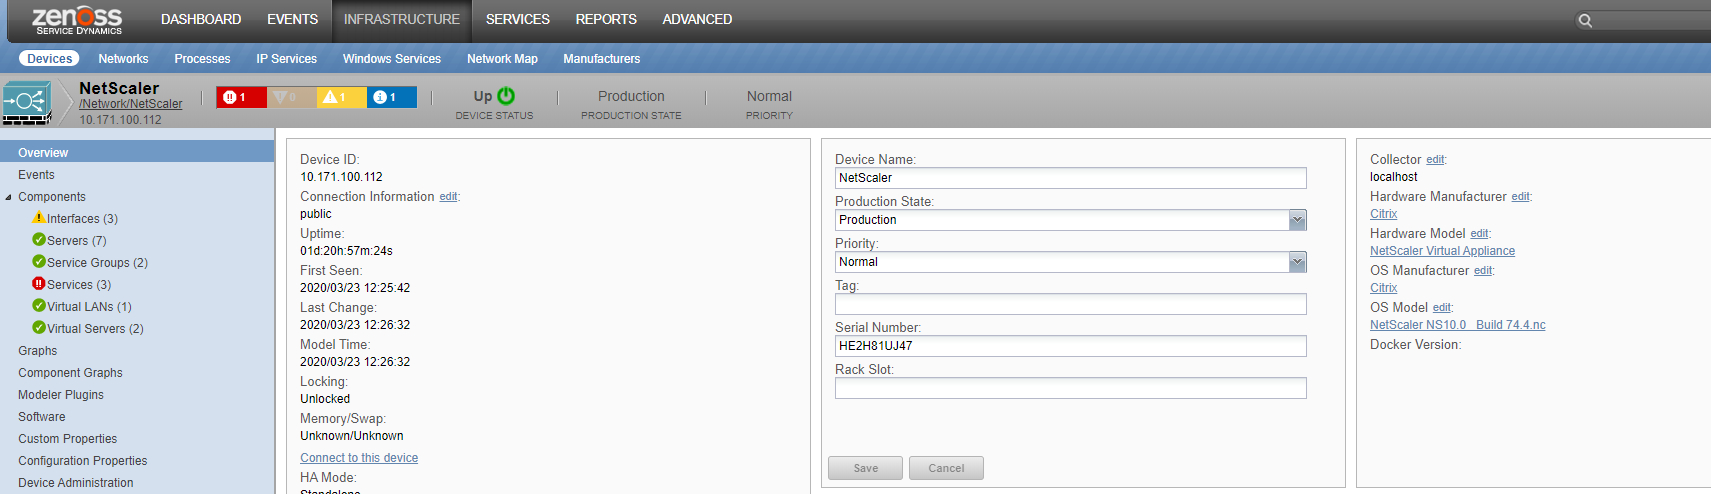
Discovery
The following components will be automatically discovered through the NetScaler address you provide. The properties and relationships will be continually maintained by way of SNMP Walks to the NetScaler device.
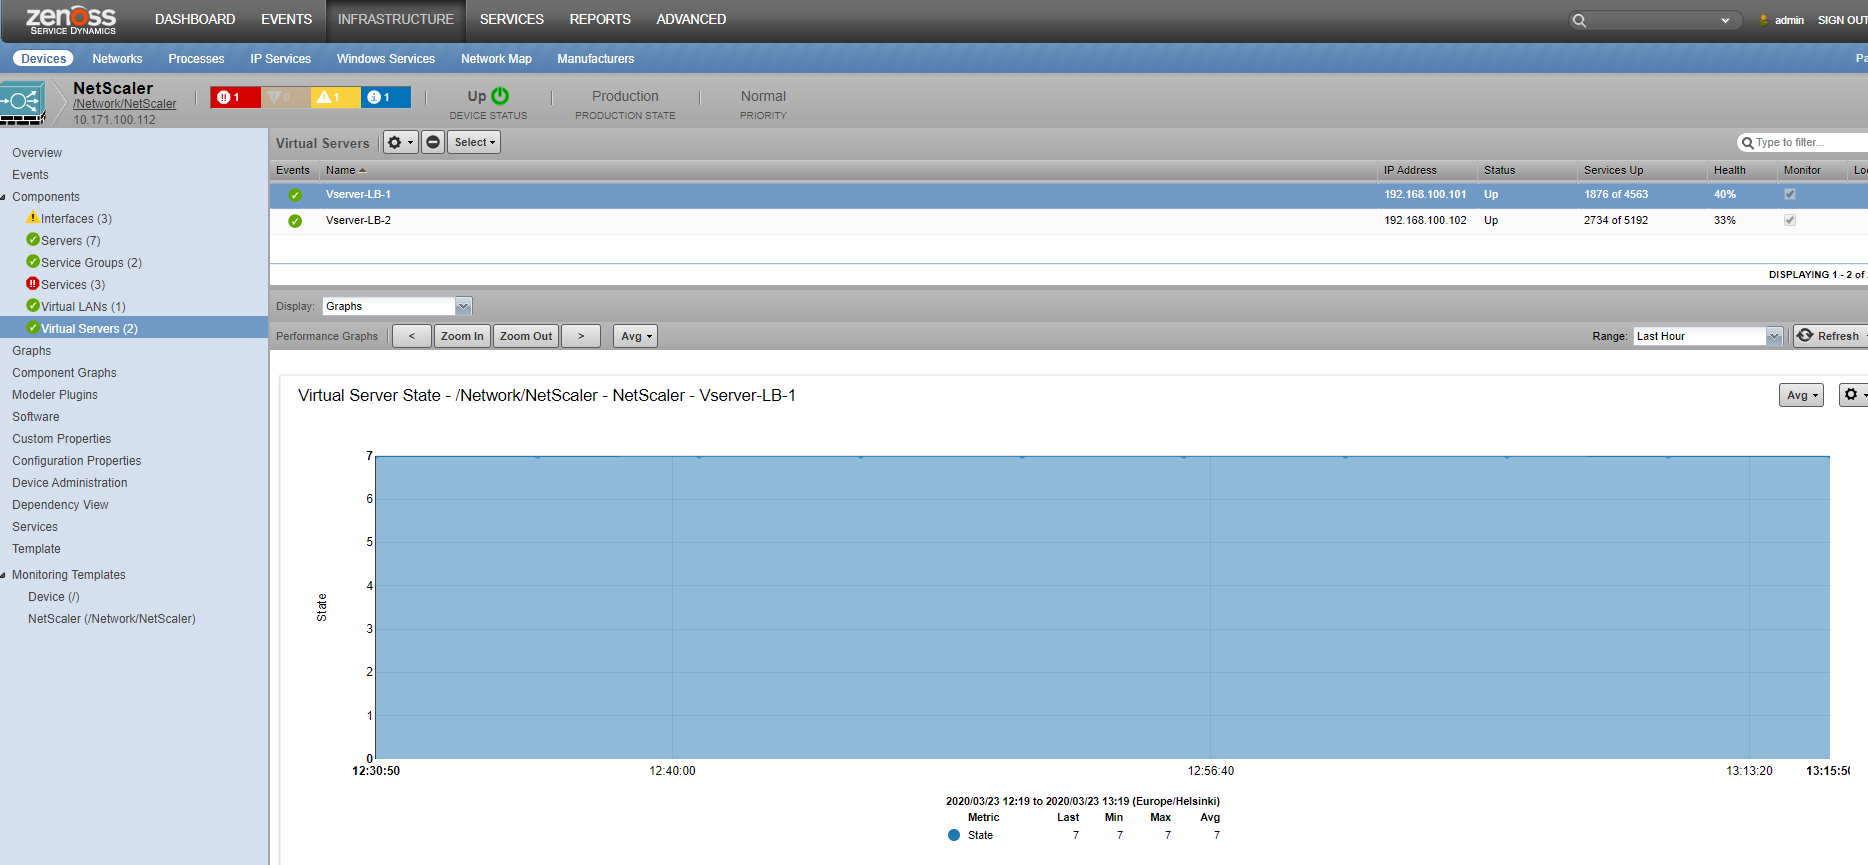
Virtual Servers
- Attributes: IP Address, Status, Health, Services Up
- Relationships: Services, Service Groups
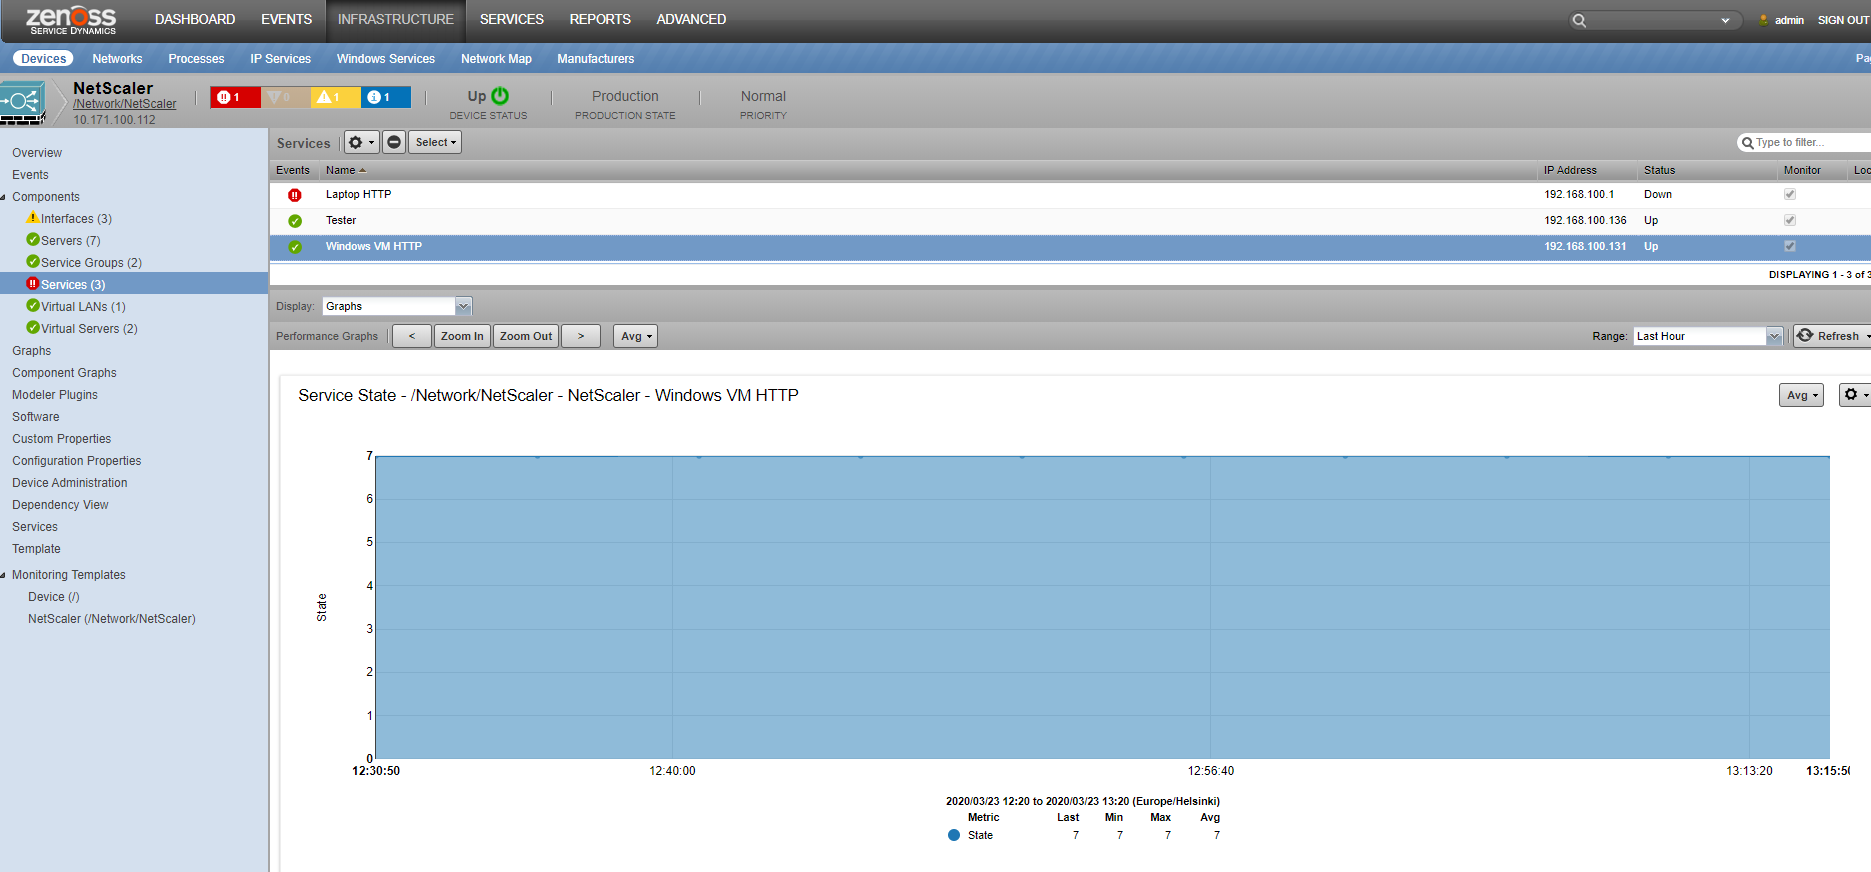
Services
- Attributes: IP Address, Status
- Relationships: Virtual Servers, Servers, Service Groups (optional)
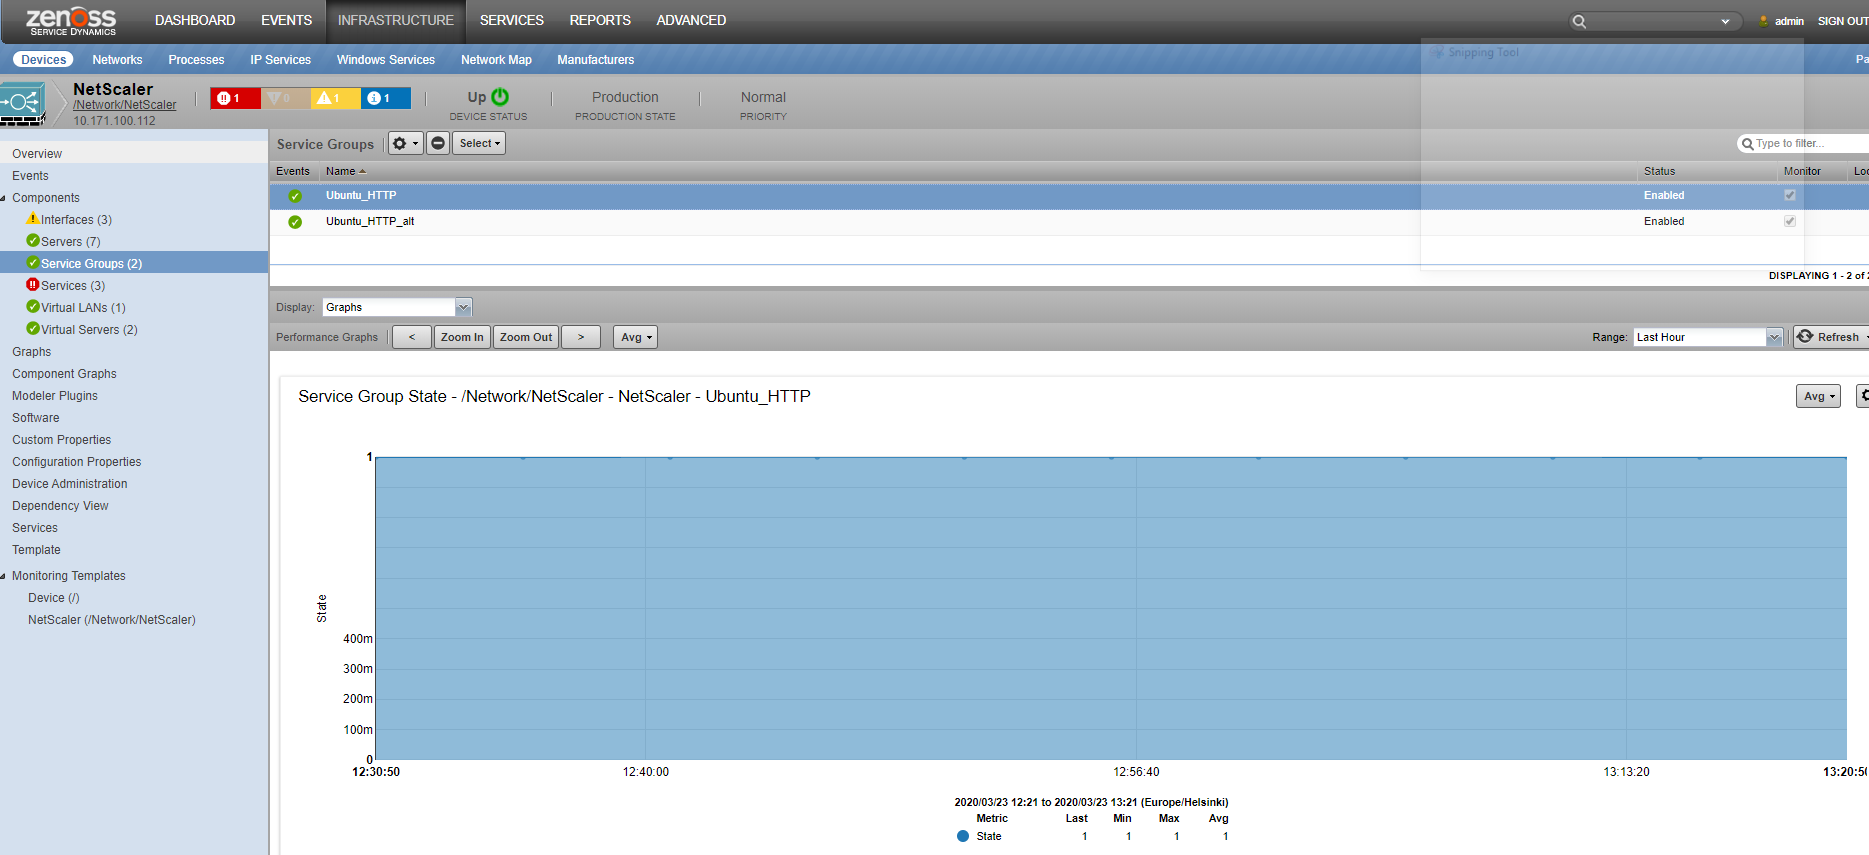
Service Groups
- Attributes: Status
- Relationships: Services
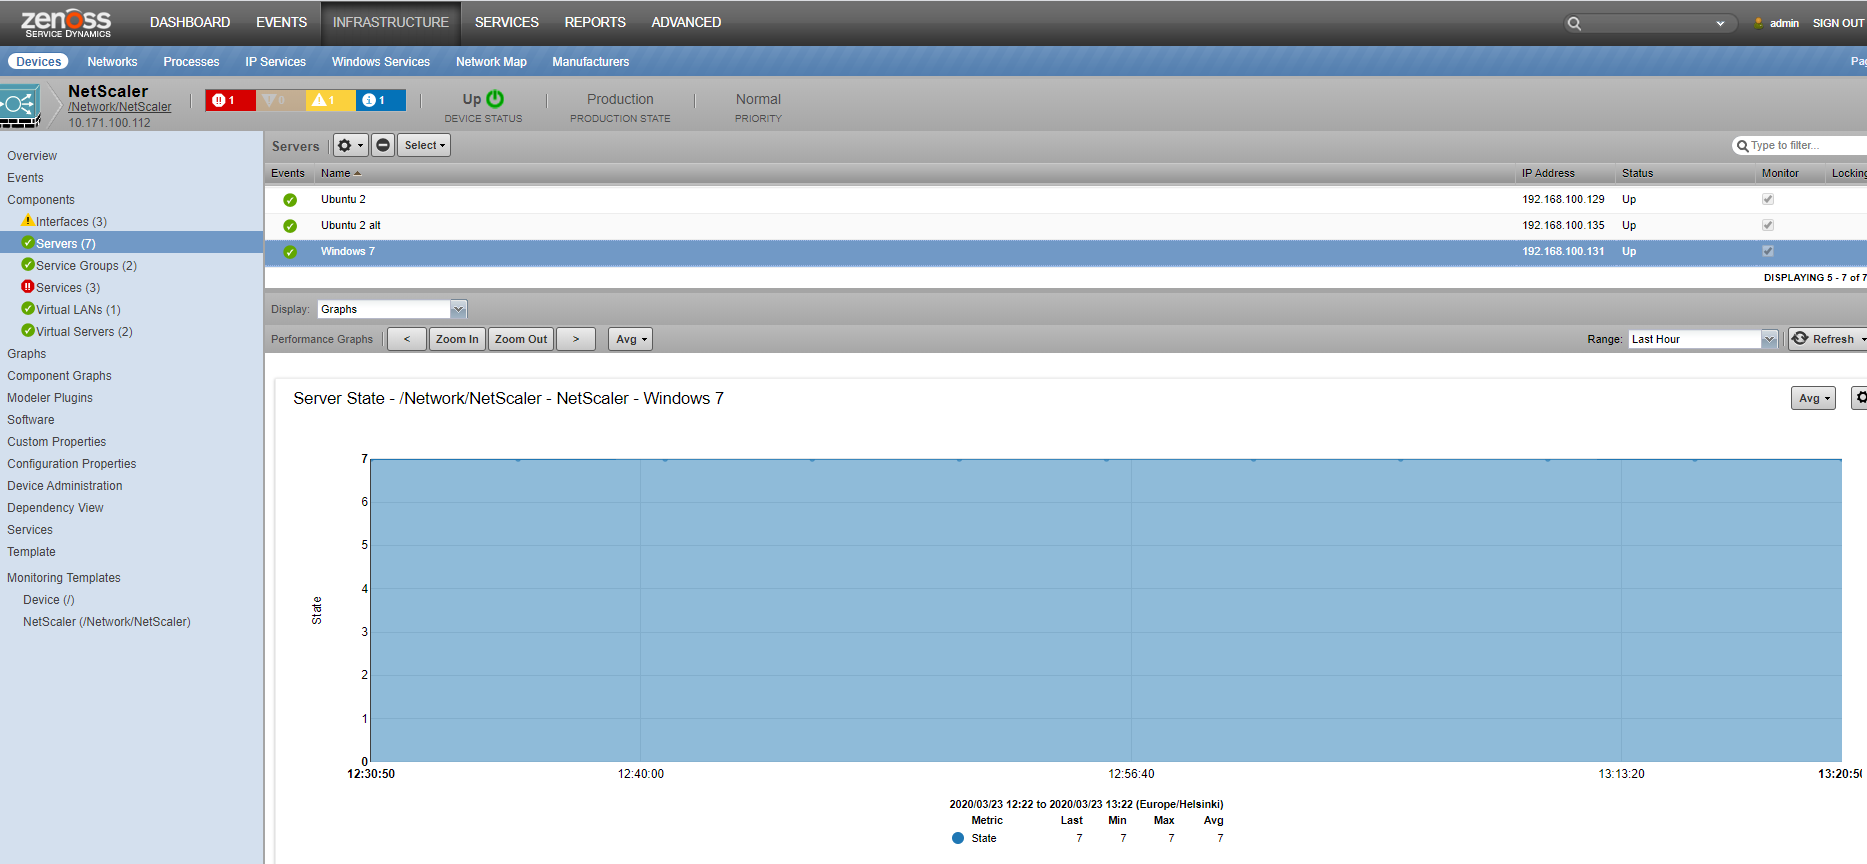
Servers
- Attributes: IP Address, Status
- Relationships: Services, Service Groups
Ethernet Interfaces
- Attributes: MAC Address, Operational Status, Admin Status
- Relationships: None
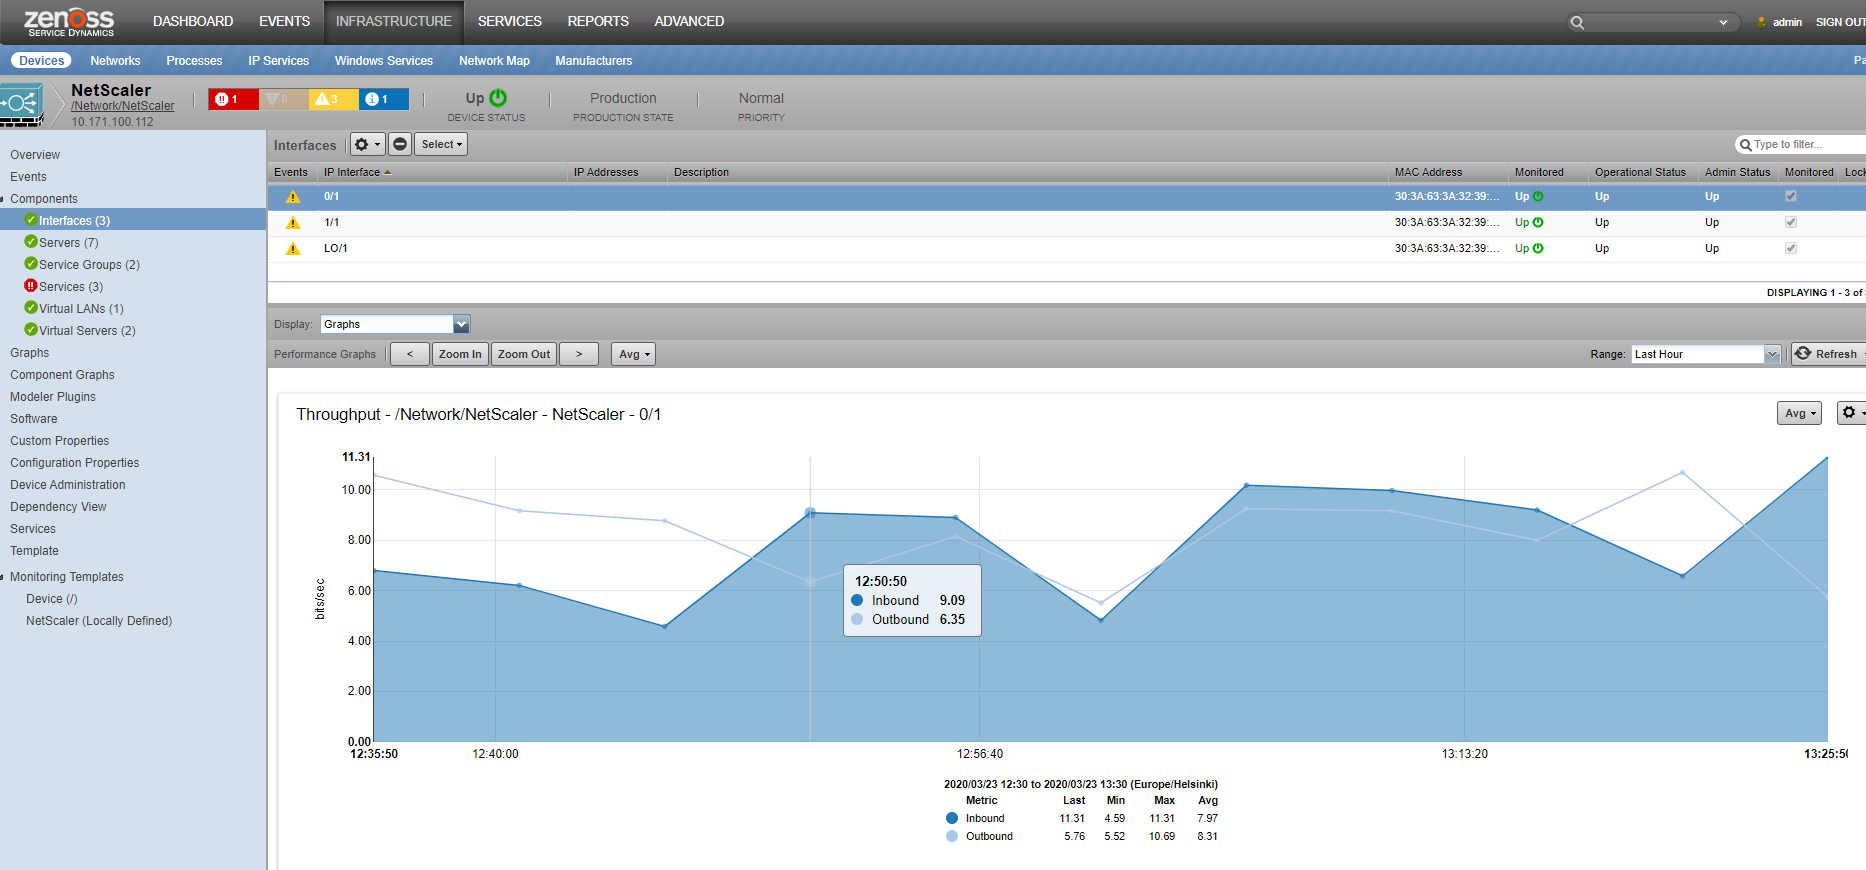
Interfaces
- Attributes: MAC Address, Monitored, Operational Status, Admin Status
- Relationships: None
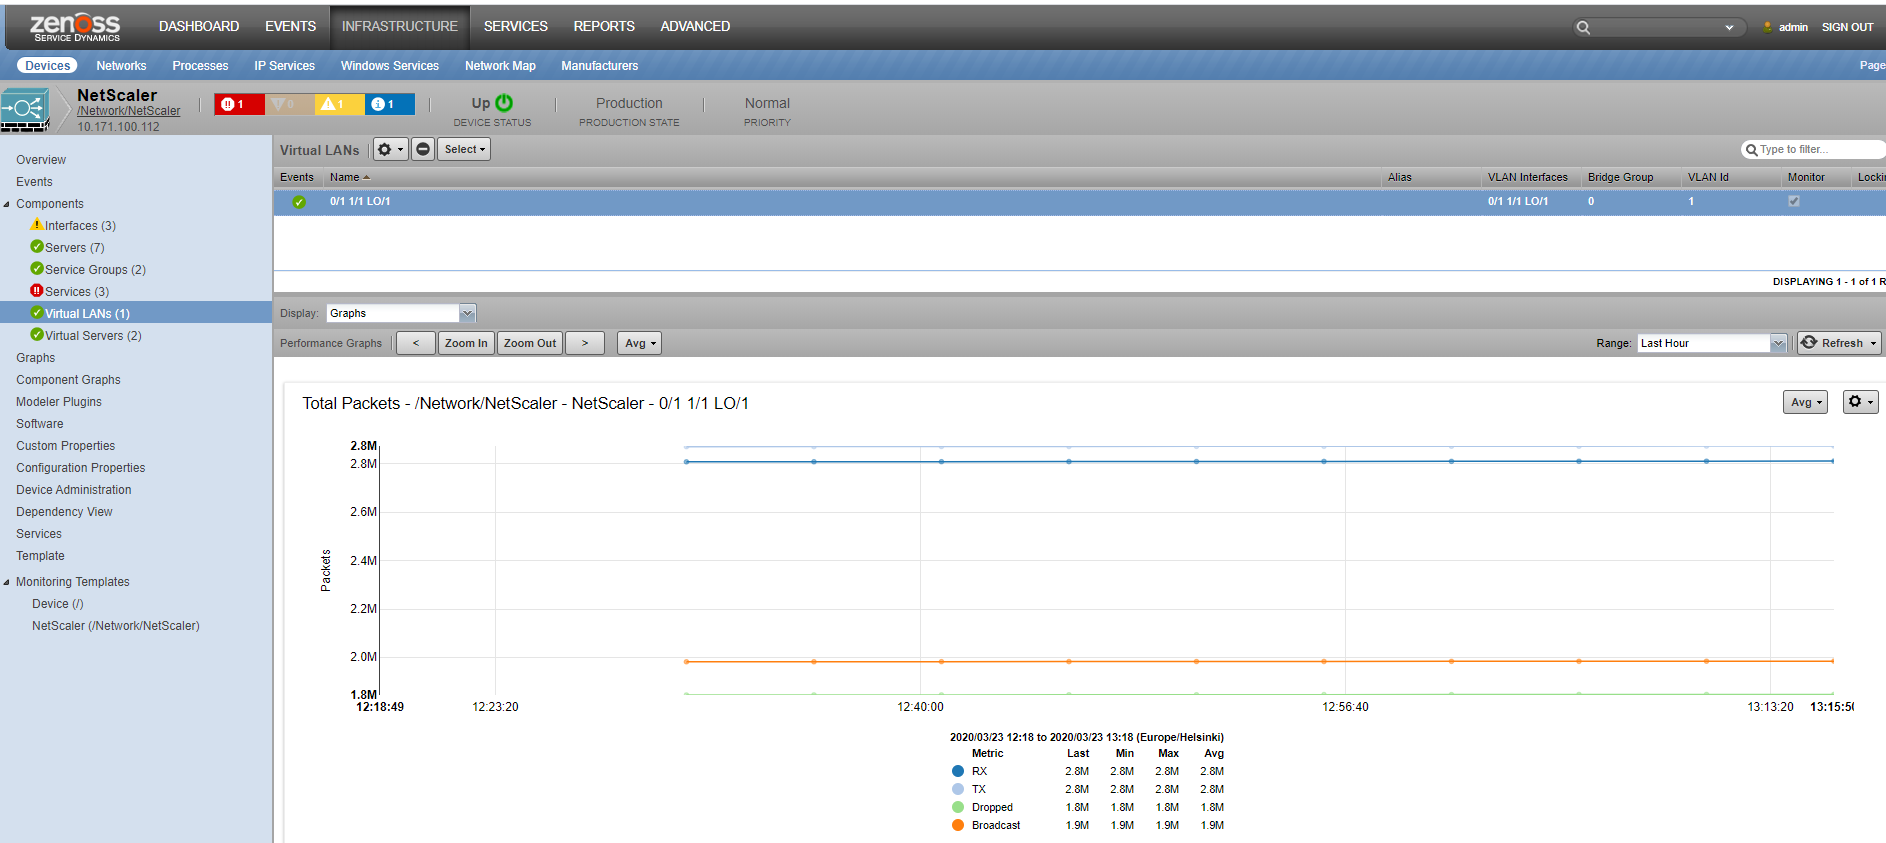
VLANs
- Attributes: Alias, VLAN Interface, Bridge Group, VLAN ID
- Relationships: None
Performance Monitoring
The following metrics will be collected every 5 minutes by default. Any otherNetScaler metrics can also be collected by adding them to the appropriate monitoring template.
Overview:
Virtual Servers:
Services:
Service Groups:
Servers:
Interfaces:
vLans:
Virtual Servers
- State: Down, Unknown, Busy, Out of Service (OOS), Transition to OOS, Up
- Current Connections: client, servers
- Total Requests/Responses: requests, responses
- Total Requests/Responses (bytes): requests, responses
- Total Received/Sent (packets): received, transmitted
- Current Services States: summation of service states
- Total Hits vs Misses: hits, misses
- Requested vs Received vs Transmitted Bytes Rate: received, transmitted, requested
Services
- State: Down, Unknown, Busy, Out of Service (OOS), Transition to OOS, Up
- Service State: state
- Max Requests per Connection: Req per Con
- Avg Transaction Time: time
- Service Connections: Established, Active, Current
- Total Requests vs Responses: Requests, Responses
- Total Requests vs Responses (Bytes): Requests, Responses
- Total Packets Received vs Sent: Received, Transmitted
- Request Rate: Rate: Bytes Rate: Received, Transmitted
- Total Clients vs Servers: Clients, Servers, Max
- Active Transactions: Transactions
Service Groups
- Service Group State: State; Disabled, Enabled
- Servers: State: Down, Unknown, Busy, Out of Service (OOS), Transition to OOS, Up
Interfaces
- Throughput: Inbound, Outbound
- Packets: Inbound, Outbound
- Errors: Receive, Send
Ethernet Interfaces
- Utilization: Received, Transmitted
- Throughput (Data): Received, Transmitted
- Throughput (Packets): Rx'd/Tx'd Unicast, Rx'd/Tx'd Broadcast, Rx'd/Tx'd Multicast Errors: Rx'd/Tx'd Errors, Rx'd/Tx'd Discards
VLANs
- Total Packets: Received, Transmitted, Dropped, Broadcast
- Total Bytes: Received, Transmitted
Device
- Maximum Connections: Connections
- Maximum Requests per Connection: Requests
Event Management
The following event classes and their subclasses will be continually collected and passed into the Zenoss event management system.
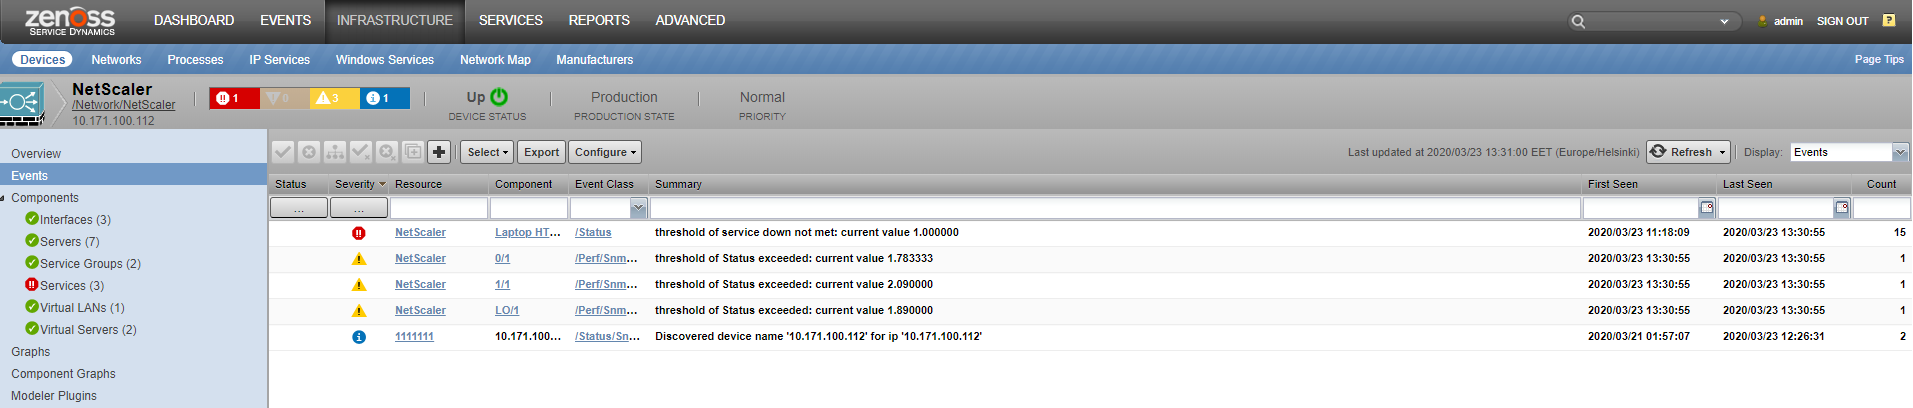
Events
- Alarm
- Event
- ExtendedEvent
- EventEx
Various information encoded in these event classes will be used to automatically determine as best as possible the following Zenoss event fields.
Standard Zenoss Event Fields
- device (set to NetScaler device in the /Network/NetScaler device class)
- component
- summary
- severity
- eventClassKey (for mapping specific event types)
- eventKey (for de-duplication and auto-clear fingerprinting)
Events collected through this mechanism will be timestamped based on the time they occurred within NetScaler, not by the time at which they were collected.
Installed Items
Installing this ZenPack will add the following items to your Zenoss system.
Device Classes
- /Network/NetScaler
Modeler Plugins
- snmp.NetScaler
Monitoring Templates
- NetScaler (in /Network/NetScaler)
- NetScalerVirtualServers (in /Network/NetScaler)
- NetScalerServices (in /Network/NetScaler)
- NetScalerServiceGroups (in /Network/NetScaler)
- NetScalerServers (in /Network/NetScaler)
- NetScalerEthernetInterfaces (in /Network/NetScaler)
- NetScalerVLANs (in /Network/NetScaler)
Troubleshooting
If any issues are encountered with the functionality offered by this ZenPack, the following checklist should be followed to verify that all configurations are correct.
Configuration Checklist
- Verify that Zenoss has been fully restarted after the ZenPack was installed.
- Verify the NetScaler's IP address or hostname is resolvable.
- Verify that the NetScaler is connecting to the proper SNMP community (zProperty: zSnmpCommunity).
- Ensure that the community string has "ALL" permissions assigned on the NetScaler device.
- Verify that the Zenoss collector server to which the endpoint device is assigned has network connectivity through any firewalls to the endpoint address.
- Check the logs.
Known Issues
The following issues have been identified in the most recent release of this ZenPack.
(ZEN-9476) The first set of data for the components - services and virtual servers take 30 minutes: After modeling NetScaler ZP, it presents the first set of data for Virtual LANs and Ethernet interfaces within usual 15 minutes. However, it takes 30 minutes to present the data for other components. There is no recommended work-around at this time.
Limitations
There is no service impact or root analysis available for the netscaler device.
Changes
2.0.0
- Updated to support NetScaler SNMP API v11, v12, v13
- Compatible with Zenoss Resource Manager 6.2-6.4 and Zenoss Cloud
- Tested with Zenoss 6.4.1, Zenoss Cloud
1.0.6
- Fix potential "Empty or invalid id specified" modeling error.
- Fix change detection on automatic cycle modeling. (ZEN-22442)
1.0.5 (2016-01-20)
- Licensing fixes. No functional changes.
1.0.4 (2014-12-08)
- Allow toggling of monitoring for all component types. (ZEN-14859)
1.0.3 (2014-11-06)
- Add basic virtual server impact.
- Replace "Ethernet Interfaces" with more functional standard "Interfaces".
1.0.2 (2014-04-04)
- Prevent components from periodically being removed by modeling. (ZEN-10499)
1.0.1 (2014-03-03)
- Fix potential zenchkrels "vlan" error. (ZEN-10424)
1.0.0 (2013-12-19)
- Initial release.