Capacity
ZenPacks.zenoss.Capacity
The Capacity ZenPack adds support for managing CPU, memory, network, and storage capacity across any managed resources.
Commercial
This ZenPack is developed and supported by Zenoss Inc. Commercial ZenPacks are available to Zenoss commercial customers only. Contact Zenoss to request more information regarding this or any other ZenPacks. Click here to view all available Zenoss Commercial ZenPacks.
Releases
Version 1.0.7 Download
- Released: 2025/10/06
- Requires: ZenPackLib ZenPack
- Compatible with Zenoss 6.8 and Zenoss Cloud
Version 1.0.6 Download
- Released: 2022/10/20
- Requires: ZenPackLib ZenPack
- Compatible with Zenoss 6.7 and Zenoss Cloud
Features
The following features are available to help you understand historical, current, and projected future capacity usage across any systems managed by Zenoss. They are intended to address the following use cases.
- Top 10 capacity usage sorted and filtered by various criteria.
- Events when thresholds are exceeded by current observations.
- Events when thresholds are projected to be exceeded within the next 90 days.
- Out of the box configurations for supported resources.
- Ability for users to add configurations for custom resources.
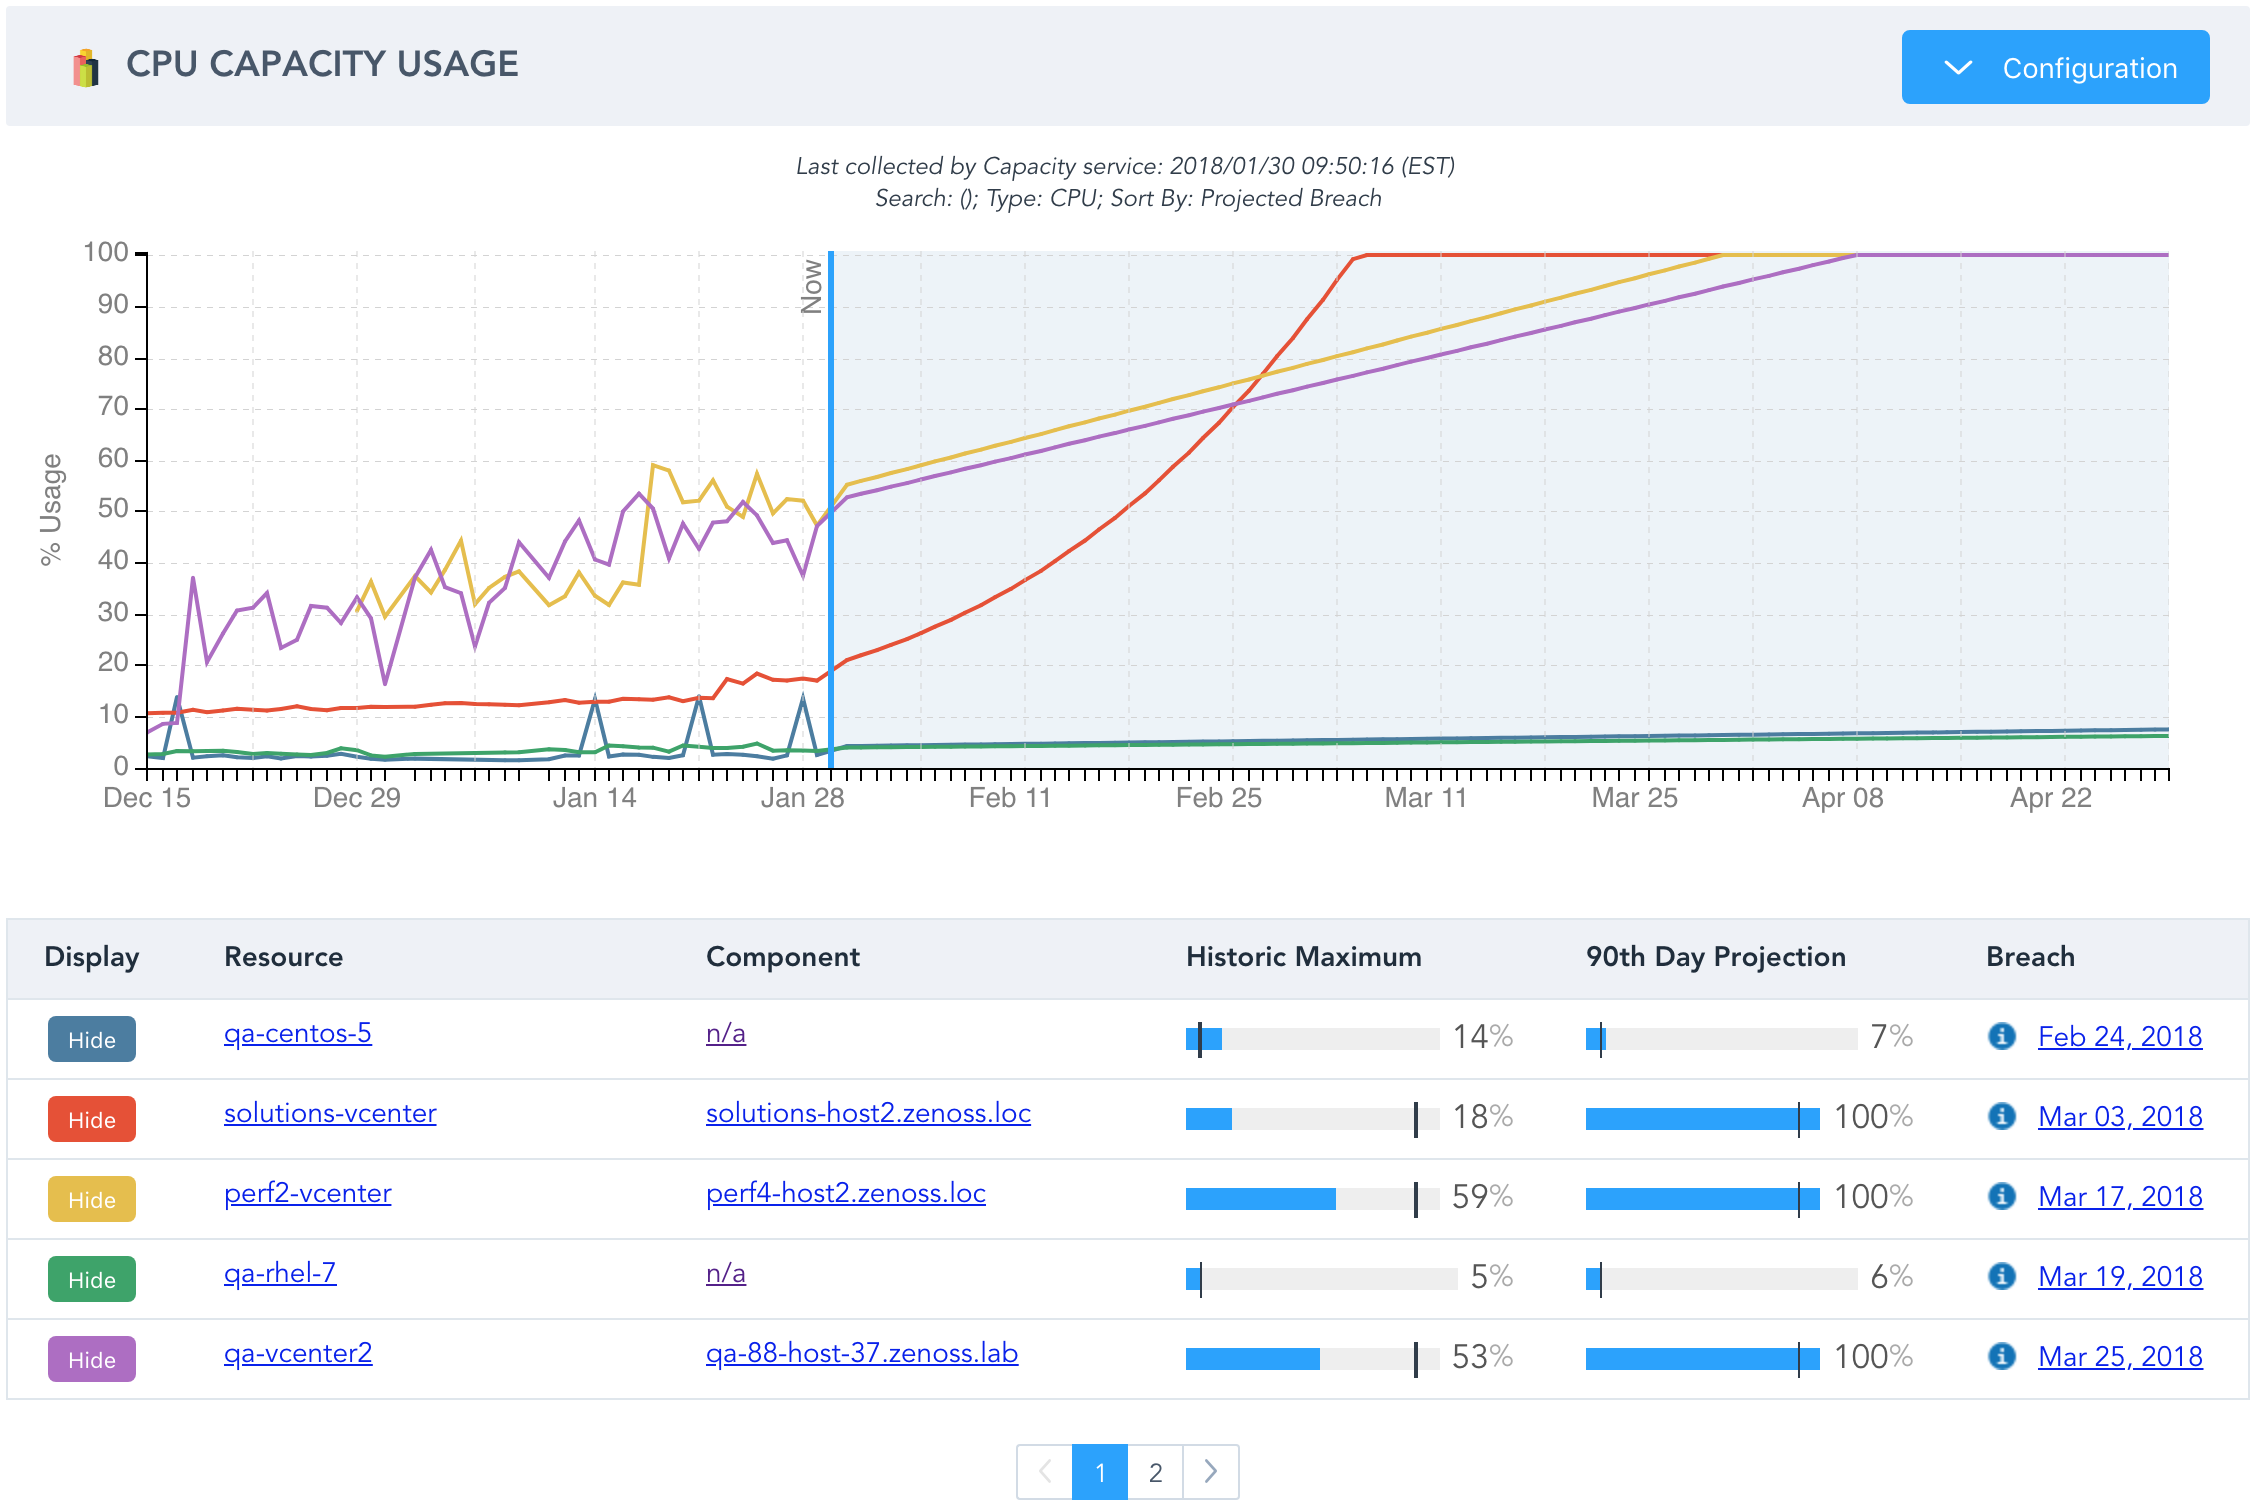
Capacity Usage Report
The Capacity Usage report found in the Capacity Planning folder, located in the Reports section of Zenoss, provides top 10 capacity usage across the entire environment.
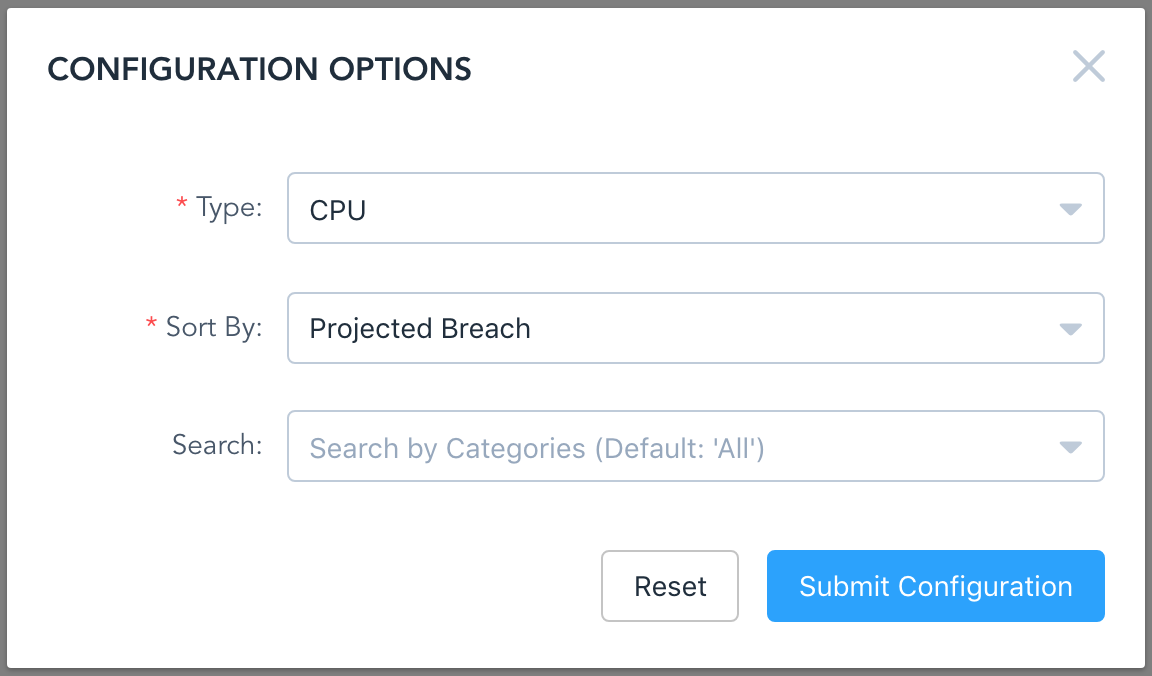
The top 10 are selected based on one of the following summary functions (Sort By).
- Average: Average value over the last 90 days.
- Maximum: Maximum value over the last 90 days.
- Minimum: Minimum value over the last 90 days.
- Projected Breach: Projected date the maximum value will exceed the threshold.
- Projected Maximum: Projected maximum value 90 days from now.
Note
Projected Breach and Projected Maximum are based on the daily maximum values over the last 90 days.
The top 10 can be filtered by the following criteria.
- Capacity Type: CPU, Memory, Network, Storage
- Resource Grouping: Collector, Component Group, Device Class, Device Group, Location, System, Resource Type
Note
When multiple groupings are selected, they become a logical OR. For example, if the "Austin" location is chosen, and the "/Network/Cisco" device class is chosen, you will see all devices in the Austin location, and all devices in the /Network/Cisco device class. This likely includes devices in devices classes other than /Network/Cisco, and devices in locations other than Austin.
Capacity Usage View
The Capacity Usage View is added for all devices and components in the system. It looks similar to the Capacity Usage Report, but it's function is different.
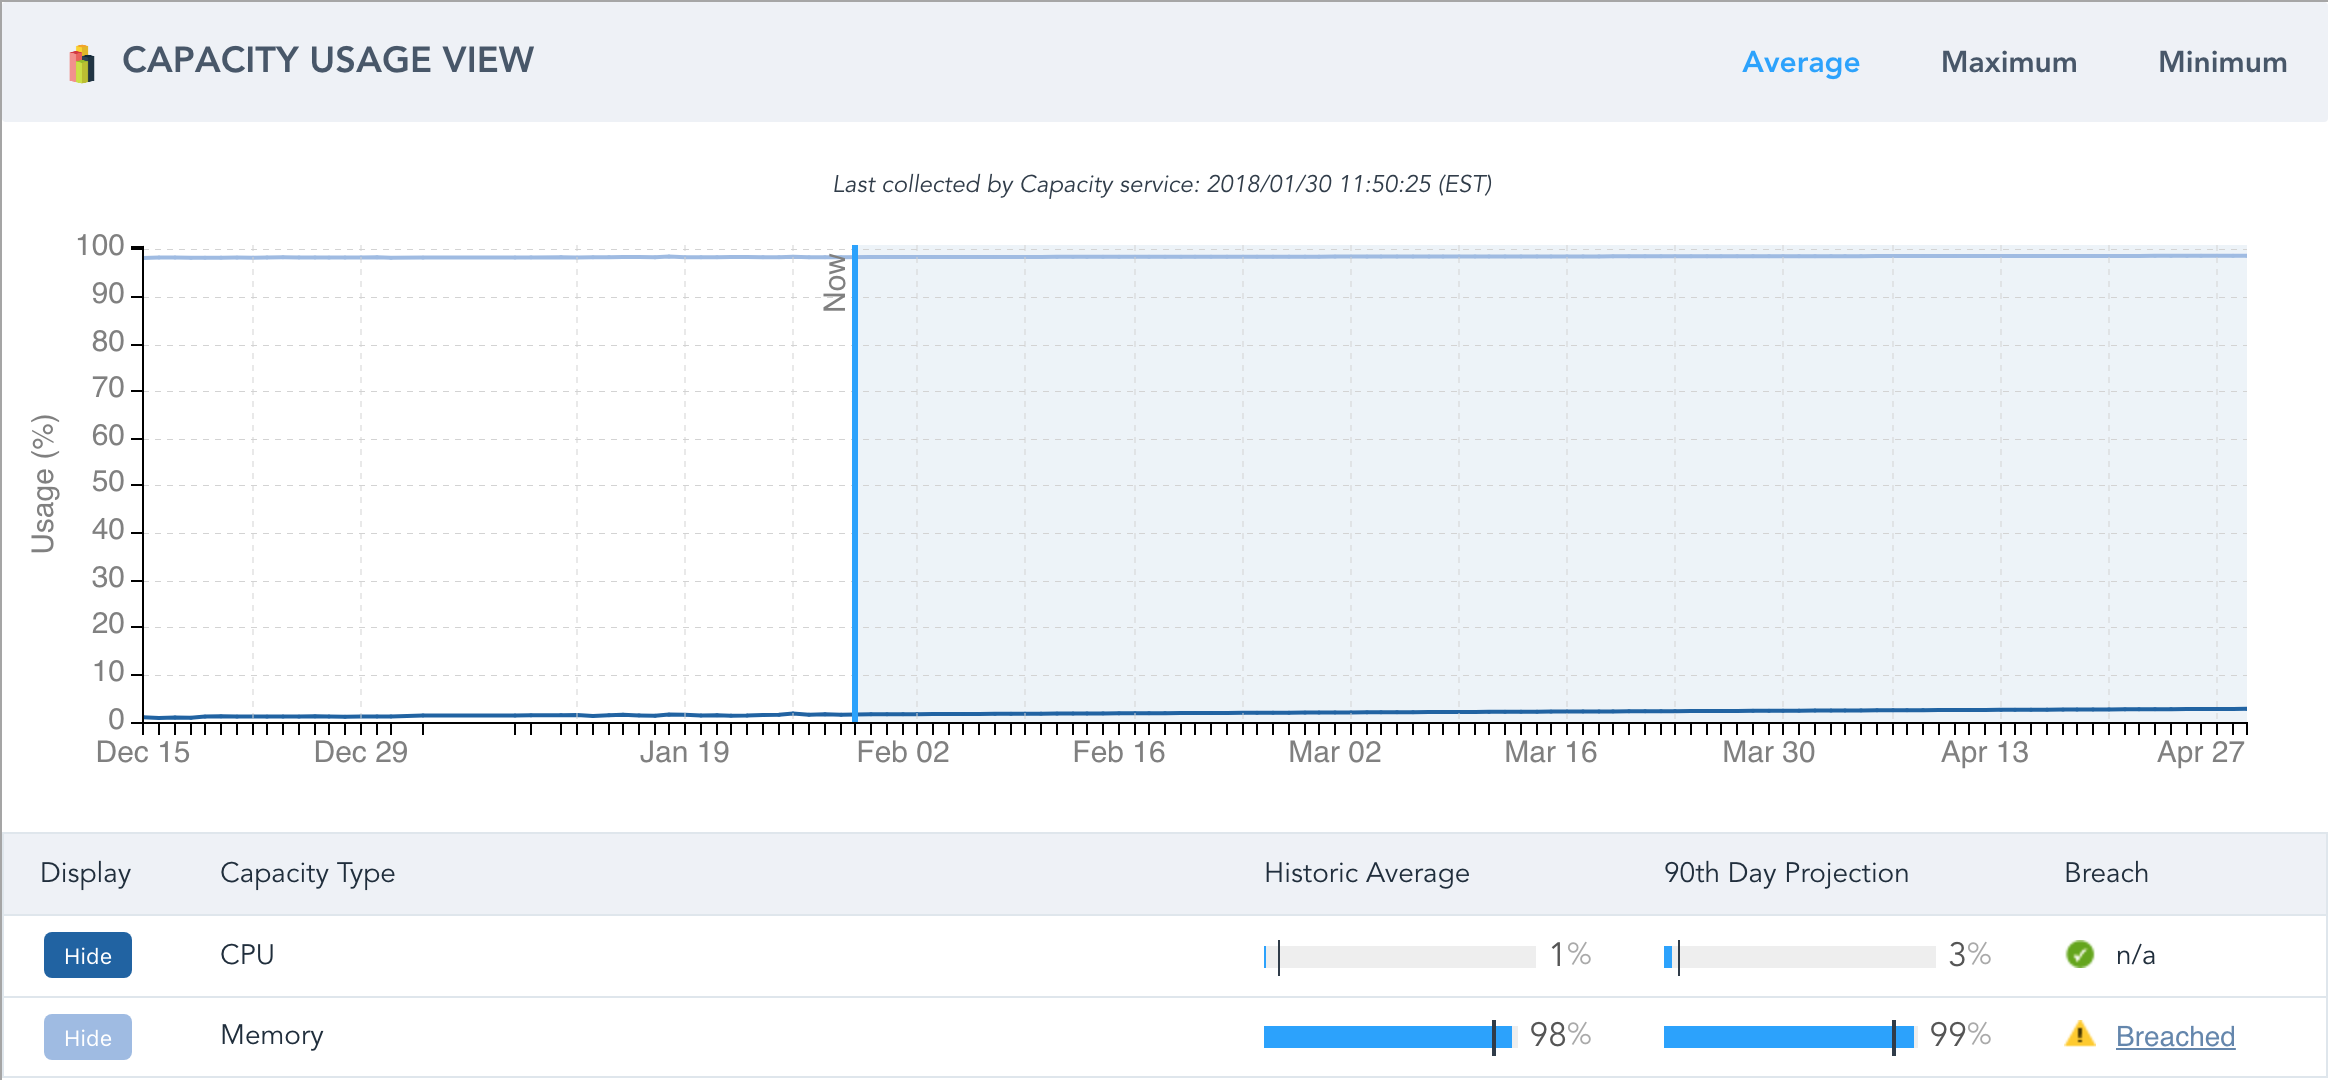
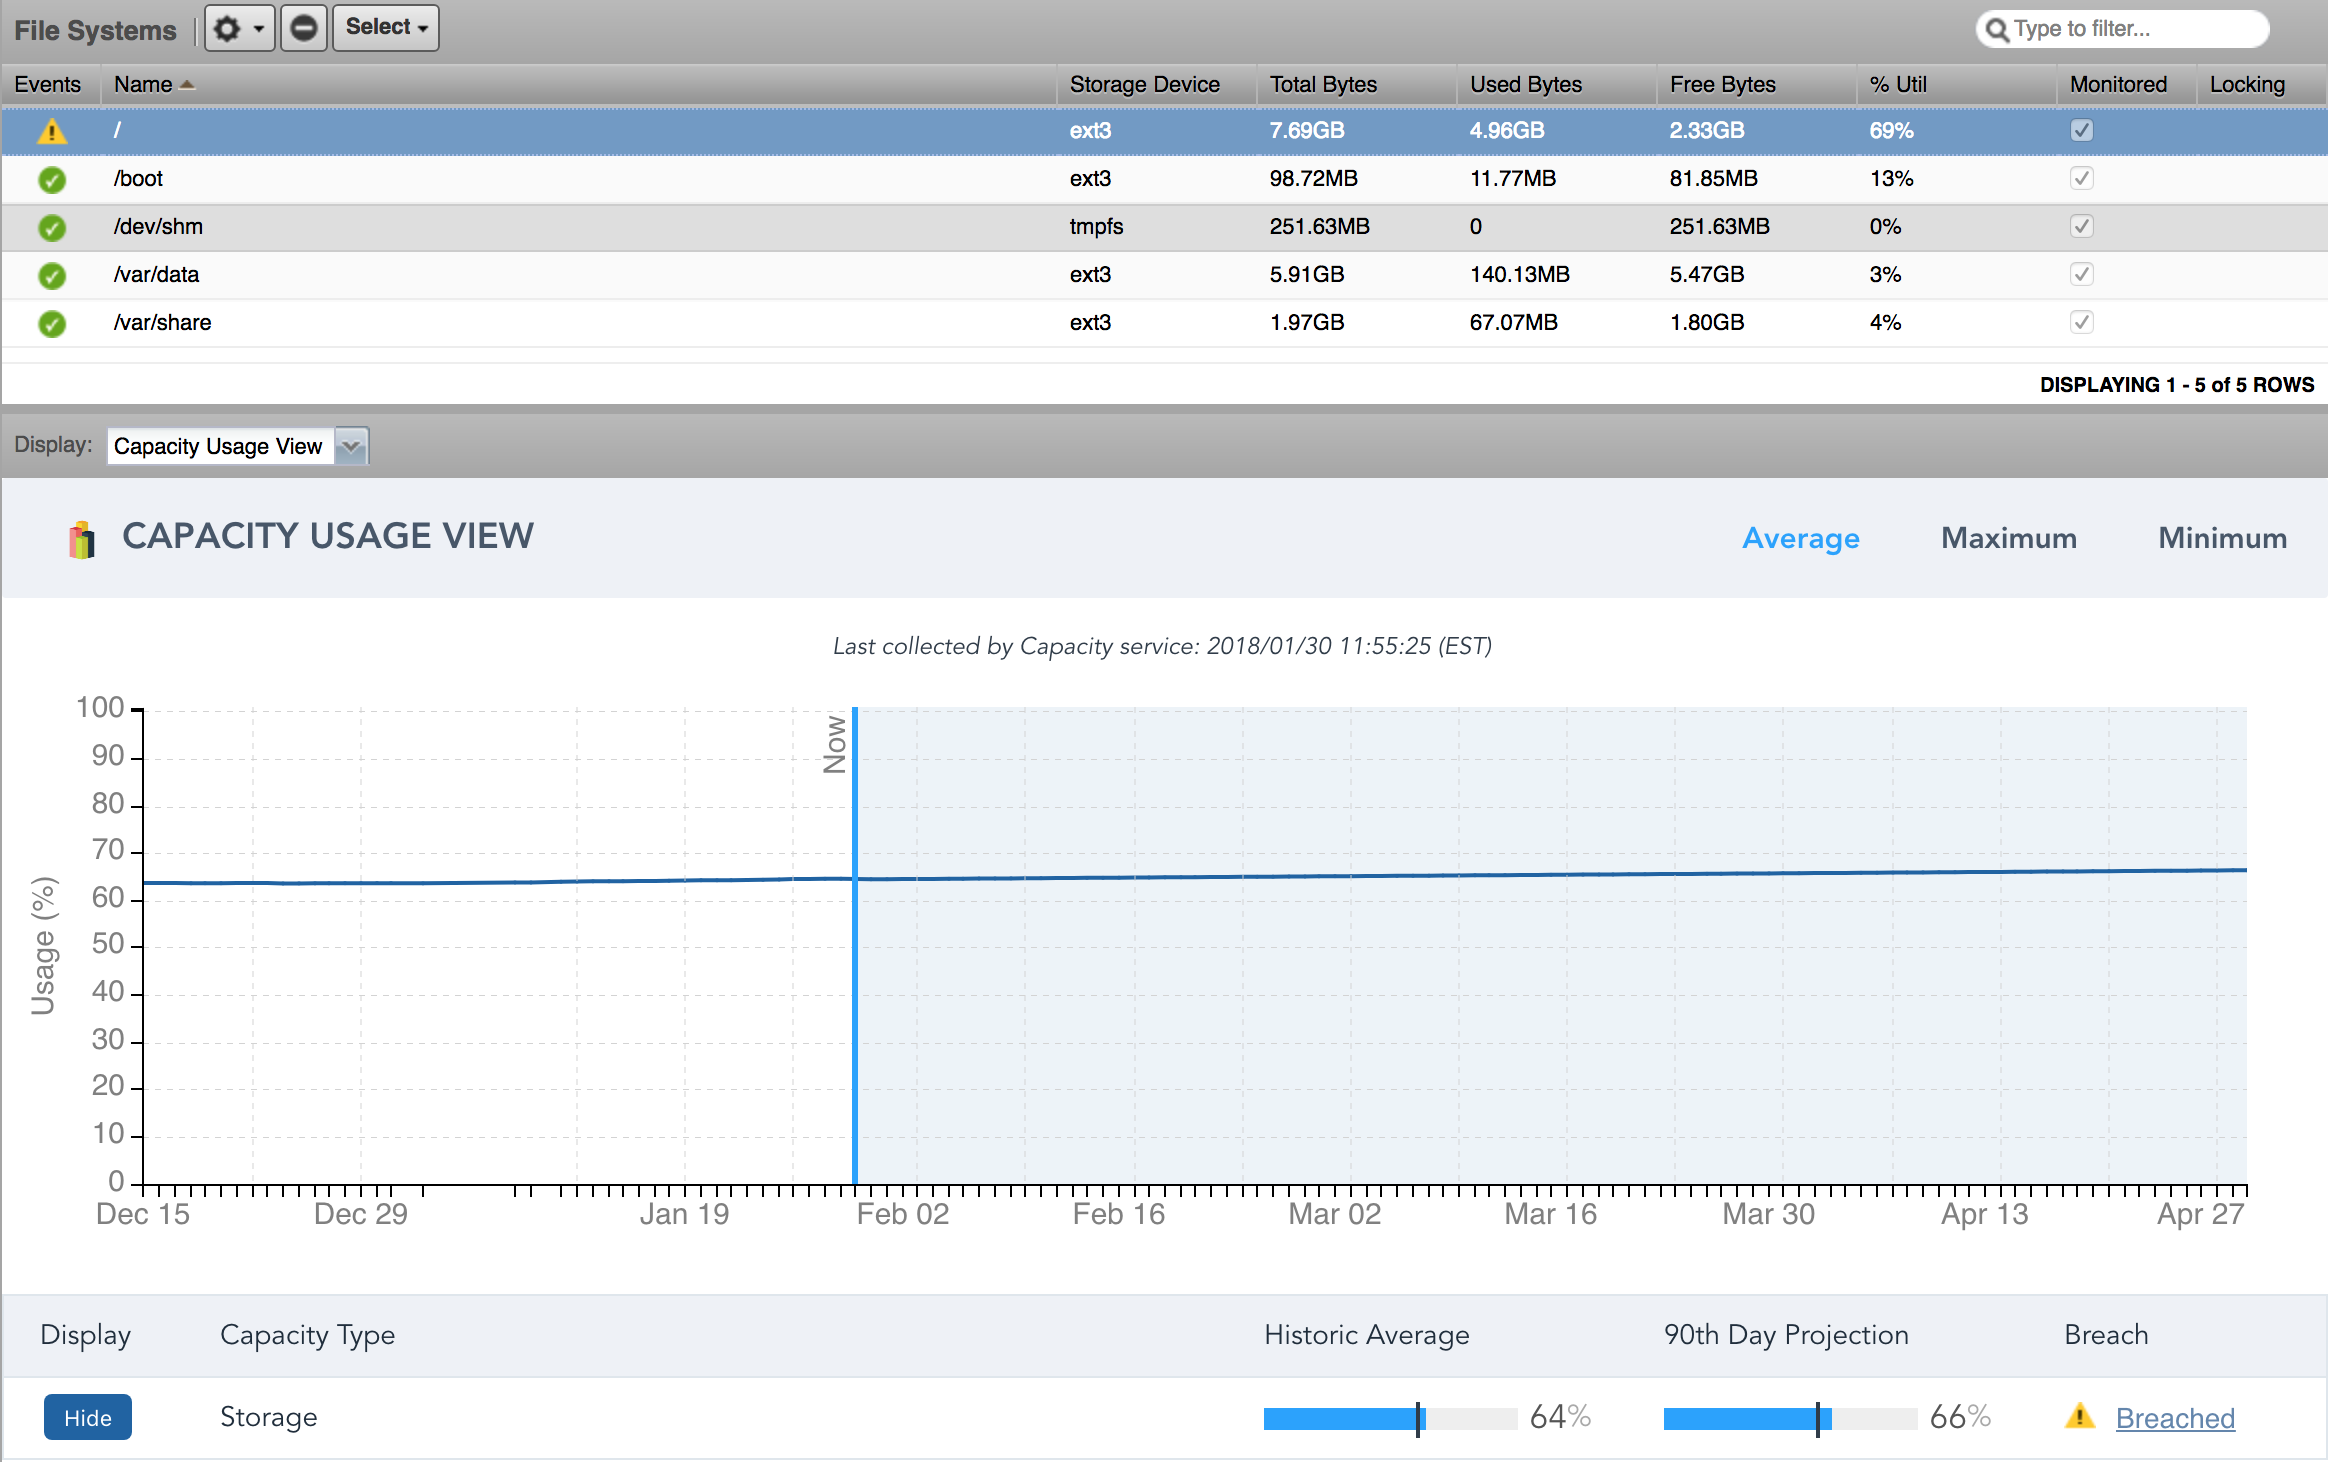
The only configuration available on the view is to device whether you want to look at daily average, maximum, or minimum values. There's no need to choose the capacity type because all available types of capacity data for the device or component will be shown. Similarly there is no need to specify a sort or search because there can be at most one line on the chart for each type of capacity.
Note
The device-level view only shows capacity data for the device, and not for any of the device's components. For this reason you won't see anything on the device-level view on device types like vCenters or UCS Managers that only have component-level capacity data.
Capacity Threshold
A new CapacityThreshold threshold type is what allows capacity-specific information to be identified in data already being monitored by Zenoss.
Threshold Configuration
The CapacityThreshold type of threshold has the following configuration options in common with most other types of thresholds.
- Name: Everything must have a name.
- DataPoints: Datapoints used in the evaluation of the threshold.
- Severity: Severity of events created when the threshold is breached.
- Event Class: Event class for created events.
- Enabled: Whether or not the threshold is enabled.
The following additional configuration options must also be set.
- Capacity Type: Must be one of cpu, memory, network, storage.
- Total Expression: Python expression that must return the total capacity in native units.
- Used Expression: Python expression that must return the currently used capacity in native units.
- Percent Threshold: At what percentage (0-100) used of total is the threshold considered exceeded.
Threshold Events
Once configured, capacity thresholds can create two different types of events: current breaches, and projected breaches.
Current Breaches
Current breach events can be created every time the threshold's configured datapoints are collected. This is comparable to how most other types of thresholds work. No historical or projected future data is considered. An event will be created if the current used value is a higher percentage of the total value than the configured percent threshold.
Current breach events will have the following standard event fields set as follows.
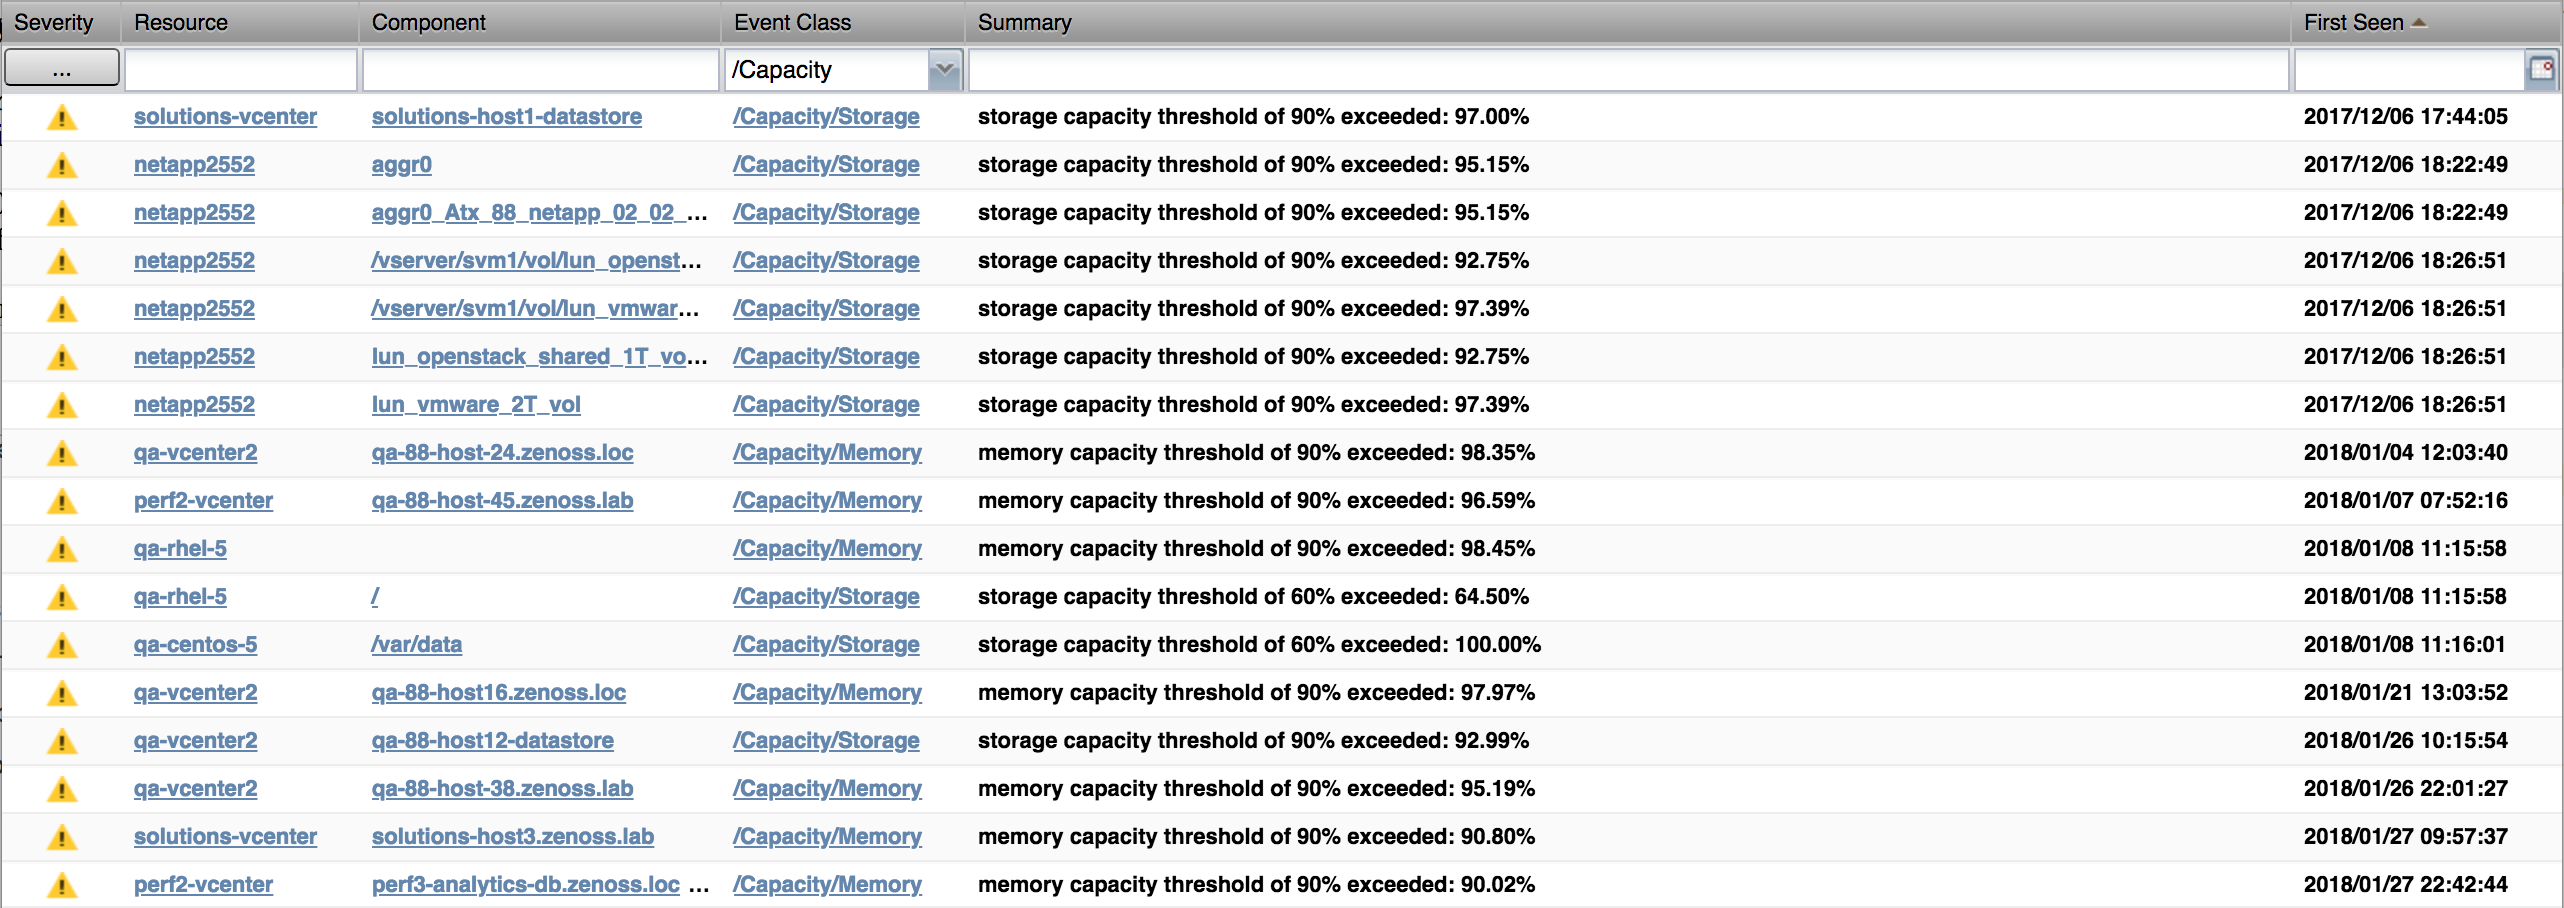
- agent: Process that collected the associated datapoint(s).
- eventClass: /Capacity by default.
- eventGroup: capacity
- severity: Warning by default.
Current breach events will also have the following additional details.
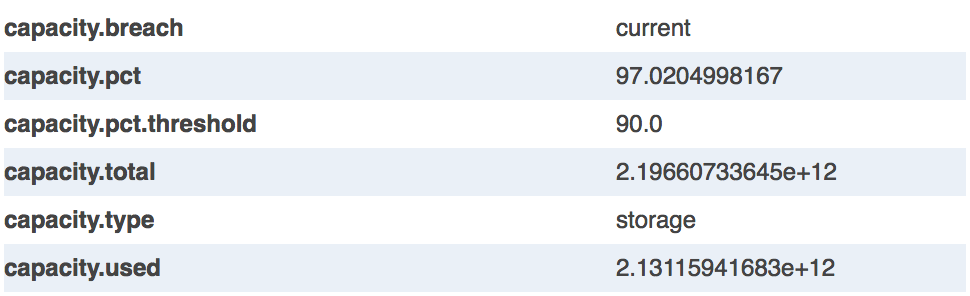
- capacity.breach: Always set to "current" for current breach events.
- capacity.pct: Current percentage used of total.
- capacity.pct.threshold: Configured percent threshold.
- capacity.total: Current total value in native units.
- capacity.type: Type of capacity. One of: cpu, memory, network, storage.
- capacity.used: Current used value in native units.
Projected Breaches
Projected breach events are created once per day (at midnight, UTC) by the Capacity service. The last 90 days of historical values are considered to project when those 90 day trends will result in having the configured threshold breached. A projected breach event will be created if the projected maximum value exceeds the configured threshold within the next 90 days.
Projected breach events will have the following standard event fields set.
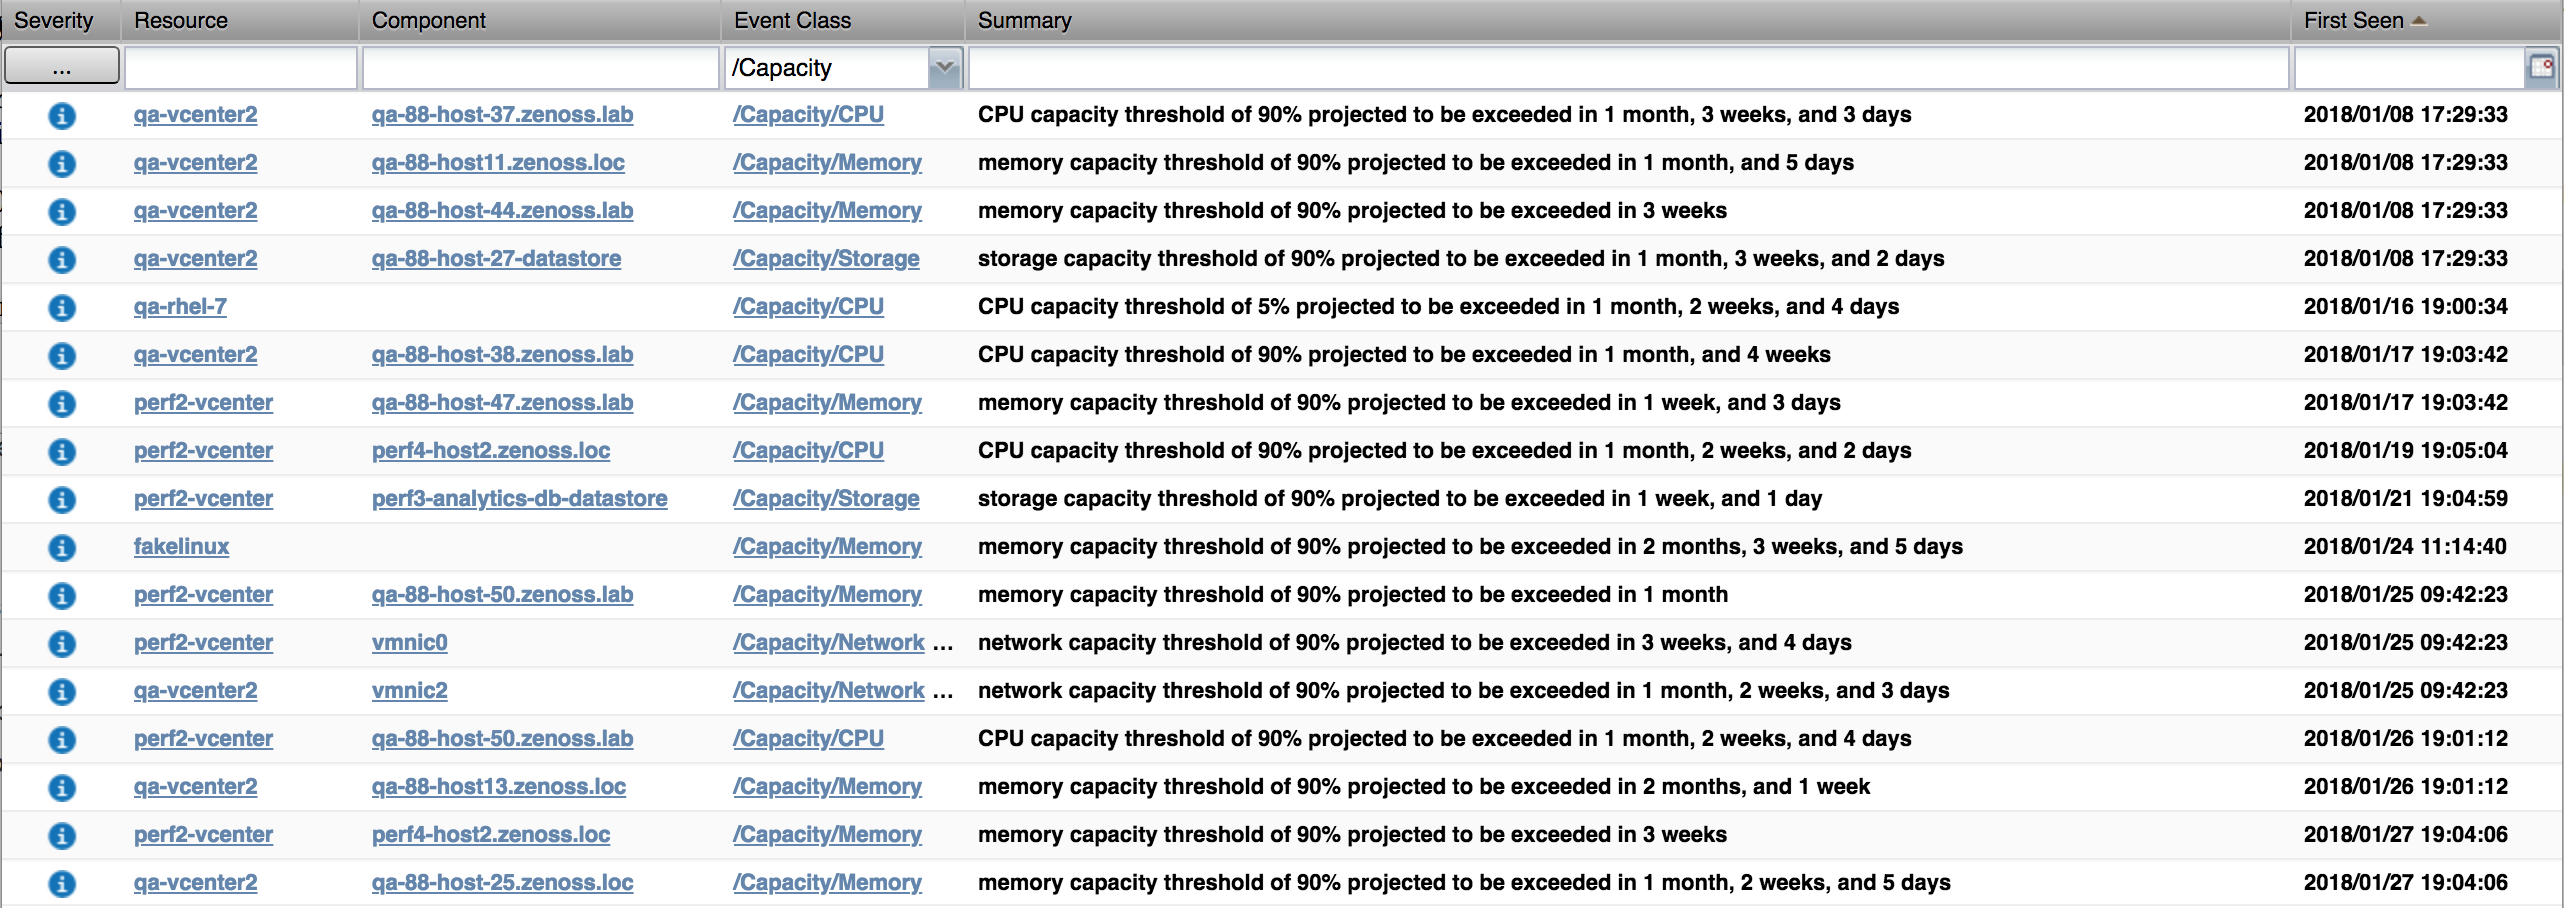
- agent: zencapacity
- eventClass: /Status/(CPU|Memory|Network|Storage) by default.
- eventGroup: capacity
- severity: Info by default.
Projected breach events will also have the following additional details.
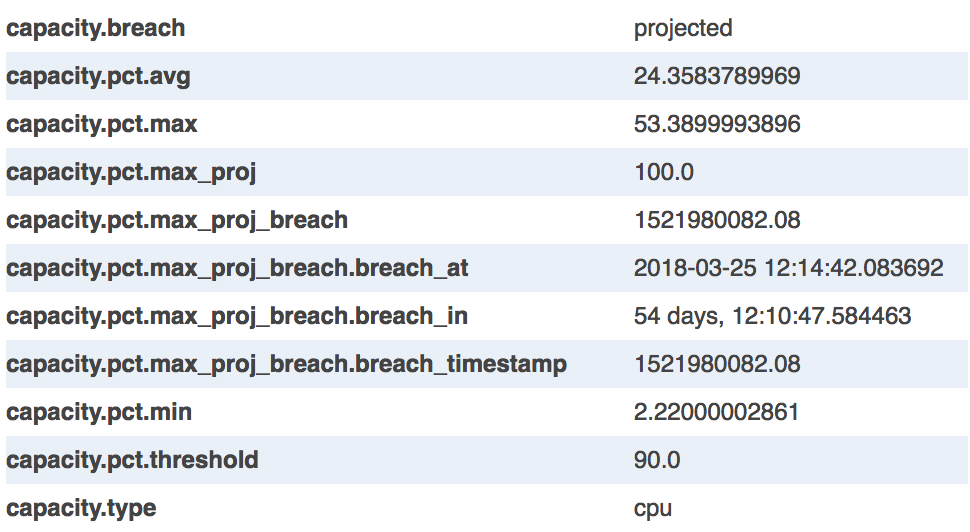
- capacity.breach: Always set to "projected" for projected breach events.
- capacity.pct.avg: Average value over last 90 days.
- capacity.pct.max: Maximum value over last 90 days.
- capacity.pct.max_proj: Projected maximum value in 90 days.
- capacity.pct.max_proj_breach: UNIX timestamp of projected breach.
- capacity.pct.max_proj_breach.breach_at: UTC date and time of projected breach.
- capacity.pct.max_proj_breach.breach_in: Time until projected breach.
- capacity.pct.max_proj_breach.breach_timestamp: UNIX timestamp of projected breach.
- capacity.pct.min: Minimum value over last 90 days.
- capacity.pct.threshold: Configured percent threshold.
- capacity.type: Type of capacity: One of: cpu, memory, network, storage
Usage
This section covers how to use the Capacity ZenPack.
Getting Started
After installing the Capacity ZenPack there are a few things you should know.
No Capacity Data Available
If you attempt to use the Capacity Usage Report or Capacity Usage View immediately after installing the ZenPack, you will likely receive a warning of No Capacity Data Available. This is normal, and it is likely occurring because you need up to 24 hours of capacity data in the system before these views can work.
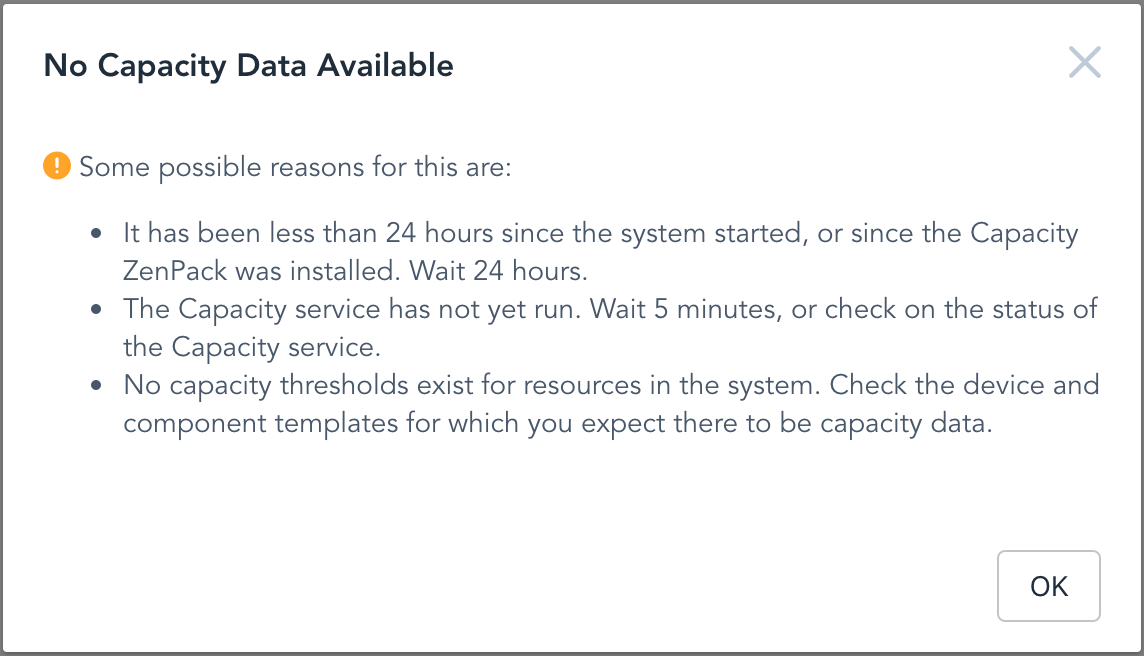
If you still see this warning after the ZenPack has been installed for 24 hours, there are some other reasons for it.
- The Capacity service has not yet run. Check on the service's status.
- No capacity thresholds exist for resources in the system. Check the device and component templates for which you expect there to be capacity data.
No Results
Once some capacity data is available, it is possible that you will submit a configuration for which no results exist.
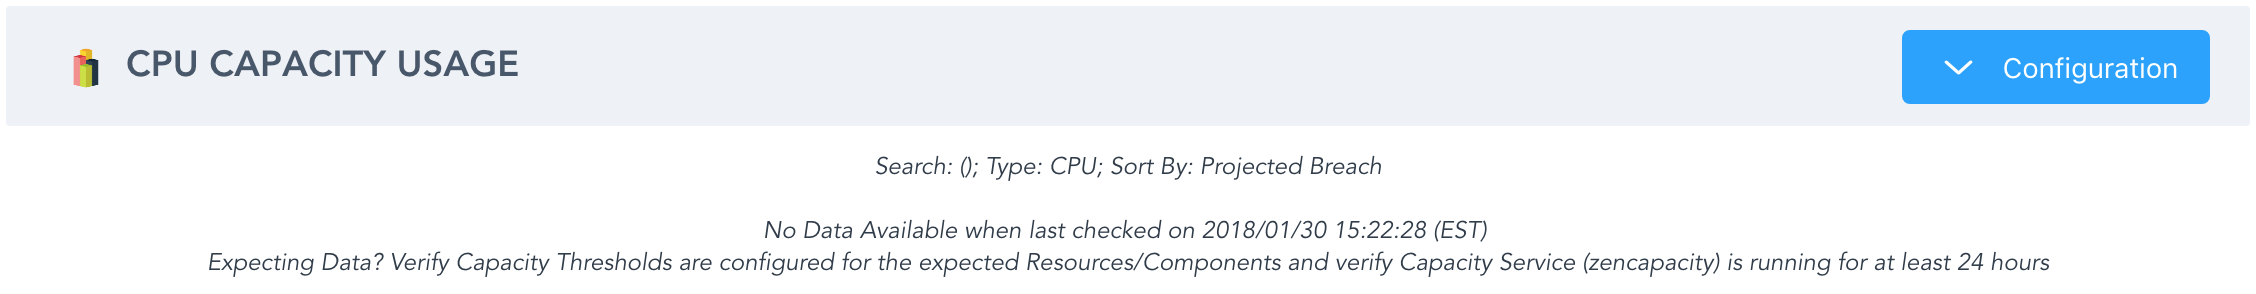
This, "Expecting Data?" result only appears on the Capacity Usage Report, not any Capacity View because it's possible that your configured criteria on the report don't match any resources for which capacity data exists.
Some specific reasons why you may get this result.
- You've chosen to Sort By Projected Breach, yet no resources are projected to breach their threshold in the foreseeable future.
- You've chosen to Sort By Projected Maximum, yet not enough history (5 days) exists to project a maximum value.
- You've chosen a Type that is not applicable to the Search. Such as choosing storage for the /Network/Cisco device class.
Insufficient Data
Within the first five days of using Capacity you will find that the chart on the report and views will appear, but there will be no projections.
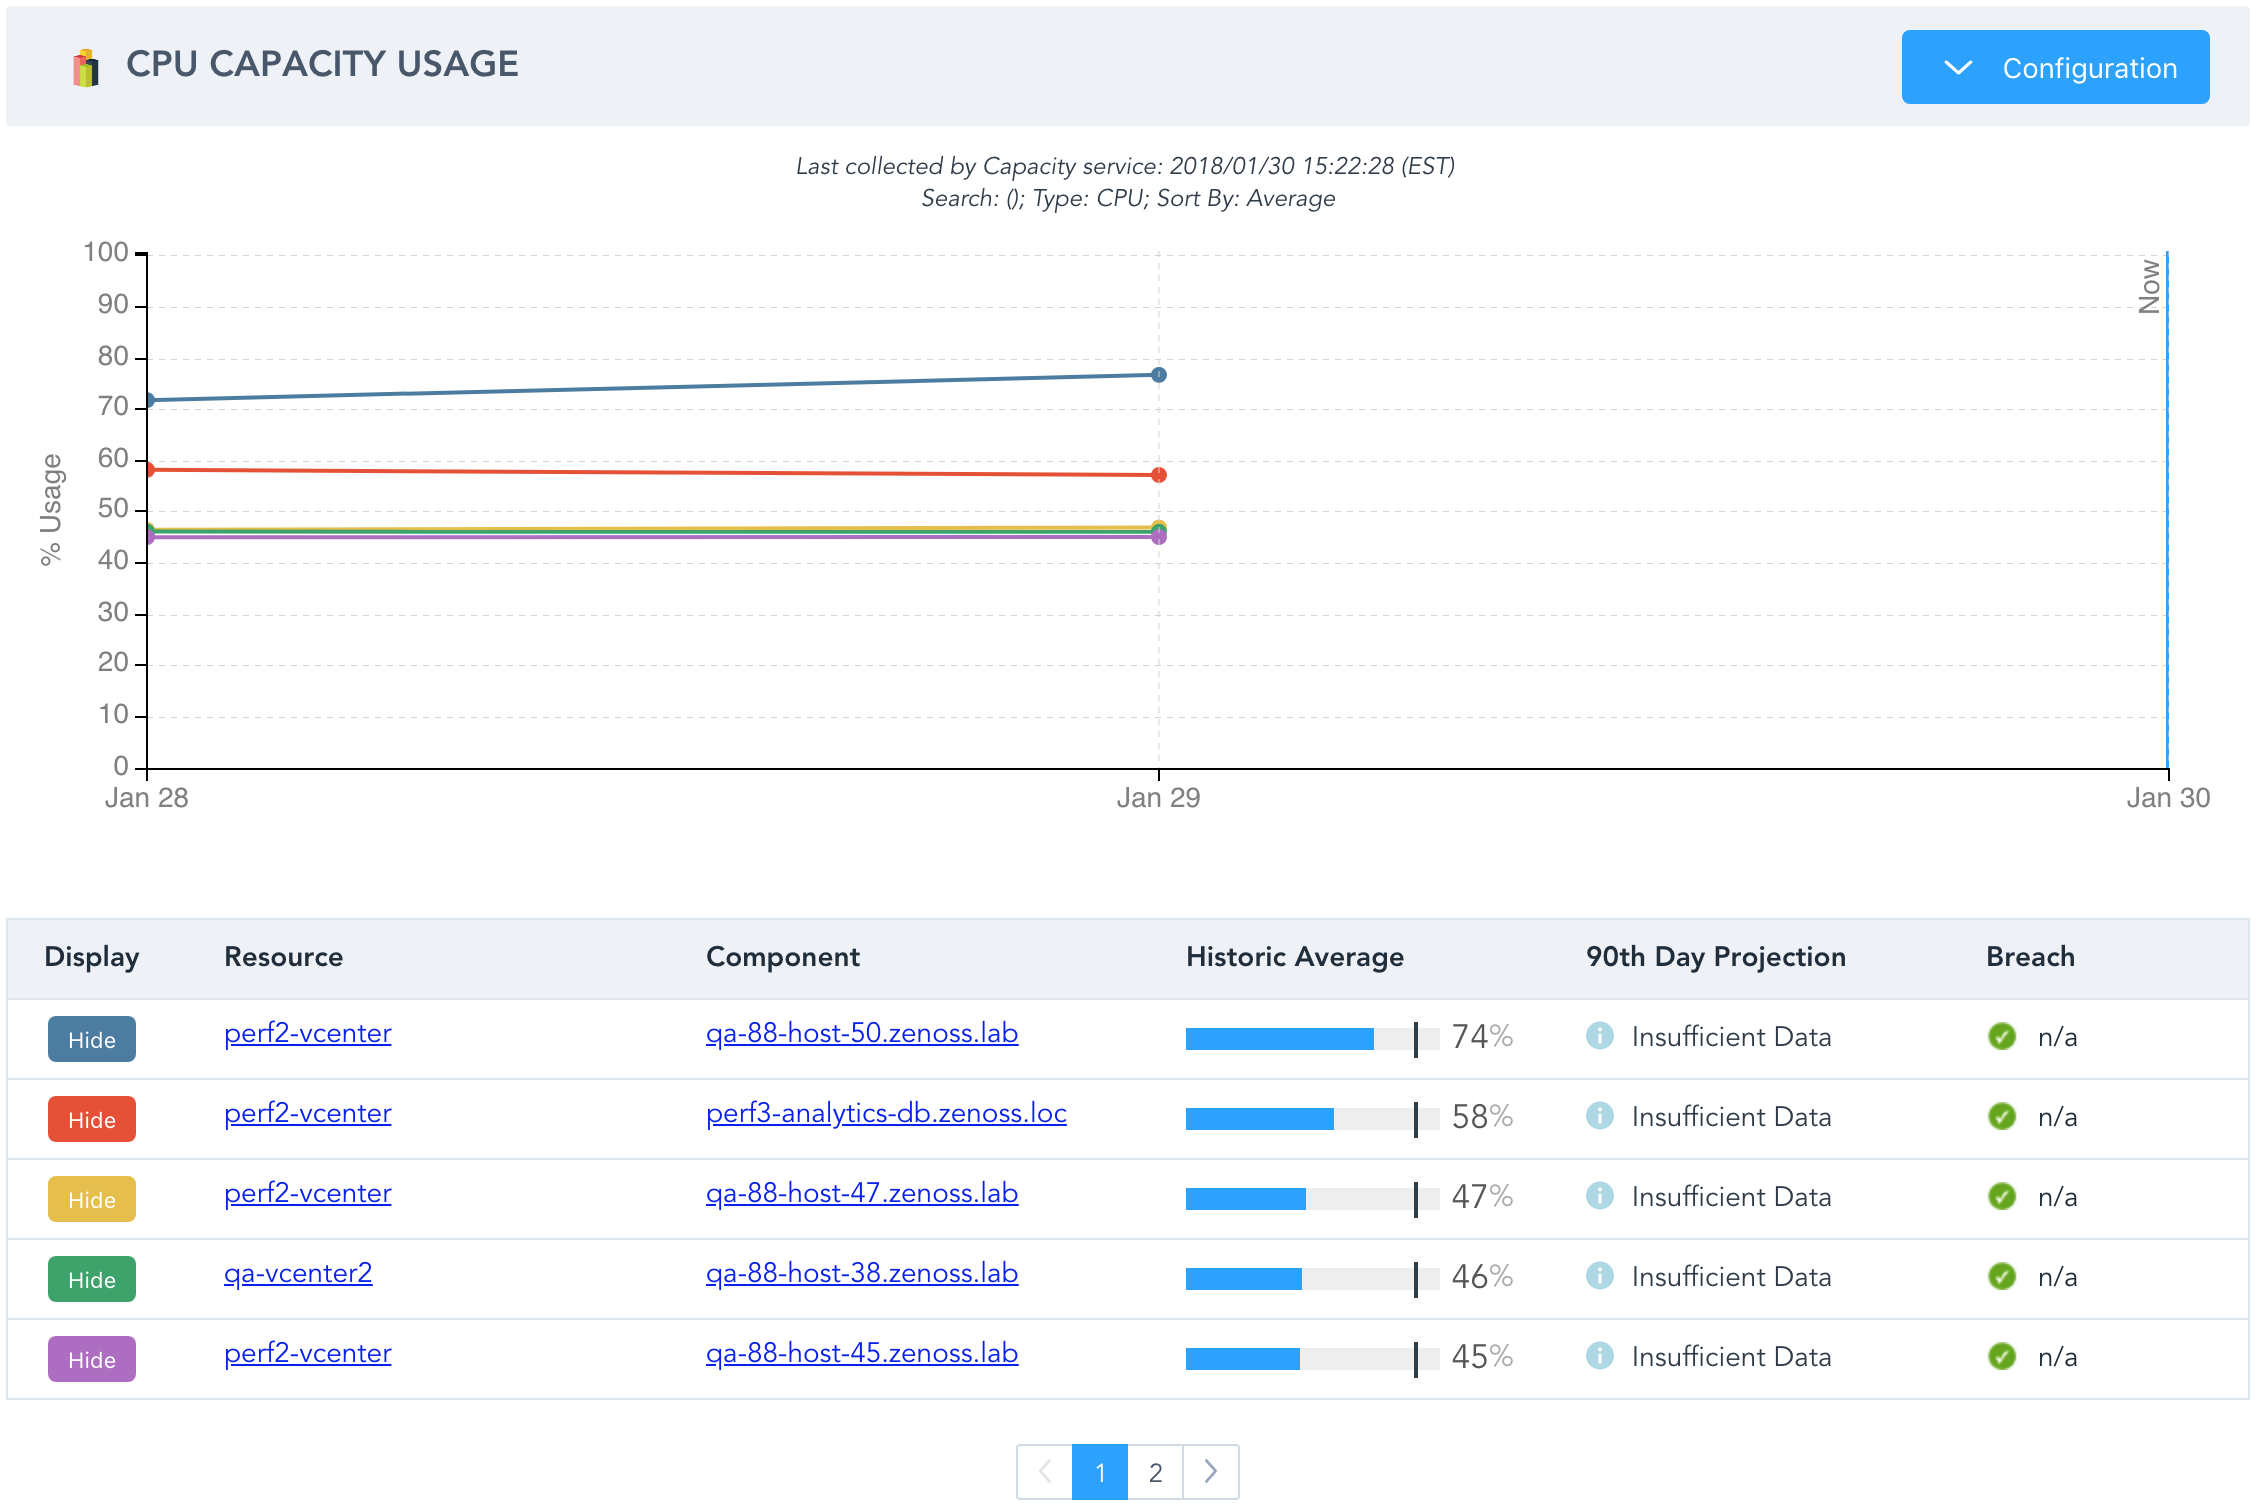
You will also see that the 90th Day Projection column in the table indicates Insufficient Data. This is because there is a built-in limit that prevents projecting any future values until at least five days of historical data exist.
Note
The amount of history available depends only on when capacity thresholds were added to datapoints. Having 90 days of CPU, memory, network, or storage datapoints prior to installing the Capacity ZenPack, or prior to adding capacity thresholds for those datapoints doesn't count. The reason for this has to do with the data normalization performed by the Total Expression and Used Expression of the threshold. Previously-existing datapoint values are not known to be normalized into used and total values in the correct native units, or to a used percentage of total.
Unpredictable Data
One last unexpected thing you may see in the report and views is Unpredictable Data.
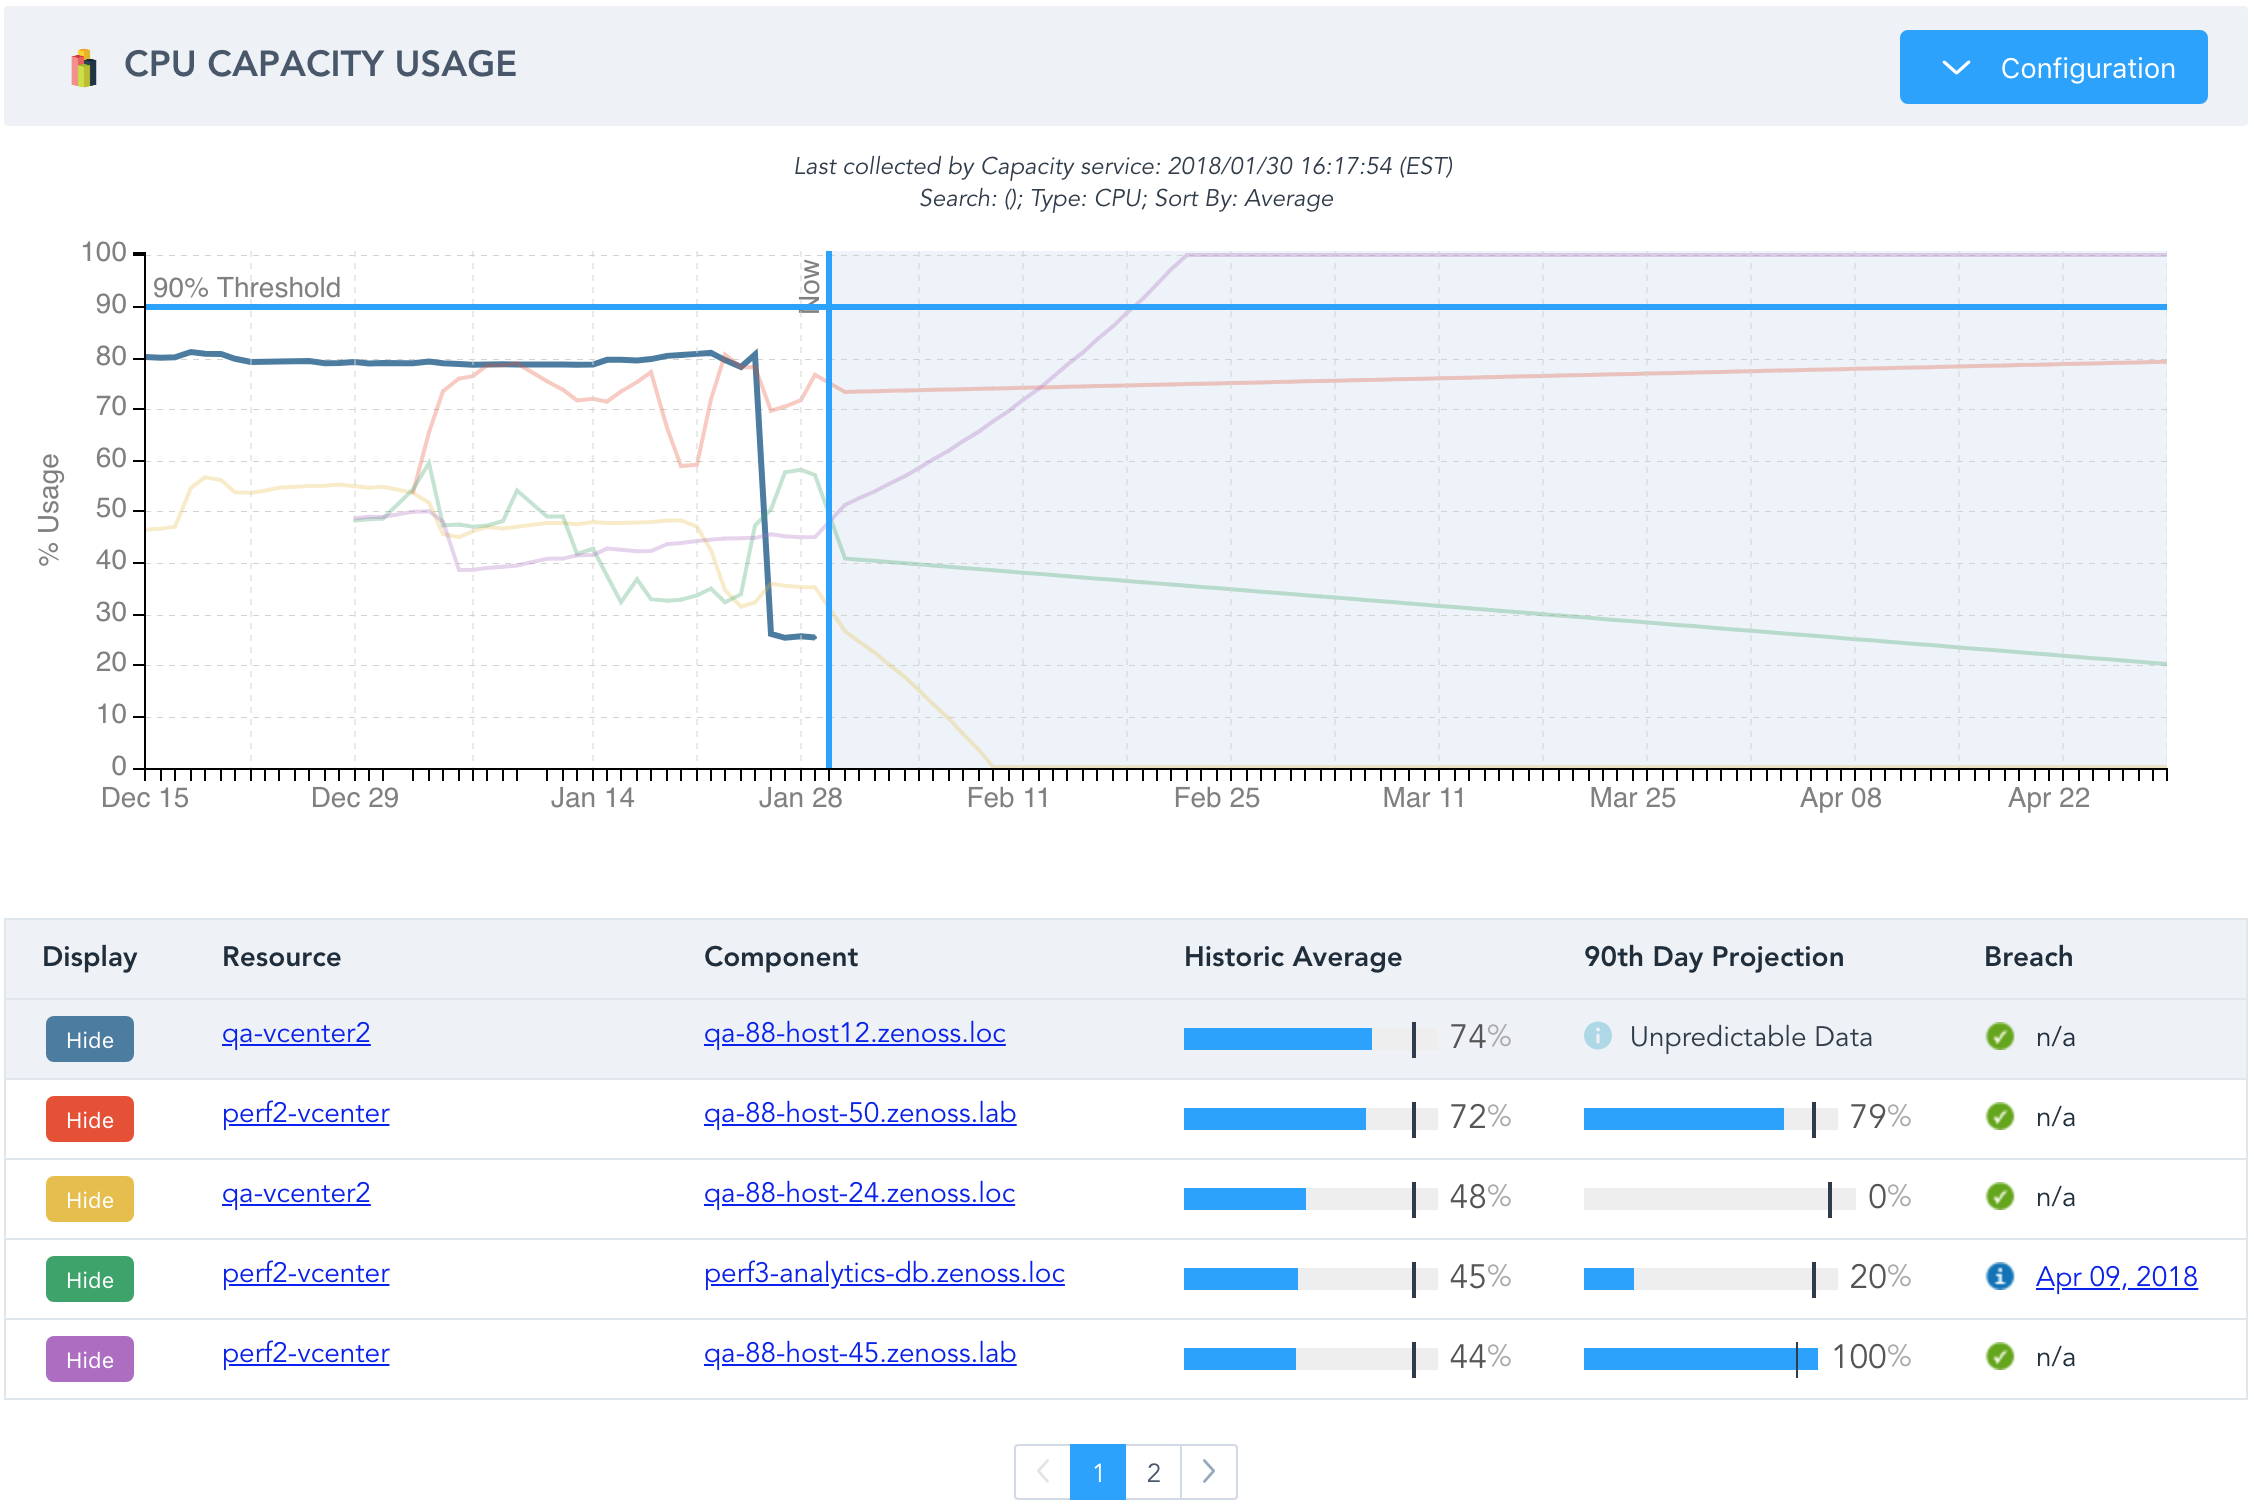
To avoid making useless projections that are extremely likely to come to pass we have added a variance limit. If the past 90 days of historical data varies too drastically, we will not attempt to project future values. You will see this on the charts as lines that don't extend beyond Now, and are noted in the 90th Day Projection column of the chart as Unpredictable Data.
Note
As of version 1.0.2, variance limits are disabled.
Receiving Events
Above we have covered several reasons why you won't see any data, or any projected data on the report and views. You may be wondering whether or not you will receive capacity events when these conditions exist.
The answer is that you will get events for current capacity threshold breaches in all of these situations. However, you will not receive events for projected breaches in the No Data, Insufficient Data, or Unpredictable Data cases.
Threshold Configuration
Most of the thresholds configuration fields such as datapoints, severity, and event class are the same as any type of threshold. So let's focus on what's different in a CapacityThreshold
Capacity-specific threshold configuration properties.
- Capacity Type
- Total Expression
- Used Expression
- Percent Threshold
Capacity Type
Capacity Type must be one of: cpu, memory, network, or storage. Each of these types has one specific native unit.
Native units by capacity type.
- cpu: percentage (0.0-100.0)
- memory: bytes (0+)
- network: bits per second (0+)
- storage: bytes (0+)
Used Expression
Used Expression is a Python expression that can use any datapoint selected in the DataPoints field, and any modeled properties on the resource (here) to return the current amount of used capacity in the capacity type's native unit.
Examples:
-
CPU (vSphere Host)
cpuUsage_cpuUsage * 0.01In this case we have to multiple vSphere's cpuUsage datapoint by 0.01 to convert it to the CPU capacity type's native unit of percentage. vSphere's cpuUsage datapoint will be 0 for completely idle, and 10,000 for completely busy.
-
Memory (Linux)
mem_MemUsedThis is the simplest possible example. The mem_MemUsed datapoint is already collected in the correct native units for the memory capacity type: bytes.
-
Network Interface (SNMP)
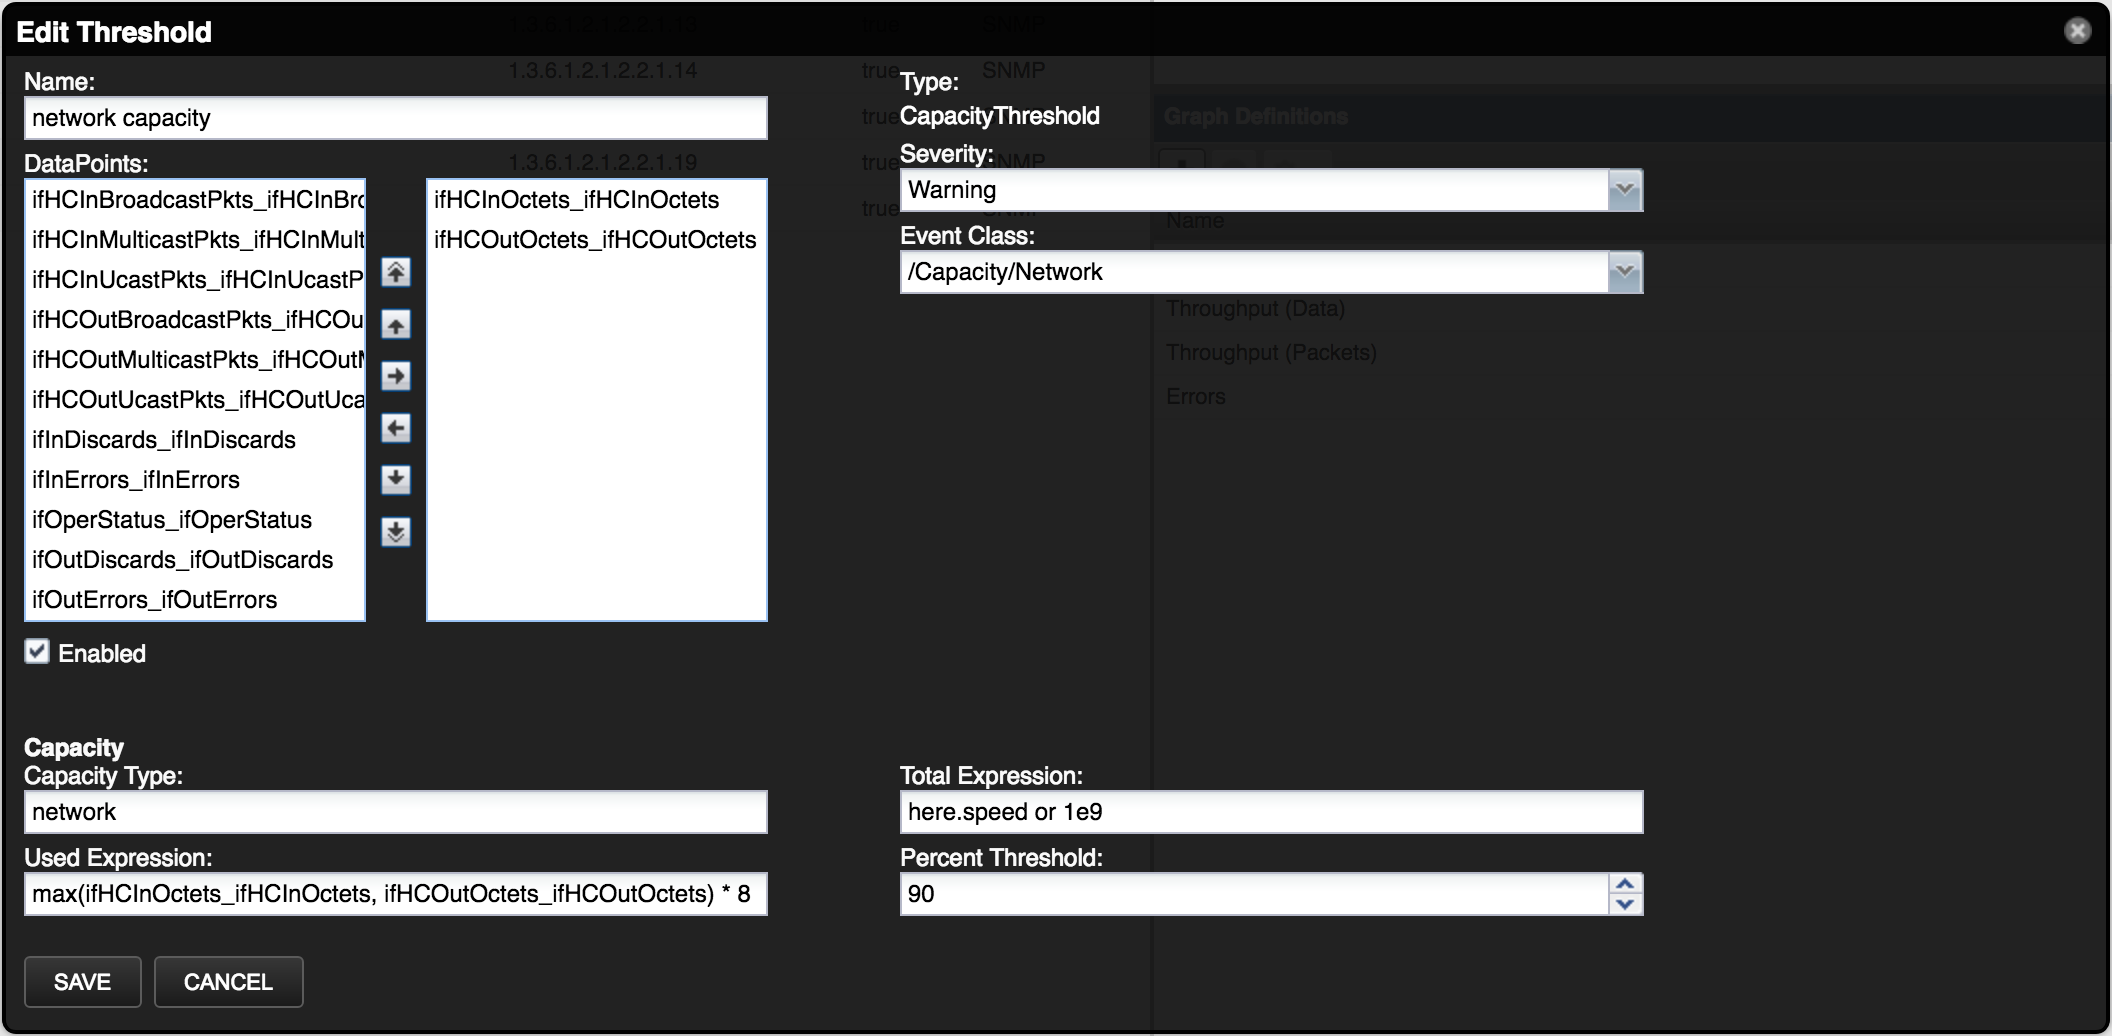
max(ifHCInOctets_ifHCInOctets, ifHCOutOctets_ifHCOutOctets) * 8We take the maximum of two datapoints because we're assuming a full-duplex interface that can receive and transmit simultaneously at up to the interface's maximum speed. We then multiply that maximum by 8 to convert it from the bytes/sec collected by those datapoints to the bits/sec required by the network capacity type's native unit.
-
Storage (EMC VNX File Storage Pool)
FileStoragePool_usedSize * 1048576We must multiply the FileStoragePool_usedSize datapoint value by 1,048,576 (1,024 * 1,024) to convert it from the collected megabytes units to bytes.
Total Expression
Total Expression is a Python expression that can use any datapoint selected in the DataPoints field, and any modeled properties on the resource (here) to return the current amount of total capacity in the capacity type's native unit.
Examples:
-
CPU (vSphere Host)
100A simple example that is almost always the case when it comes to CPU thresholds. Since CPU's native type is a 0-100 percentage, the total should always be 100.
-
Memory (Linux)
here.hw.totalMemoryServers have their total amount of memory modeled in the here.hw.totalMemory property. It's already in the proper native units: bytes. So we can use it directly as the total expression
-
Network Interface (SNMP)
here.speed or 1e9We use the modeled speed property of the interface which happens to already be in the correct units of bits/sec. For safety's sake we add or 1e9 to default to a 1Gbps value in cases where the interface doesn't have its speed property modeled.
-
Storage (EMC VNX File Storage Pool)
FileStoragePool_size * 1048576We must multiply the FileStoragePool_size datapoint value by 1,048,576 (1,024 * 1,024) to convert it from the collected megabytes units to bytes.
See Installed Thresholds for more examples of used and total expressions.
Percent Threshold
Percent Threshold is a percentage value between 0.0 and 100.0. When the result of Used Expression becomes more than this percent of the result of Total Expression, a threshold exceeded event will be created. This is the threshold used both for current and projected threshold breaches.
Projection Algorithm
Note
As of version 1.0.2, polynomial projections are disabled. Only linear trends are supported.
This ZenPack uses a custom projection algorithm both for projecting when capacity thresholds will be exceeded for eventing purposes, and for plotting the projected capacity usage on the Capacity Usage Report and Capacity Usage View
The projection algorithm used will vary for every datapoint in the system to which a capacity threshold is applied. Each datapoint's historical values will be analyzed to determine whether a linear or polynomial function best predicted historical values. That "best fit" algorithm will then be used to project future values.
An example of a case where a linear function will be used is storage capacity of a large storage pool that grows in a predictable fashion at around 100GB per day. A linear algorithm will project this 100GB per day growth to continue into the future.
A polynomial example would be a more realistic case where the same storage pool starts out growing at 100GB per day, but over time the growth accelerates until 150GB, 200GB, or 500GB are added per day. A properly fit polynomial algorithm will be able to take the acceleration of growth into account and project the capacity to be exceeded at a sooner, more accurate date.
The Capacity Usage Report - CPU screenshot above shows an example where the red line was best fit by a polynomial function, and all other lines were best fit by a linear function.
Note
A linear function will always be used when there are fewer than 12 days of history for a datapoint. This is because polynomial functions typically require more history to provide better projections. No projection will be attempted when there are fewer than 5 days of history for a datapoint.
Tuning
Zenoss systems with many capacity threshold instances may benefit from some specific tuning.
Increasing Service Instances
The Capacity service does almost all of its work once per day at just after UTC midnight. During this time the previous 90 days of history are queried, the index that allows the Capacity Usage report to work is built, and projected threshold exceeded events are sent.
If you see that this work is taking longer than desired, it can be expedited by increasing the number of instances for the Capacity service. Generally you should find that doubling the instances cuts processing time in half, doubles the CPU usage for the duration, and marginally increases the total memory usage of the Capacity service.
Increasing HBase Timeout
In some cases you may see OpenTSDB or HBase timeout warnings and errors in the Capacity service's logs, or potentially in the UI when viewing capacity reports and views. These can be avoided by configuring a longer HBase scanner timeout.
To configure a longer HBase scanner timeout, you must add the following
property to the /etc/hbase-site.xml configuration file of the
HMaster and RegionServer services.
<property>
    <name>hbase.client.scanner.timeout.period</name>
    <value>180000</value>
</property>
This raises the timeout to 3 minutes from its default value of 1 minute.
Limitations
This ZenPack has the following known limitations.
Maximum Threshold Instances
There is a maximum limit of approximately 1,048,576 capacity threshold instances in a single Zenoss system. A threshold instance is one configured threshold applied to one device or component.
As an example, let's say you have the following capacity thresholds configured.
- CPU & memory thresholds for Linux and Windows devices.
- Storage thresholds for Linux and Windows filesystems.
- Network thresholds for Linux and Windows network interfaces.
Now let's say that you have the following counts of these resources in your system.
- 5,000 Windows devices.
- 6,000 Linux devices.
- 4 filesystems per device.
- 2 network interfaces per device.
Now we do the math to figure out how many capacity thresholds instances this will be.
- 5,000 + 6,000 = 11,000 total devices
- 11,000 * 4 = 44,000 total filesystems
- 11,000 * 2 = 22,000 total network interfaces
- 11,000 * 2 = 22,000 total CPU and memory threshold instances
- 44,000 + 22,000 + 22,000 = 88,000 total threshold instances
When creating capacity thresholds it is most important to think about cases where they are applied to components. As you can see, increasing the number of filesystems from 4 to 20 per device would have a much larger impact on the total number of threshold instances than increasing the total devices from 11,000 to 55,000.
Note
The 1,048,576 limit is a function of the partitioning of capacity metrics in OpenTSDB, and OpenTSDB's configured tsd.query.filter.expansion_limit value. The Capacity ZenPack hard-codes the number of partitions to 256 for query performance reasons, and the default value of tsd.query.filter.expansion_limit is 4,096. If more than 1,048,576 capacity threshold instances are required, it is possible to increase the limit by increasing OpenTSDB's tsd.query.filter.expansion_limit value. Doubling the value doubles the limit. However, this will result in queries that will take OpenTSDB longer to process.
Troubleshooting
What can be done when something unexpected or undesirable happens?
Different Values
You may notice that values shown on the Capacity Usage report, Capacity Usage View, and in capacity threshold events don't seem to match what should be their corresponding values on the device and component graphs of CPU, memory, network throughput, or storage usage.
These discrepancies are typically the result of the aggregation, or "downsampling" performed by the Capacity ZenPack. All values shown on capacity charts, tables, or in projected capacity exceeded events have been "downsampled" into 24 hour buckets that begin at 00:00:00 UTC time, and end at 23:59:59 UTC time each day. For each one of these buckets of time, Capacity will track the average, minimum, and maximum value. This differs from the approach taken by the normal device and component graphs in Zenoss. Those graphs use varying periods for downsampling depending on how far you're zoomed in or out.
In general you should find that the values are roughly similar, and follow a shared shape and magnitude. It may seem strange, but it is likely the case that even though the values can be different, they're both correct.
It is recommended to use capacity management features primarily for longer-term planning when minute-by-minute changes in values are irrelevant, and drill down into the standard graphs when more precise information is required.
Installed Items
The following items will be installed by this ZenPack. Unless otherwise specified, these will also be removed from the system if the ZenPack is removed.
APIs
A capacity facade is added for internal Python access, and a corresponding CapacityRouter (capacity_router) endpoint is added for external access. Both make the following methods available.
- getCapacityData
- getCapacityDataForContext
- getConfigPreload
- getGroupLabelDict
- getLastUpdatedDate
Event Classes
This ZenPack installs the following event classes. None of the following event classes will be removed from the system if the ZenPack is removed.
- /Capacity
- /Capacity/CPU
- /Capacity/Memory
- /Capacity/Network
- /Capacity/Storage
Reports
This ZenPack installs the following reports.
- Capacity Planning / Capacity Usage: Top 10 capacity usage report.
Services
This ZenPack installs the following services.
- Capacity: Ranks resources by capacity usage. Sends projected capacity overage events. This is a central service of which there will only be one.
Thresholds
This ZenPack installs some, or all, of the following thresholds depending on whether or not the associated ZenPack is also installed on the system. This is done to kick-start your ability to do capacity management without having to wait for future versions of the associated ZenPacks to come with their own capacity thresholds pre-configured.
All of these thresholds are of the CapacityThreshold type, and have their Percent Threshold set to 90.
- Cisco Port Channels
- Threshold: network capacity
- Template: PortChannel
- Device Class: /Network/Cisco
- Datapoints: ifHCInOctets_ifHCInOctets, ifHCOutOctets_ifHCOutOctets
- Total Expression:
here.speed or 1e9 - Used Expression:
max(ifHCInOctets_ifHCInOctets, ifHCOutOctets_ifHCOutOctets) * 8 - Threshold: network capacity
- Template: PortChannel
- Device Class: /Network/Cisco/Nexus/9000
- Datapoints: interface_eth_inbytes, interface_eth_outbytes
- Total Expression:
here.speed or 1e9 - Used Expression:
max(interface_eth_inbytes, interface_eth_outbytes) * 8
- Cisco UCS Fabric Ethernet LAN Port Channels
- Threshold: network capacity
- Template: UCSFabricEthLanPc
- Device Class: /CiscoUCS
- Datapoints: etherRxStats_totalBytes, etherTxStats_totalBytes
- Total Expression:
int(here.operSpeed or 0) or 1e10 - Used Expression:
max(etherRxStats_totalBytes, etherTxStats_totalBytes) * 8
- Cisco UCS Fabric FC SAN Port Channels
- Threshold: network capacity
- Template: UCSFabricFcSanPc
- Device Class: /CiscoUCS
- Datapoints: fcStats_bytesRx, fcStats_bytesTx
- Total Expression:
int(here.operSpeed or 0) or 1e10 - Used Expression:
max(fcStats_bytesRx, fcStats_bytesTx) * 8
- VMware vSphere Hosts
- Threshold: CPU capacity
- Template: Host
- Device Class: /vSphere
- Datapoints: cpuUsage_cpuUsage
- Total Expression:
100 - Used Expression:
cpuUsage_cpuUsage * 0.01 - Threshold: memory capacity
- Template: Host
- Device Class: /vSphere
- Datapoints: memConsumed_memConsumed
- Total Expression:
here.totalMemory - Used Expression:
memConsumed_memConsumed * 1024
- VMware vSphere pNICs
- Threshold: network capacity
- Template: pNIC
- Device Class: /vSphere
- Datapoints: nicRx_nicRx, nicTx_nicTx
- Total Expression:
(here.linkSpeed or 1000) * 1000000 - Used Expression:
max(nicRx_nicRx, nicTx_nicTx) * 8192
- VMware vSphere Datastores
- Threshold: storage capacity
- Template: Datastore
- Device Class: /vSphere
- Datapoints: datastoreUsed_datastoreUsed
- Total Expression:
here.capacity - Used Expression:
datastoreUsed_datastoreUsed
- VMware vSphere Clusters
- Threshold: CPU capacity
- Template: Cluster
- Device Class: /vSphere
- Datapoints: cpuUsage_cpuUsage
- Total Expression:
100 - Used Expression:
cpuUsage_cpuUsage * 0.01 - Threshold: memory capacity
- Template: Cluster
- Device Class: /vSphere
- Datapoints: memConsumed_memConsumed
- Total Expression:
here.effectiveMemory - Used Expression:
memConsumed_memConsumed * 1024
- NetApp C-Mode Aggregates
- Threshold: storage capacity
- Template: NetAppAggregate
- Device Class: /Storage/NetApp/C-Mode
- Datapoints: usedBlocks_sizeUsed
- Total Expression:
here.size_total - Used Expression:
usedBlocks_sizeUsed
- NetApp C-Mode Volumes
- Threshold: storage capacity
- Template: FileSystem_Volume
- Device Class: /Storage/NetApp/C-Mode
- Datapoints: usedBlocks_sizeUsed
- Total Expression:
here.totalBytes() - Used Expression:
usedBlocks_sizeUsed - Threshold: storage capacity
- Template: NetAppVolume
- Device Class: /Storage/NetApp/C-Mode
- Datapoints: usedBlocks_sizeUsed
- Total Expression:
here.size_total - Used Expression:
usedBlocks_sizeUsed
- NetApp C-Mode System Nodes
- Threshold: CPU capacity
- Template: NetAppSystemNode
- Device Class: /Storage/NetApp/C-Mode
- Datapoints: cpuUtilization_Busy
- Total Expression:
100 - Used Expression:
cpuUtilization_Busy
- NetApp C-Mode Network Interfaces
- Threshold: network capacity
- Template: ethernetCsmacd
- Device Class: /Storage/NetApp/C-Mode
- Datapoints: ifNet_ifInOctets, ifNet_ifOutOctets
- Total Expression:
here.speed or 1e9 - Used Expression:
max(ifNet_ifInOctets, ifNet_ifOutOctets) * 8 - Threshold: network capacity
- Template: NetApp_ethernetCsmacd
- Device Class: /Storage/NetApp/C-Mode
- Datapoints: ifNet_ifInOctets, ifNet_ifOutOctets
- Total Expression:
here.speed or 1e9 - Used Expression:
max(ifNet_ifInOctets, ifNet_ifOutOctets) * 8
- NetApp 7-Mode Aggregates
- Threshold: storage capacity
- Template: NetAppAggregate
- Device Class: /Storage/NetApp/7-Mode
- Datapoints: usedBlocks_sizeUsed
- Total Expression:
here.size_total - Used Expression:
usedBlocks_sizeUsed
- NetApp 7-Mode Volumes
- Threshold: storage capacity
- Template: FileSystem_Volume
- Device Class: /Storage/NetApp/7-Mode
- Datapoints: usedBlocks_sizeUsed
- Total Expression:
here.totalBytes() - Used Expression:
usedBlocks_sizeUsed - Threshold: storage capacity
- Template: NetAppVolume
- Device Class: /Storage/NetApp/7-Mode
- Datapoints: usedBlocks_sizeUsed
- Total Expression:
here.size_total - Used Expression:
usedBlocks_sizeUsed
- NetApp 7-Mode Network Interfaces
- Threshold: network capacity
- Template: ethernetCsmacd
- Device Class: /Storage/NetApp/7-Mode
- Datapoints: ifNet_ifInOctets, ifNet_ifOutOctets
- Total Expression:
here.speed or 1e9 - Used Expression:
max(ifNet_ifInOctets, ifNet_ifOutOctets) * 8
- EMC VMAX Array
- Threshold: storage capacity
- Template: Array
- Device Class: /Storage/EMC/VMAX
- Datapoints: PrimordialStoragePool_TotalManagedSpace, PrimordialStoragePool_RemainingManagedSpace
- Total Expression:
PrimordialStoragePool_TotalManagedSpace - Used Expression:
PrimordialStoragePool_TotalManagedSpace - PrimordialStoragePool_RemainingManagedSpacee
- EMC VMAX DeviceStoragePool
- Threshold: storage capacity
- Template: DeviceStoragePool
- Device Class: /Storage/EMC/VMAX
- Datapoints: DeviceStoragePool_TotalManagedSpace, DeviceStoragePool_RemainingManagedSpace
- Total Expression:
DeviceStoragePool_TotalManagedSpace - Used Expression:
DeviceStoragePool_TotalManagedSpace - DeviceStoragePool_RemainingManagedSpacee
- EMC VNX/VMAX Unified Storage Pools
- Threshold: storage capacity
- Template: UnifiedStoragePool
- Device Class: /Storage/EMC
- Datapoints: UnifiedStoragePool_RemainingManagedSpace
- Total Expression:
int(here.totalManagedSpace) - Used Expression:
int(here.totalManagedSpace) - UnifiedStoragePool_RemainingManagedSpace
- EMC VMAX VirtualProvisioningPool
- Threshold: storage capacity
- Template: VirtualProvisioningPool
- Device Class: /Storage/EMC/VMAX
- Datapoints: VirtualProvisioningPool_TotalManagedSpace, VirtualProvisioningPool_RemainingManagedSpace
- Total Expression:
VirtualProvisioningPool_TotalManagedSpace - Used Expression:
VirtualProvisioningPool_TotalManagedSpace - VirtualProvisioningPool_RemainingManagedSpacee
- EMC VNX Array
- Threshold: storage capacity
- Template: Array
- Device Class: /Storage/EMC/VNX
- Datapoints: PrimordialStoragePool_TotalManagedSpace, PrimordialStoragePool_RemainingManagedSpace
- Total Expression:
PrimordialStoragePool_TotalManagedSpace - Used Expression:
PrimordialStoragePool_TotalManagedSpace - PrimordialStoragePool_RemainingManagedSpacee
- EMC VNX DeviceStoragePool
- Threshold: storage capacity
- Template: DeviceStoragePool
- Device Class: /Storage/EMC
- Datapoints: DeviceStoragePool_TotalManagedSpace, DeviceStoragePool_RemainingManagedSpace
- Total Expression:
DeviceStoragePool_TotalManagedSpace - Used Expression:
DeviceStoragePool_TotalManagedSpace - DeviceStoragePool_RemainingManagedSpacee
- EMC VNX VirtualProvisioningPool
- Threshold: storage capacity
- Template: VirtualProvisioningPool
- Device Class: /Storage/EMC
- Datapoints: VirtualProvisioningPool_TotalManagedSpace, VirtualProvisioningPool_RemainingManagedSpace
- Total Expression:
VirtualProvisioningPool_TotalManagedSpace - Used Expression:
VirtualProvisioningPool_TotalManagedSpace - VirtualProvisioningPool_RemainingManagedSpacee
- EMC VNX File Storage Pools
- Threshold: storage capacity
- Template: StoragePool
- Device Class: /Storage/EMC/VNXFile
- Datapoints: FileStoragePool_size, FileStoragePool_usedSize
- Total Expression:
FileStoragePool_size * 1048576 - Used Expression:
FileStoragePool_usedSize * 1048576
Threshold Types
This ZenPack installs the following threshold types.
- CapacityThreshold: Tags datapoints as capacity-related, and creates current and projected capacity overage events.
Changes
1.0.7
- Add Zenoss service CPU commitment. (ZEN-34995)
- Fix MariaDB connectivity healthcheck. (ZPS-9135)
- Tested with Zenoss Resource Manager 6.8.0 and Zenoss Cloud.
1.0.6
- Bump QuickVis lib version to 0.3.3. (ZPS-8274)
- Fix flare message appears while working with Capacity Usage report. (ZPS-7411)
- Tested with Zenoss Resource Manager 6.7.0 and Zenoss Cloud.
1.0.5
- Fixing tracebacks when threshold exists with no datapoints assigned to it (ZPS-5977)
- Tested with Zenoss Resource Manager 6.4.1 and Zenoss Cloud.
1.0.4
- Prevent forwarding of internal capacity metrics to Zenoss Cloud. (ZPS-4337)
- Fix exception seen with some invalid capacity threshold configurations. (ZPS-4561)
- Tested with Zenoss Resource Manager 5.3.3, 6.2.0, and Zenoss Cloud.
1.0.3
- Fix events generated by disabled thresholds. (ZPS-3873)
- Fix events generated by decommissioned devices. (ZPS-3872)
- Update UI for Collection Zone. (ZPS-3897)
- Disabled Capacity title bar links when page is loading. (ZPS-4156)
- Tested with Zenoss Resource Manager 5.3.3, 6.2.0 and Zenoss Cloud.
1.0.2
- Fix errors when "Percent Threshold" is not set. (ZPS-2729)
- Smaller OpenTSDB queries to lighten load on HBase. (ZPS-3240)
- Make "max-subqueries" configurable for Capacity service.
- Make "query-timeout" configurable for Capacity service.
- Fix FireFox UI graph glitches and offset. (ZPS-3148)
- Disable variance limits and remove polynomial projections. (ZPS-3146)
- Add storage capacity thresholds for EMC datapoints. (ZPS-3152)
1.0.1
- Fix conflict with RMMonitor ZenPack. (ZPS-3005)
- Fix documentation of threshold's default event class. (ZPS-2988)
- Limit capacity type to static drop down options. (ZPS-2986)
- Fix "Last Updated" timestamp to appropriately show localtime. (ZPS-3006)
- Fix UI broken grid and broken breach timestamps. (ZPS-3269, ZPS-3270)
1.0.0
- Initial release.