NetApp Monitor
ZenPacks.zenoss.NetAppMonitor
NetAppMonitor provides additional modeling and monitoring for NetApp devices. NFS, CIFS and HTTP operations per second are collected, as well as file system and snapshot utilization information. Hardware model and operating system revision asset information is modeled.
The NetApp ZenPack uses reports provided by the StorageBase ZenPack.
The features added by this ZenPack can be summarized as follows. They are each detailed further below.
- Native NetApp ZAPI protocols or SNMP protocols
- Monitoring of performance component metrics
- Optional service impact with an addition of Zenoss Service Dynamic product
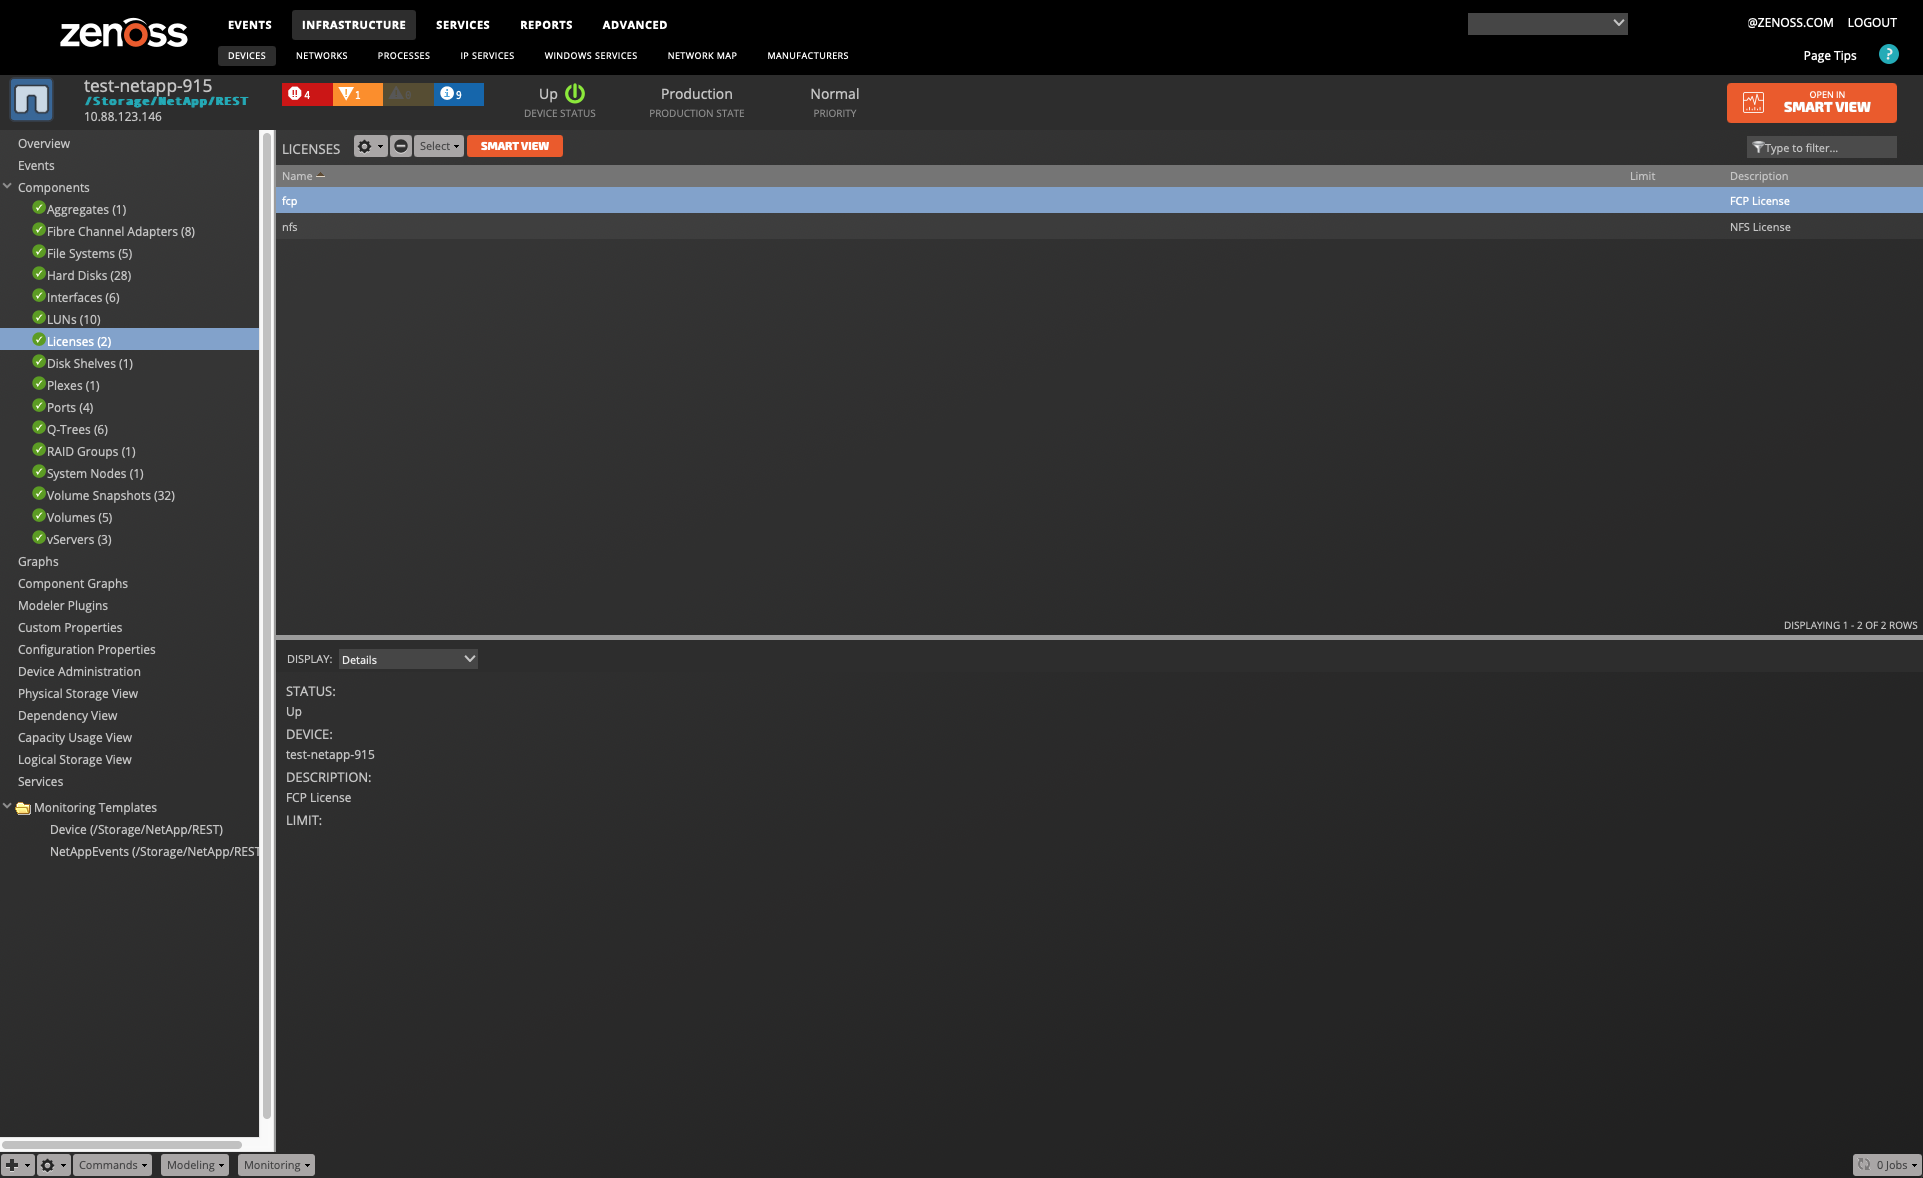
- Status monitoring of "vServers", "Volumes", "LUNs", "Hard Disks" and "Disk Shelves" components
- Monitoring events of OnCommand Unified Manager.
Applications Monitored: NetApp (ONTAP 8, ONTAP 9)
Commercial
This ZenPack is developed and supported by Zenoss Inc. Commercial ZenPacks are available to Zenoss commercial customers only. Contact Zenoss to request more information regarding this or any other ZenPacks. Click here to view all available Zenoss Commercial ZenPacks.
Support
This ZenPack is included with commercial versions of Zenoss and enterprise support for this ZenPack is provided to Zenoss customers with an active subscription.
Releases
Version 5.0.2 - Download
- Released on 2026/04/01
- Requires PythonCollector ZenPack (>=1.8.0), StorageBase ZenPack (>=1.4.3), CalculatedPerformance ZenPack, ZenPackLib ZenPack (>=2.1)
- Compatible with Virtana Service Observability (formerly Zenoss Cloud) and Virtana Resource Manager 6.x
Version 5.0.1 - Download
- Released on 2025/07/15
- Requires PythonCollector ZenPack (>=1.8.0), StorageBase ZenPack (>=1.4.3), CalculatedPerformance ZenPack, ZenPackLib ZenPack (>=2.1)
- Compatible with Virtana Service Observability (formerly Zenoss Cloud) and Virtana Resource Manager 6.x
Gallery

Usage
Prerequisites
Verify that you have the following prerequisites before installing and using this ZenPack.
Zenoss Prerequisites
- Zenoss >= 6.2
- ZenPacks.zenoss.StorageBase >= 1.4.3
- ZenPacks.zenoss.PythonCollector >= 1.8.0
- ZenPacks.zenoss.CalculatedPerformance
- ZenPacks.zenoss.ZenPackLib >= 2.1
Installing or updating NetApp ZenPack may require the StorageBase ZenPack to be updated too. Each of these will require Zenoss to update the index and may take up to several hours depending on the number of objects related to these ZenPacks.
NetApp Prerequisites
- ONTAP 8.0 or higher for ZAPI support.
- ONTAP 9.6 or higher for REST API support. REST API support is available only for C-Mode clusters.
- SNMP is provided for older Filers.
- NetApp user used by Zenoss should be associated with the default
"admin" or "root" user group or has at least following access
settings:
- 7-Mode: allowed capabilities for user should include:
api-*andlogin-http-admin - C-Mode: login methods should include
Application:ontapi, Authentication:password, Role:readonly - REST API (C-Mode): Login methods must include
-application http,-authmethod password,-role readonly
- 7-Mode: allowed capabilities for user should include:
- QTree utilization can only be monitored for QTrees with quotas enabled.
Protocols
NetApp ONTAP REST API-Based Monitoring:
- Place the device in the */Storage/NetApp/REST* device class to enable REST API monitoring for a NetApp C-Mode appliance.
NetApp ONTAP ZAPI-Based Monitoring:
- For ZAPI-based monitoring, place the device in:
- */Storage/NetApp/7-Mode*
- */Storage/NetApp/C-Mode*
Legacy SNMP Monitoring:
- For legacy SNMP-based monitoring, place the device in */Storage/NetApp/SNMP*.
Asset information:
- Hardware Model
- Operating System Revision
Device metrics:
-
REST API-Based C-Mode Metrics:
- CPU Utilization: % Busy
- Network Traffic: Sent and Received (bits/sec)
- Operations/Second: NFS, CIFS, ISCSI, and HTTP
- Fibre Channel Traffic: Bytes Read and Write
- iSCSI Traffic: Bytes Read and Write
- CIFS Traffic: Bytes Read and Write
- Disk Inventory Count: Active, Failed, Prefailed, Spare
- Disk Maintenance Count: Reconstructing, Reconstructing Parity, Scrubbing, Verifying Parity
-
ZAPI-based 7-Mode Device metrics:
- CPU Utilization %: Busy
- Network bits/sec: Sent and Received
- Operations/sec: NFS, CIFS, ISCSI and HTTP
- Fibre Channel Traffic bytes: Read and Write
- iSCSI Traffic bytes: Read and Write
- CIFS Traffic bytes: Read and Write
- NFS Cache Traffic bytes: from Clients, from Servers, to Clients, to Servers
- NFS Cache Operations requests: ejected, hit, missed, total, verified
- Disk Inventory count: Active, Failed, Prefailed, Spare
- Disk Maintenance count: Reconstructing, Reconstructing Parity, Scrubbing, Verifying Parity
- NFSv3 calls/sec: Accesses, Creates, Getattrs, Links, Lookups, Mkdirs, Nulls, ReadDirs, ReadDirPluss, Removes, Renames, Symlinks
- NFSv3 Common Operations calls/sec: Read and Write
-
ZAPI-based C-Mode Device metrics:
- Disk Inventory count: Active, Failed, Prefailed, Spare
- Disk Maintenance count: Reconstructing, Reconstructing Parity, Scrubbing, Verifying Parity
7-Mode and C-Mode ZAPI/REST API modeled components:
-
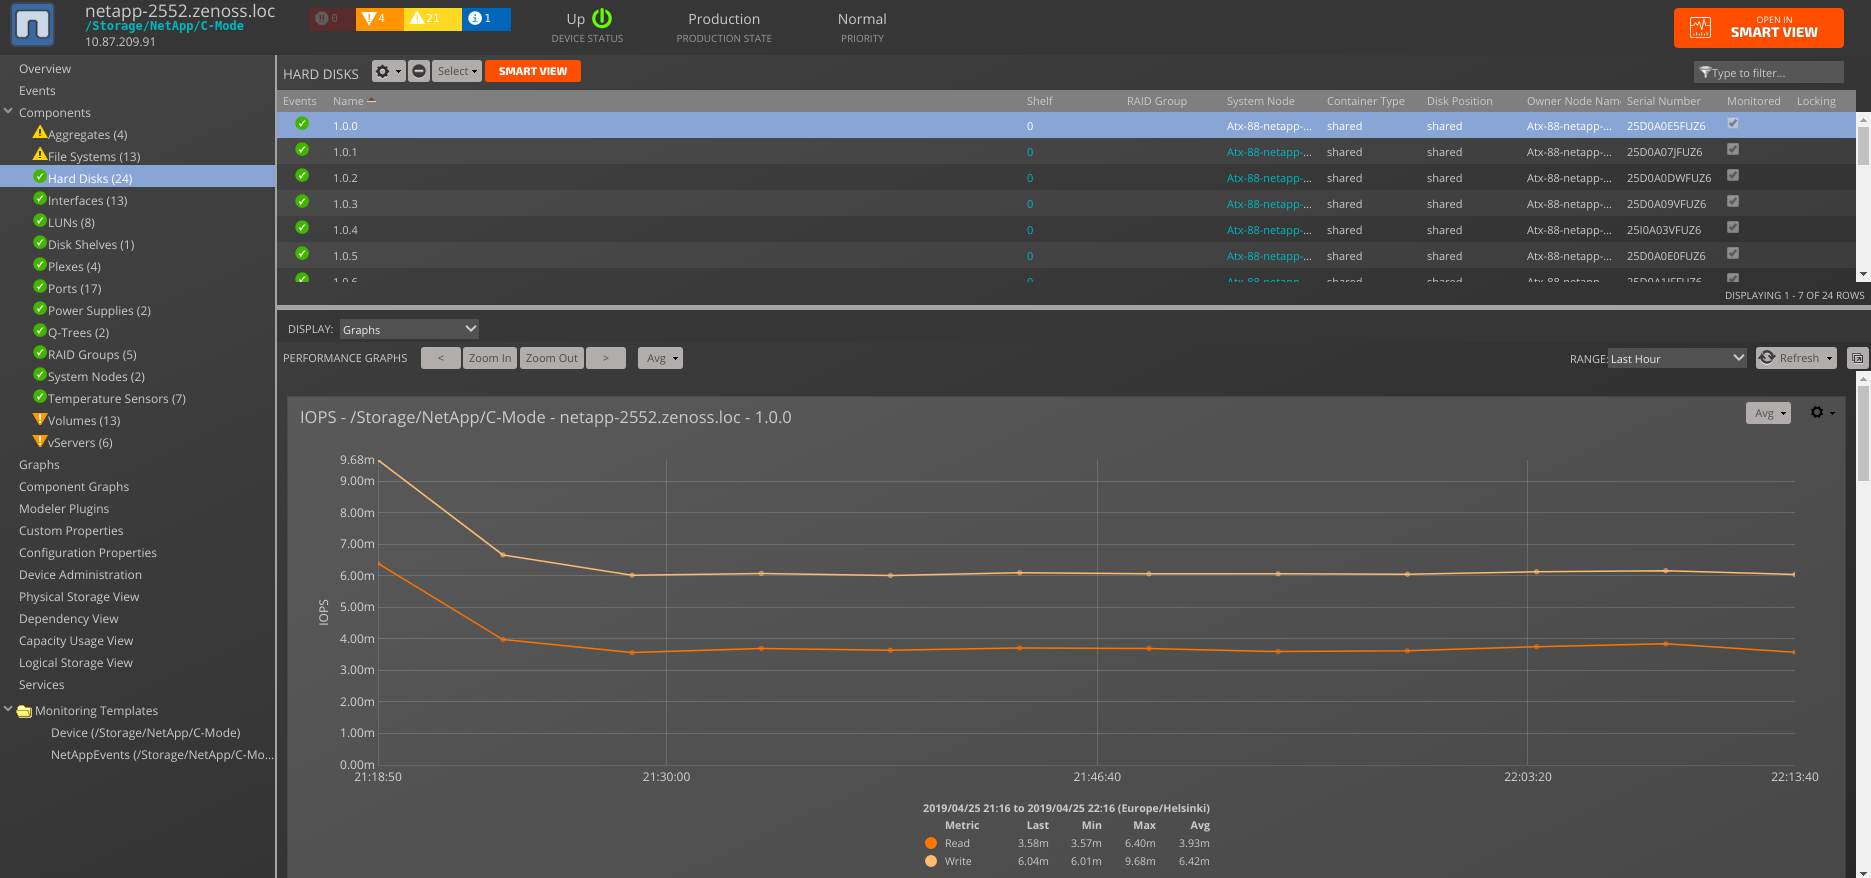
Disks
- Monitoring Templates
- NetAppHardDisk
- Data Points
- disk.base_for_disk_busy
- disk.cp_read_blocks
- disk.cp_read_chain
- disk.cp_read_latency
- disk.cp_reads
- disk.disk_busy
- disk.disk_capacity
- disk.io_pending
- disk.io_queued
- disk.total_transfers
- disk.user_reads
- disk.user_writes
- disk.guaranteed_reads
- disk.guaranteed_writes
- disk_busy_pct.disk_busy_pct
- Thresholds
- 90 percent disk busy
- 90 percent disk used
- Graphs
- IO (io_pending, io_queued)
- IOPS (user_reads, user_writes)
- Transfers (total_transfers)
- Busy (disk_busy)
- Capacity (disk_capacity)
- Monitoring Templates
-
Volumes (7-Mode)
- Monitoring Templates
- NetAppVolume
- Data Points
- usedBlocks.dskPercent
- usedBlocks.volTotalPercent
- usedBlocks.inodeUsedPercent
- usedBlocks.sizeUsed
- usedBlocks.sizeAvailable
- usedBlocks.sizeTotal
- usedBlocks.volumeSize
- usedBlocks.snpshRsvSize
- usedBlocks.filesTotal
- volume.asynchronous_frees
- Status.state
- Thresholds
- 90 percent used
- Graphs
- Usage (dskPercent, inodeUsedPercent)
- Monitoring Templates
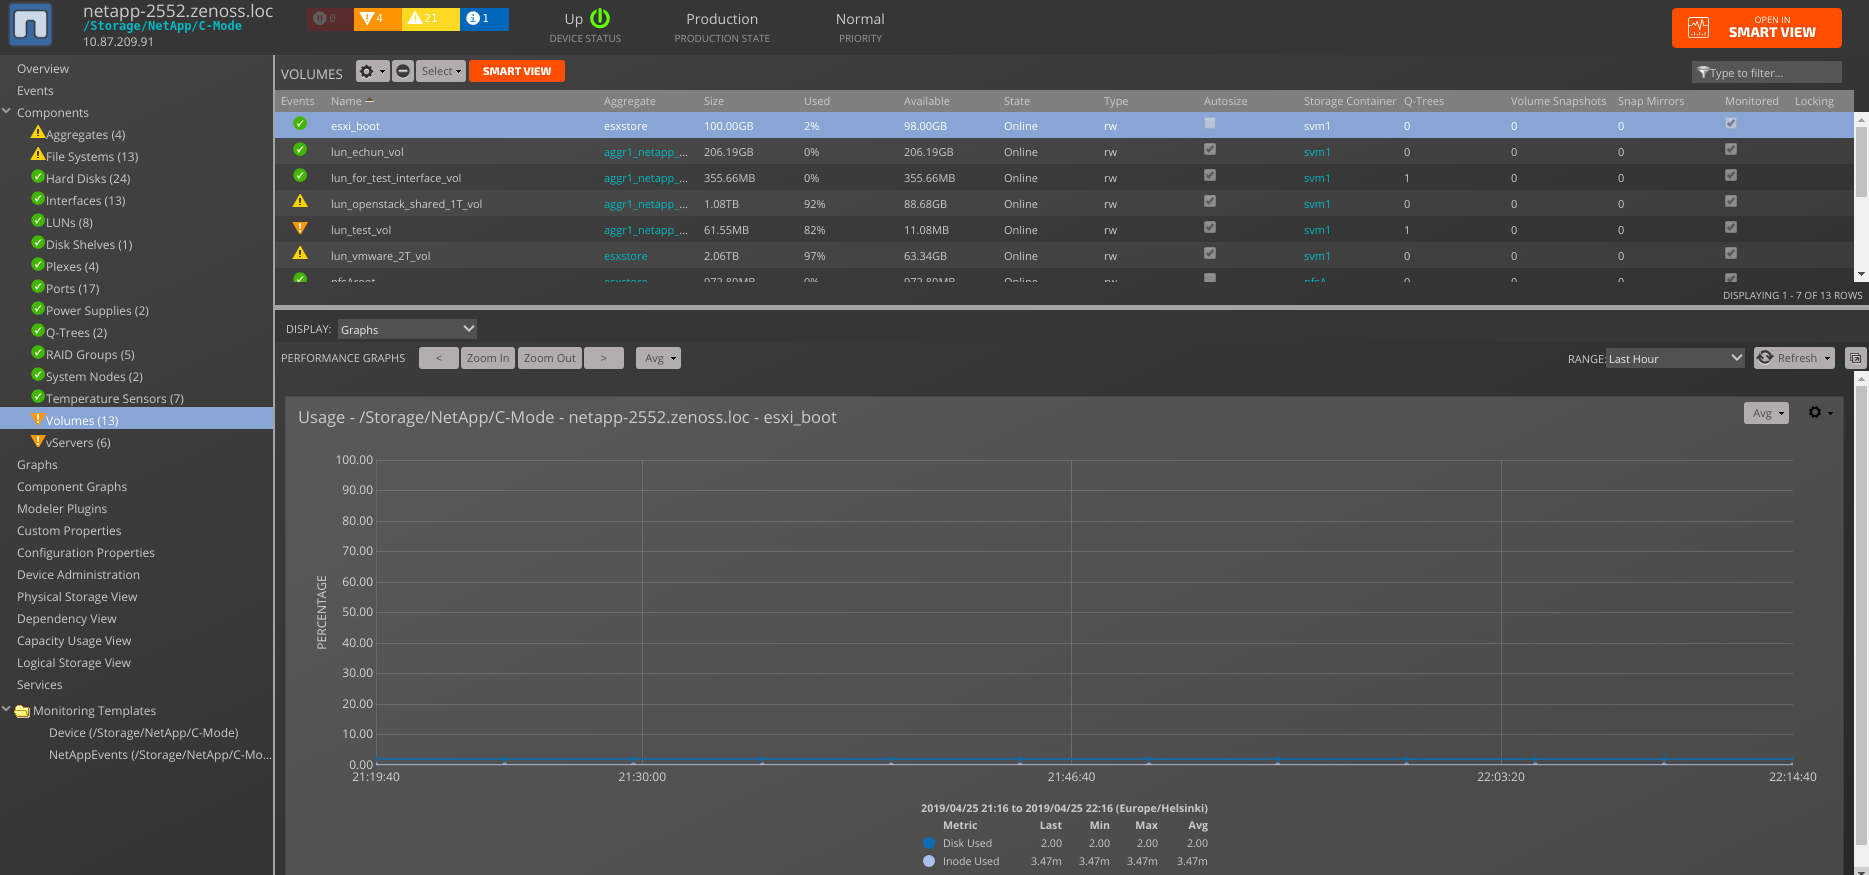
- Volumes (ZAPI C-Mode/REST API-based C-Mode)
- Monitoring Templates
- NetAppVolume
- Data Points
- usedBlocks.dskPercent
- usedBlocks.dataPercent
- usedBlocks.volTotalPercent
- usedBlocks.inodeUsedPercent
- usedBlocks.sizeUsed
- usedBlocks.sizeAvailable
- usedBlocks.sizeAvailableForSnapshots
- usedBlocks.filesTotal
- usedBlocks.sizeTotal
- usedBlocks.volumeSize
- usedBlocks.snpshRsvSize
- usedBlocks.snpshRsvUsedPct
- volume.asynchronous_frees (absent for REST API-based C-Mode)
- Status.state
- Thresholds
- 90 percent data sector used
- 90 percent used
- 100 snapshot reserve used
- Graphs
- Usage (dataPercent, volTotalPercent, inodeUsedPercent)
- Snapshot Reserve Usage (snpshRsvUsedPct)
- Monitoring Templates
Note: Root Volumes won't be discovered and monitored for REST API-based C-Mode target devices due to REST API restriction.
-
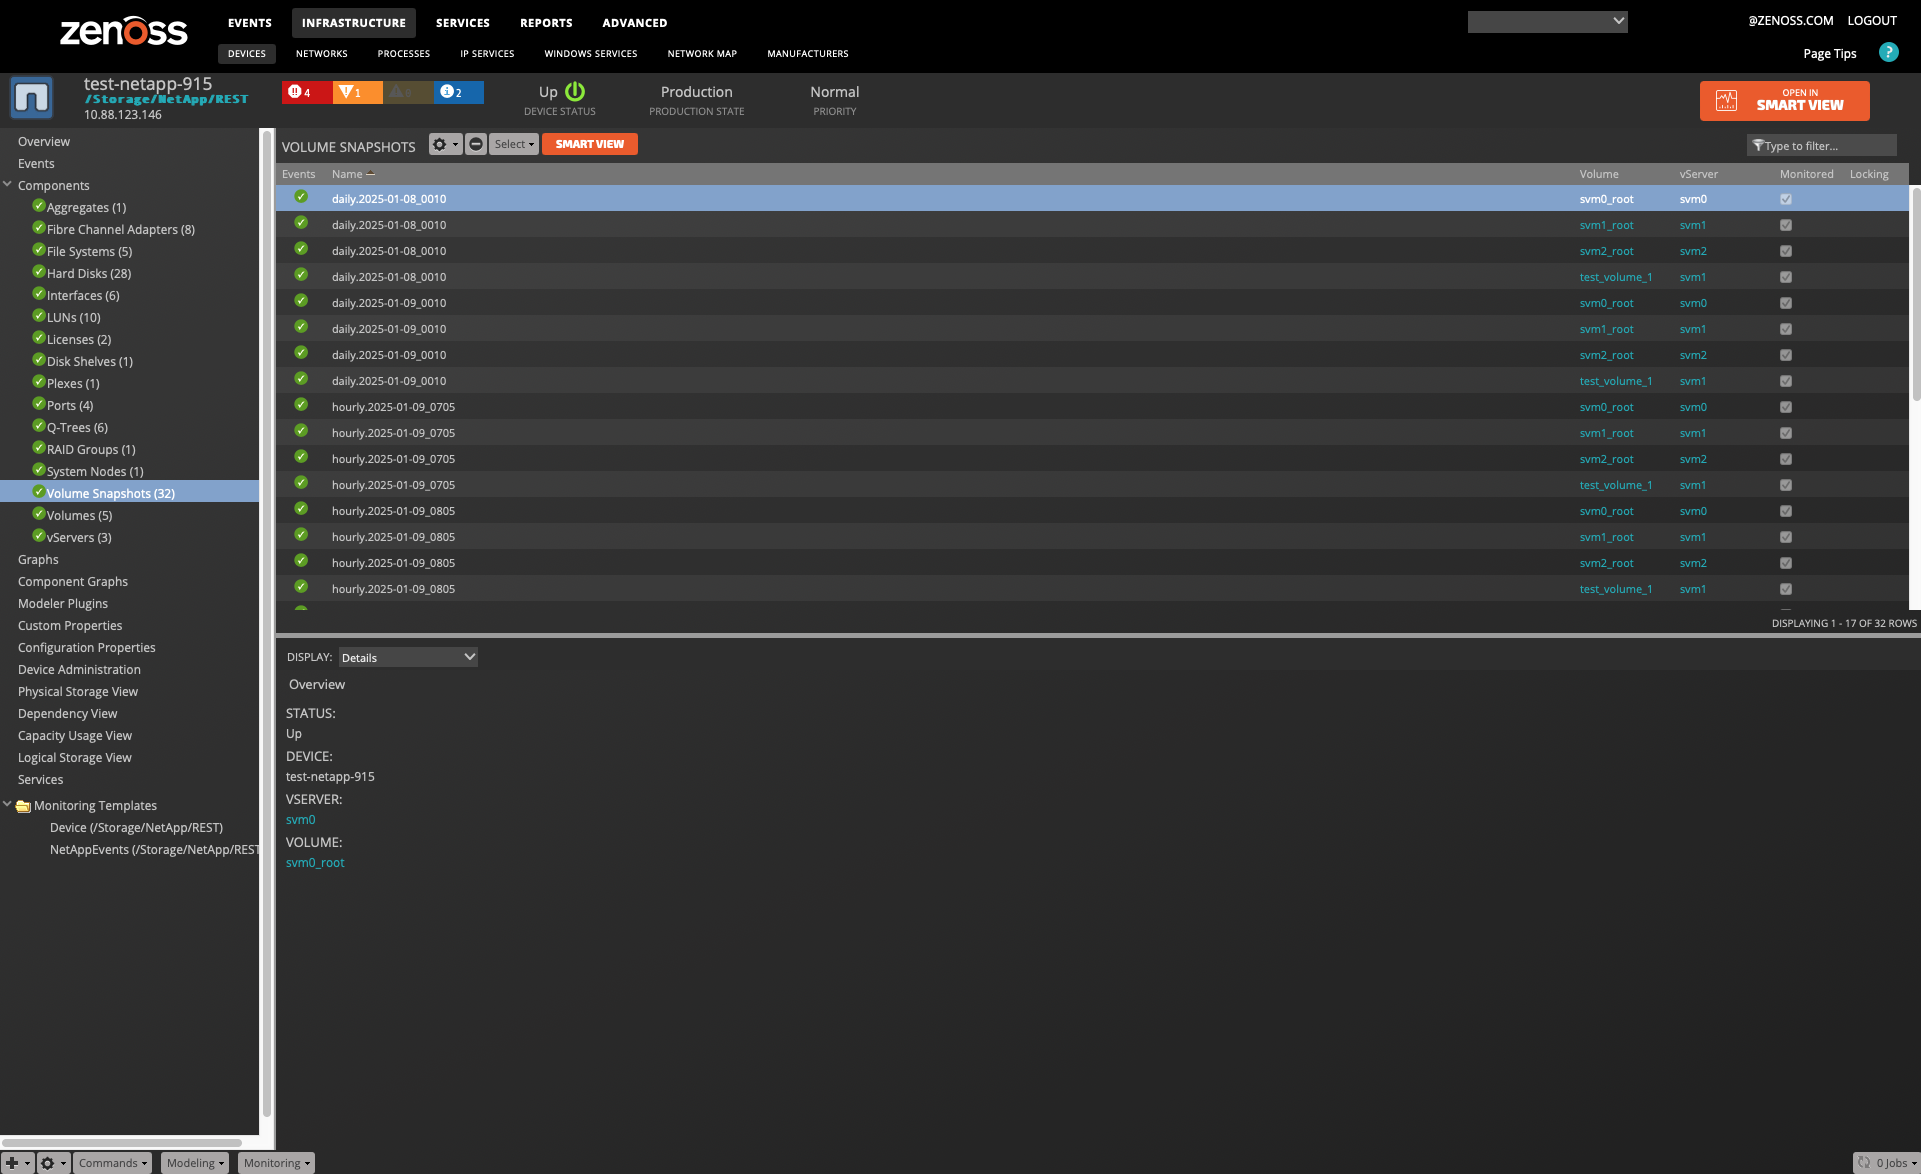
Volume Snapshots
- Monitoring Templates
- NetAppVolumeSnapshot
- Data Points
- snapshot.cumulative_percentage_of_total_blocks
- Thresholds
- None
- Graphs
- None
- Monitoring Templates
-
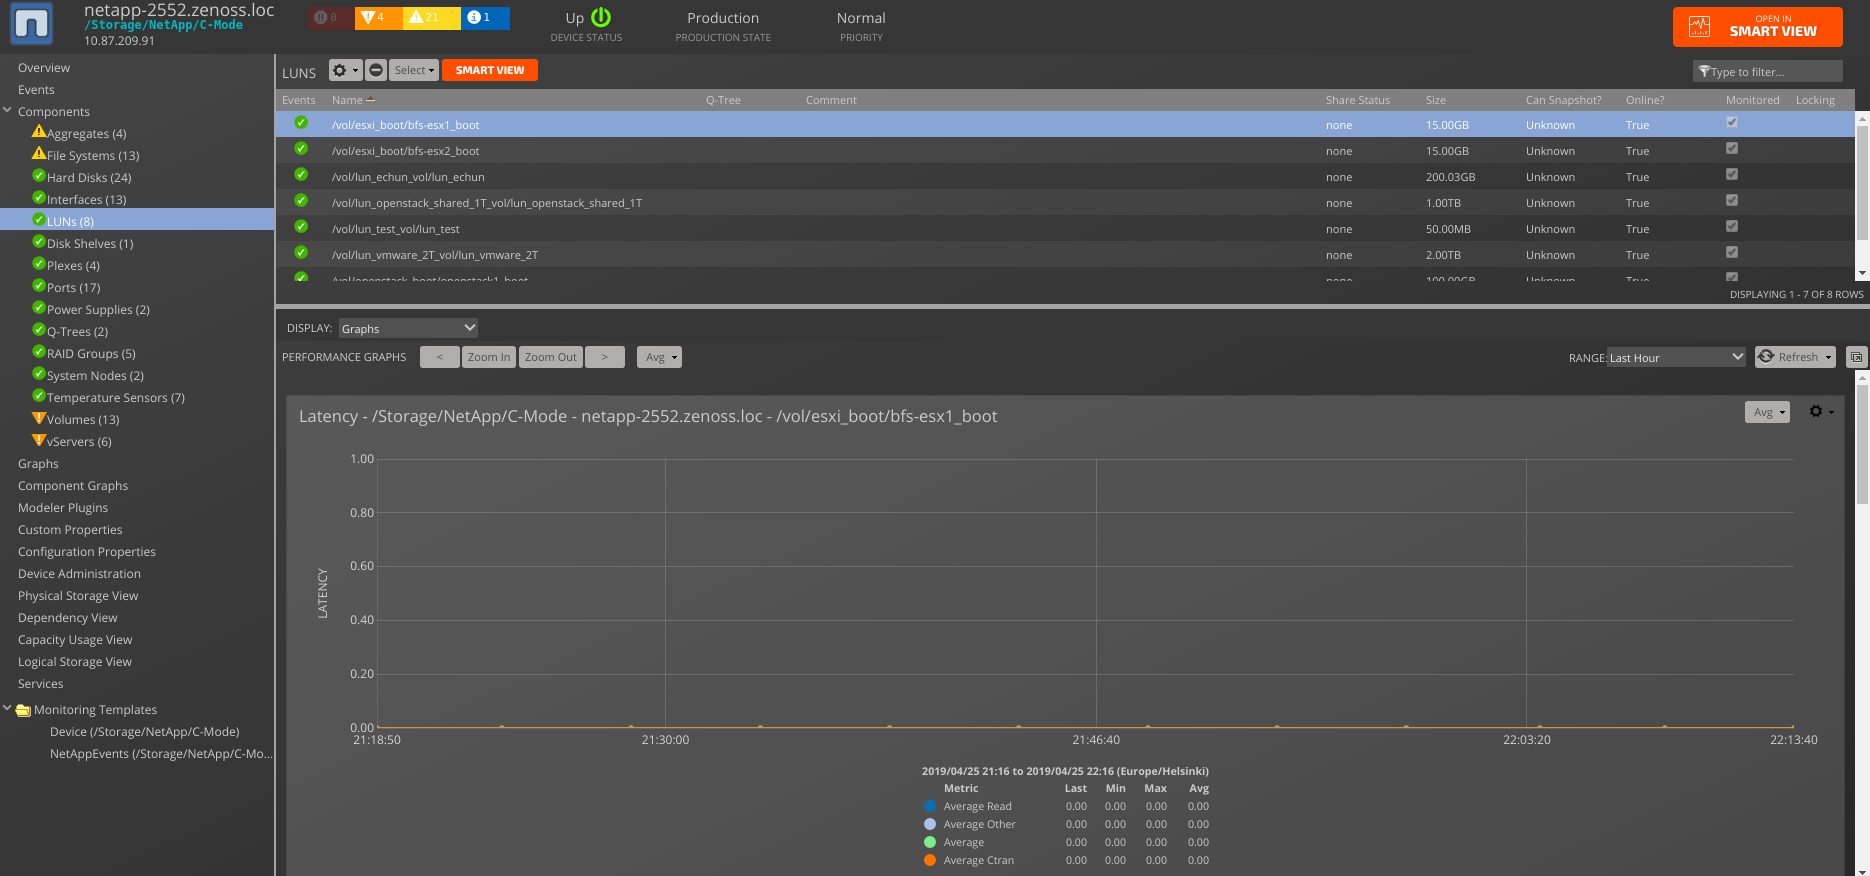
Luns
- Monitoring Templates
- NetAppLun
- Data Points
- lun.avg_latency
- lun.avg_other_latency
- lun.avg_read_latency
- lun.other_ops
- lun.queue_depth_lun
- lun.queue_full
- lun.read_data
- lun.read_ops
- lun.read_partial_blocks
- lun.total_ops
- lun.write_data
- lun.write_ops
- lun.write_partial_blocks
- Status.online
- Status.size
- Data Points (ZAPI C-Mode)
- lun.avg_ctran_latency
- lun.scsi_abort
- lun.scsi_good
- lun.remote_ops
- lun.remote_bytes
- lun.queue_full
- lun.cp_read_blocks
- lun.wafl_read_errors
- lun.wafl_write_errors
- lun.readBytes
- lun.readOps
- lun.writeBytes
- lun.writeOps
- lun.writeOps
- Data Points REST API-based C-Mode
- lun.write_partial_blocks
- lun.writeOps
- lun.writeBytes
- lun.remote_bytes
- lun.readOps
- lun.remote_ops
- lun.avg_read_latency
- lun.avg_write_latency
- lun.avg_xcopy_latency
- lun.remoteOps
- Thresholds
- None
- Graphs
- Bytes Per Cycle (write_data, read_data)
- Latency (avg_latency, avg_other_latency/avg_xcopy_latency avg_read_latency)
- Operations Per Cycle (other_ops/remote_ops, write_ops, read_ops)
- Partial Blocks (write_partial_blocks, read_partial_blocks)
- Monitoring Templates
-
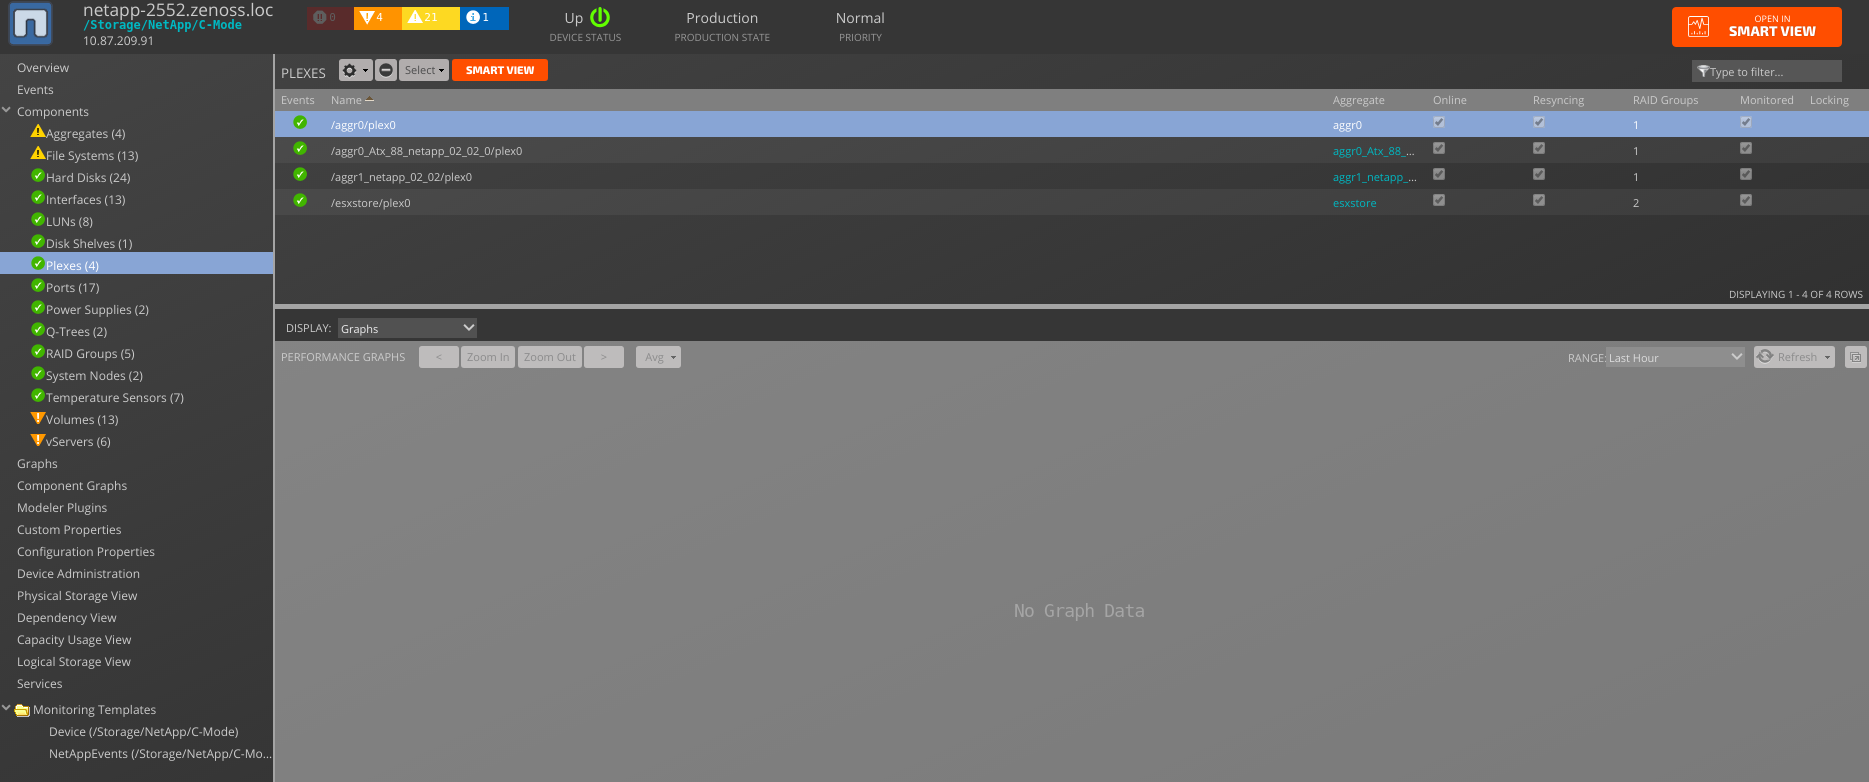
Plexes
- Monitoring Templates
- NetAppPlex
- Data Points
- plex.online
- plex.resyncing
- Thresholds
- None
- Graphs
- None
- Monitoring Templates
-
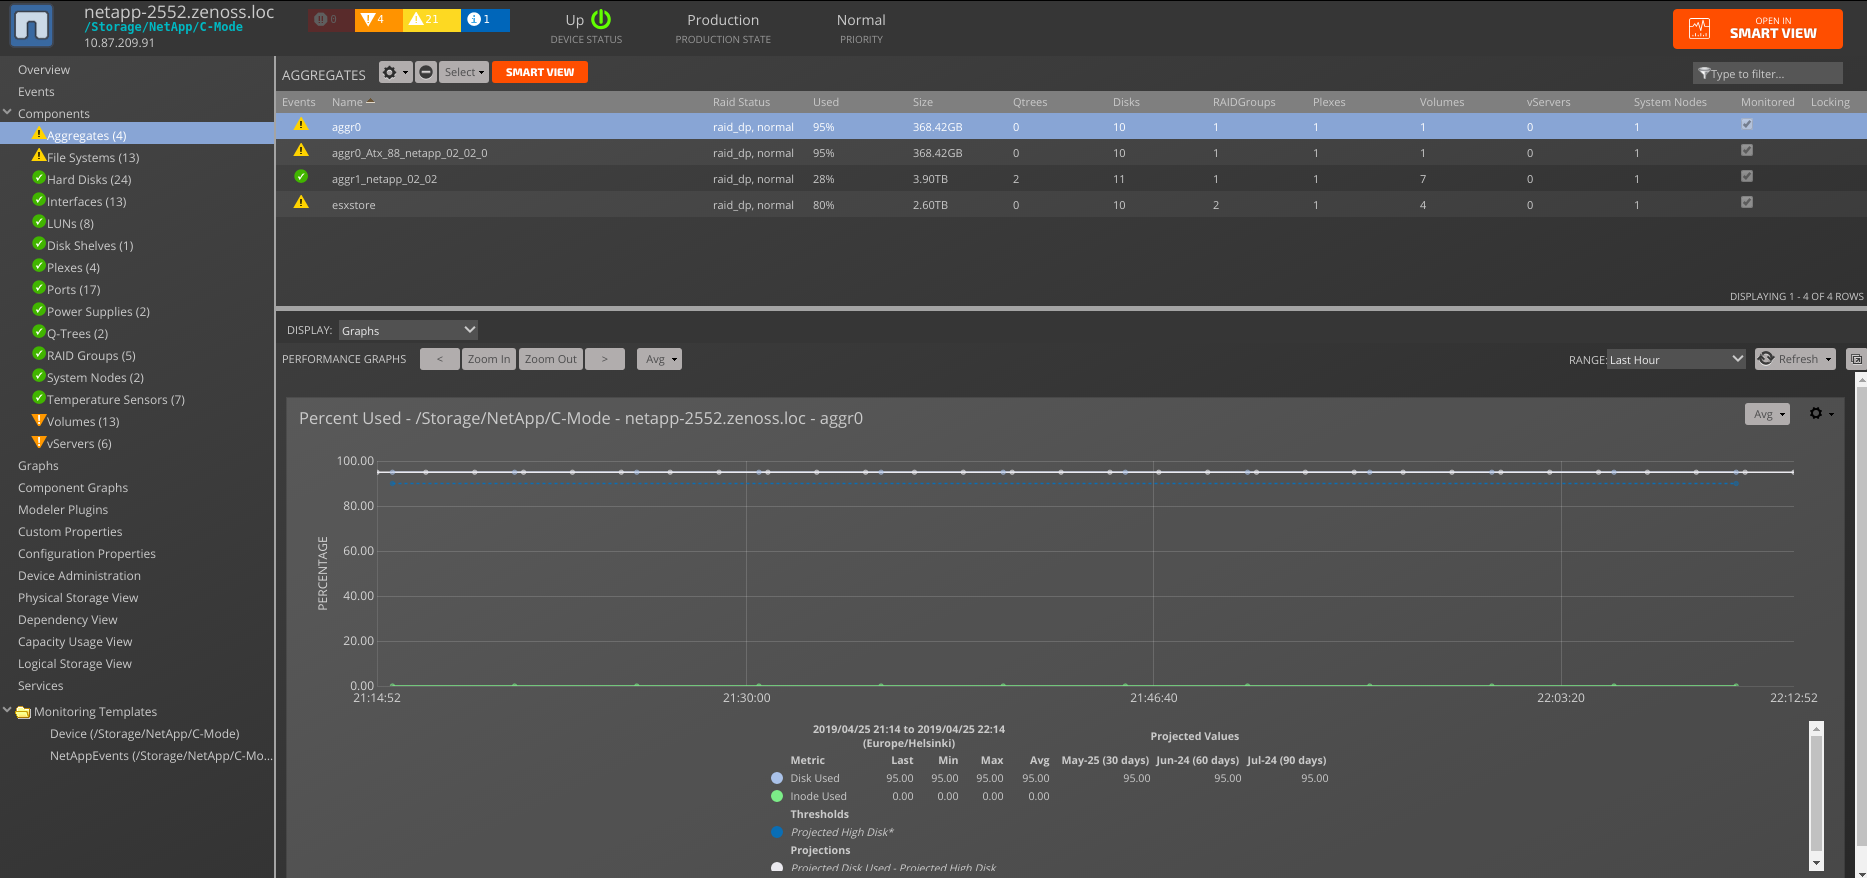
Aggregates
- Monitoring Templates
- NetAppAggregate
- Data Points
- aggregate.user_writes
- usedBlocks.dskPercent
- usedBlocks.inodeUsedPercent
- usedBlocks.sizeUsed
- usedBlocks.size_total
- usedBlocks.total_reserved_space
- status.mount_state
- Data Points (C-Mode)
- aggregate.aggr_inode_attributes_files_private_used
- aggregate.aggr_inode_attributes_files_total
- aggregate.aggr_inode_attributes_files_used
- aggregate.aggr_inode_attributes_maxfiles_available
- aggregate.aggr_inode_attributes_maxfiles_used
- aggregate.aggr_inode_attributes_percent_inode_used_capacity
- aggregate.aggr_space_attributes_percent_used_capacity
- aggregate.aggr_space_attributes_size_total
- aggregate.aggr_space_attributes_size_used
- aggregate.aggr_space_attributes_total_reserved_space
- aggregate.flexvol_count
- Thresholds
- 90 percent used
- Graphs
- Percent Used (inodeUsedPercent, dskPercent)
- Monitoring Templates
Note: Root Aggregates won't be discovered and monitored for REST API-based C-Mode target devices due to REST API restriction.
-
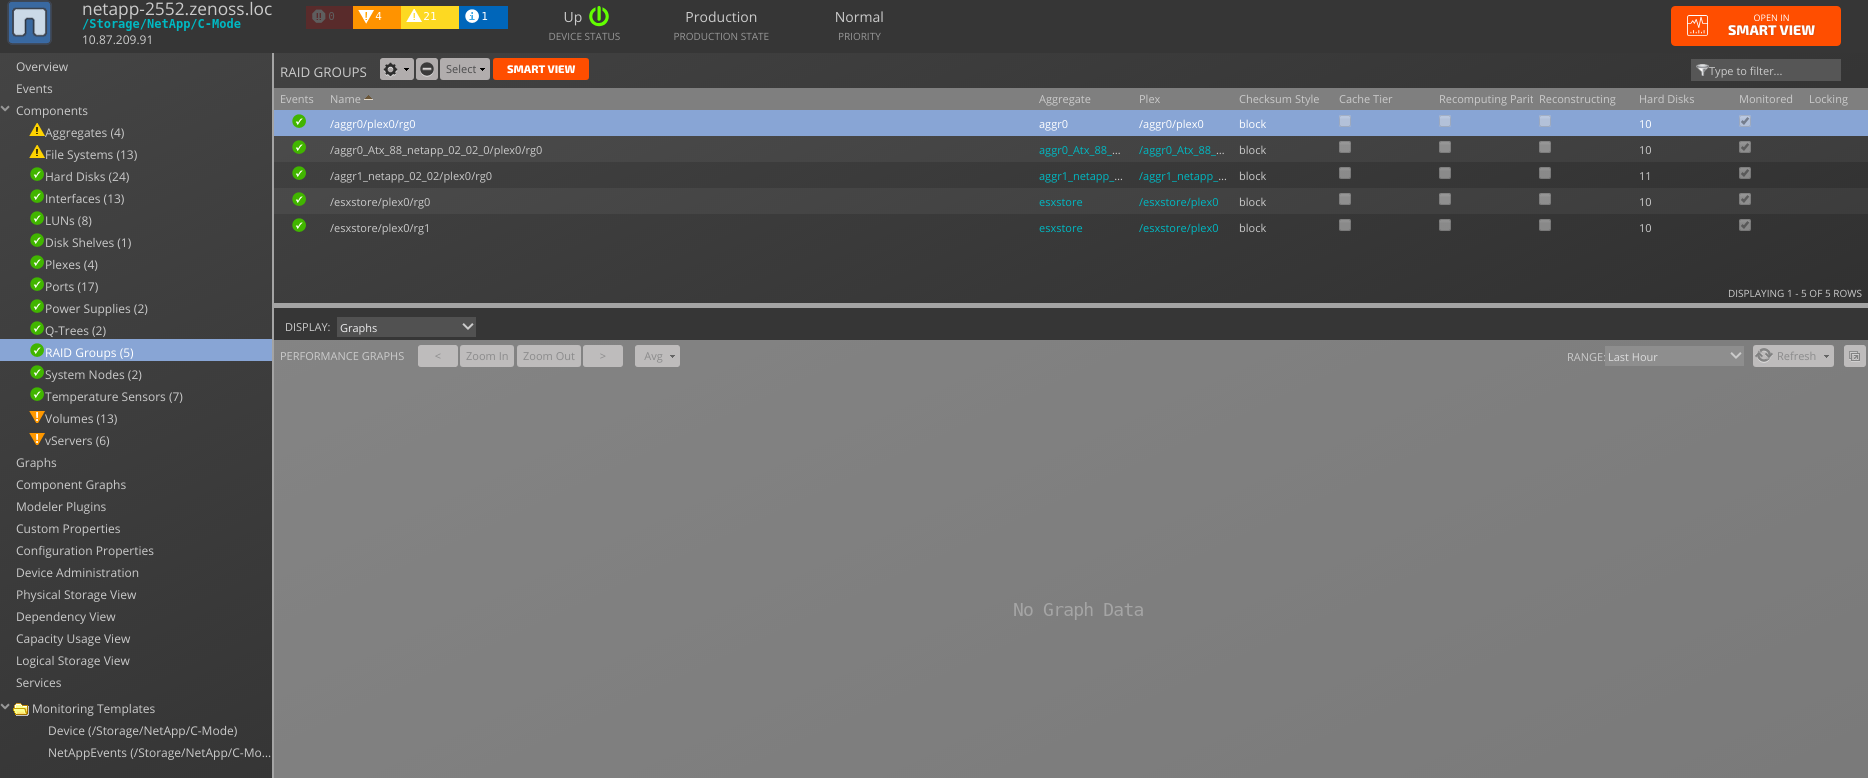
Raid Groups
- Monitoring Templates
- None
- Data Points
- None
- Thresholds
- None
- Graphs
- None
- Monitoring Templates
-
Fibre Channel Adapters
- Monitoring Templates
- NetAppPowerSupply
- Data Points (ZAPI C-Mode/ZAPI 7-Mode)
- stats.adapter_resets
- stats.crc_errors
- stats.discarded_frames
- stats.frame_overruns
- stats.frame_underruns
- stats.initiators_connected
- stats.invalid_xmit_words
- stats.link_breaks
- stats.lip_resets
- stats.lr_received
- stats.lr_sent
- stats.nos_received
- stats.ols_received
- stats.protocol_errors
- stats.queue_depth
- stats.scsi_requests_dropped
- stats.spurious_interrupts
- stats.total_logins
- stats.total_logouts
- Data Points (REST API-based C-Mode)
- stats.ols_received
- stats.lr_received
- stats.spurious_interrupts
- stats.link_down
- stats.lr_sent
- stats.nos_received
- stats.reset_count
- stats.invalid_transmission_word
- stats.crc_errors
- Thresholds
- None
- Graphs
- Link Recovery (lr_received, lr_sent)
- Cyclic Redundancy Check (crc_errors)
- Frame (frame_overruns, frame_underruns) absent for REST API-based C-Mode
- iSCSI Requests (scsi_requests_dropped) absent for REST API-based C-Mode
- Not Operational Sequence (nos_received)
- Offline Sequence (ols_received)
- Monitoring Templates
-
Fibre Channel Initiators
- Monitoring Templates
- None
- Data Points
- None
- Thresholds
- None
- Graphs
- None
- Monitoring Templates
-
Interfaces
- Monitoring Templates
- NetAppFCInterface
- NetApp_ethernetCsmacd
- Data Points
- Ethernet Interfaces
- ifNet.ifInErrors
- ifNet.ifInOctets
- ifNet.ifInUcastPackets
- ifNet.ifOutErrors
- ifNet.ifOutOctets
- ifNet.ifOutUcastPackets
- interface.operStatus
- Fibre Channel Interfaces
- fcp_lif.read_data
- fcp_lif.read_ops
- fcp_lif.avg_write_latency
- fcp_lif.write_data
- fcp_lif.write_ops
- fcp_lif.other_ops
- fcp_lif.avg_read_latency
- fcp_lif.avg_other_latency
- interface.operStatus
- Thresholds
- High Utilization
- Graphs
- Ethernet Interfaces
- Throughput (ifInOctets, ifOutOctets)
- Packets (ifInUcastPackets, ifOutUcastPackets)
- Errors (ifInErrors, ifOutErrors)
- Fibre Channel Interfaces
- Operations: (lif_write_ops, lif_read_ops, lif_other_ops)
- Latency: (lif_avg_read_latency, lif_avg_write_latency, lif_avg_other_latency)
- Data: (lif_read_data, lif_write_data)
- Monitoring Templates
-
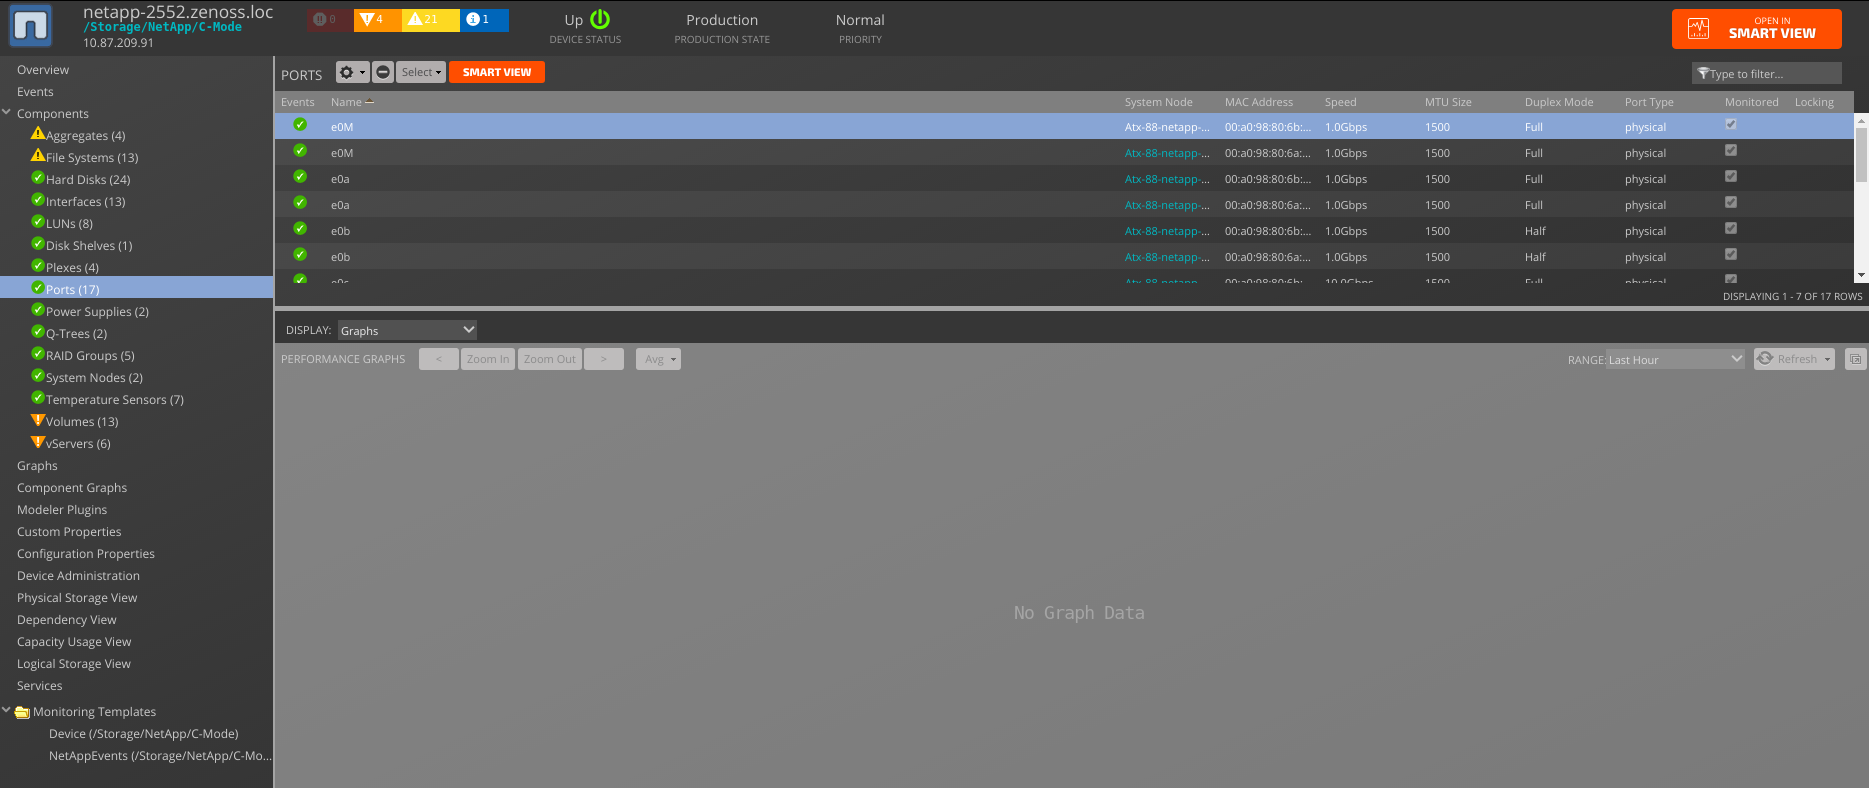
Ports
- Monitoring Templates
- None
- Data Points
- None
- Thresholds
- None
- Graphs
- None
- Monitoring Templates
-
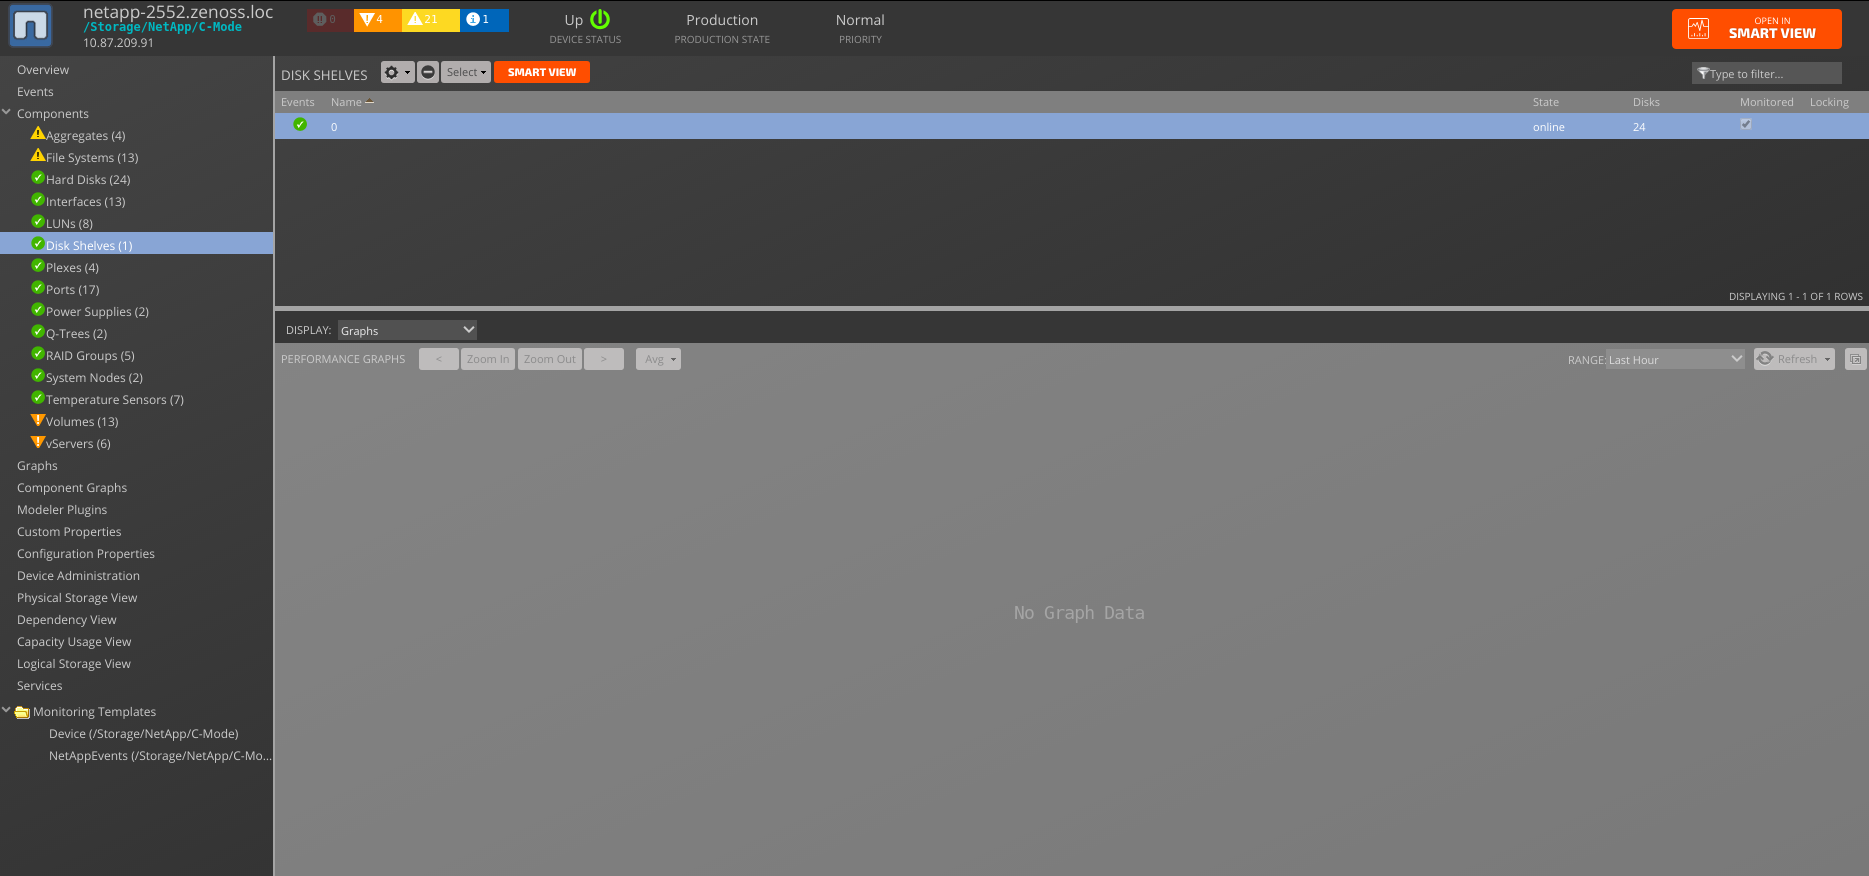
Disk Shelves
- Monitoring Templates
- NetAppDiskShelf
- Data Points
- Status.state (only for REST API-based C-Mode)
- Thresholds
- None
- Graphs
- None
- Monitoring Templates
Note: Status datasource available for each device class
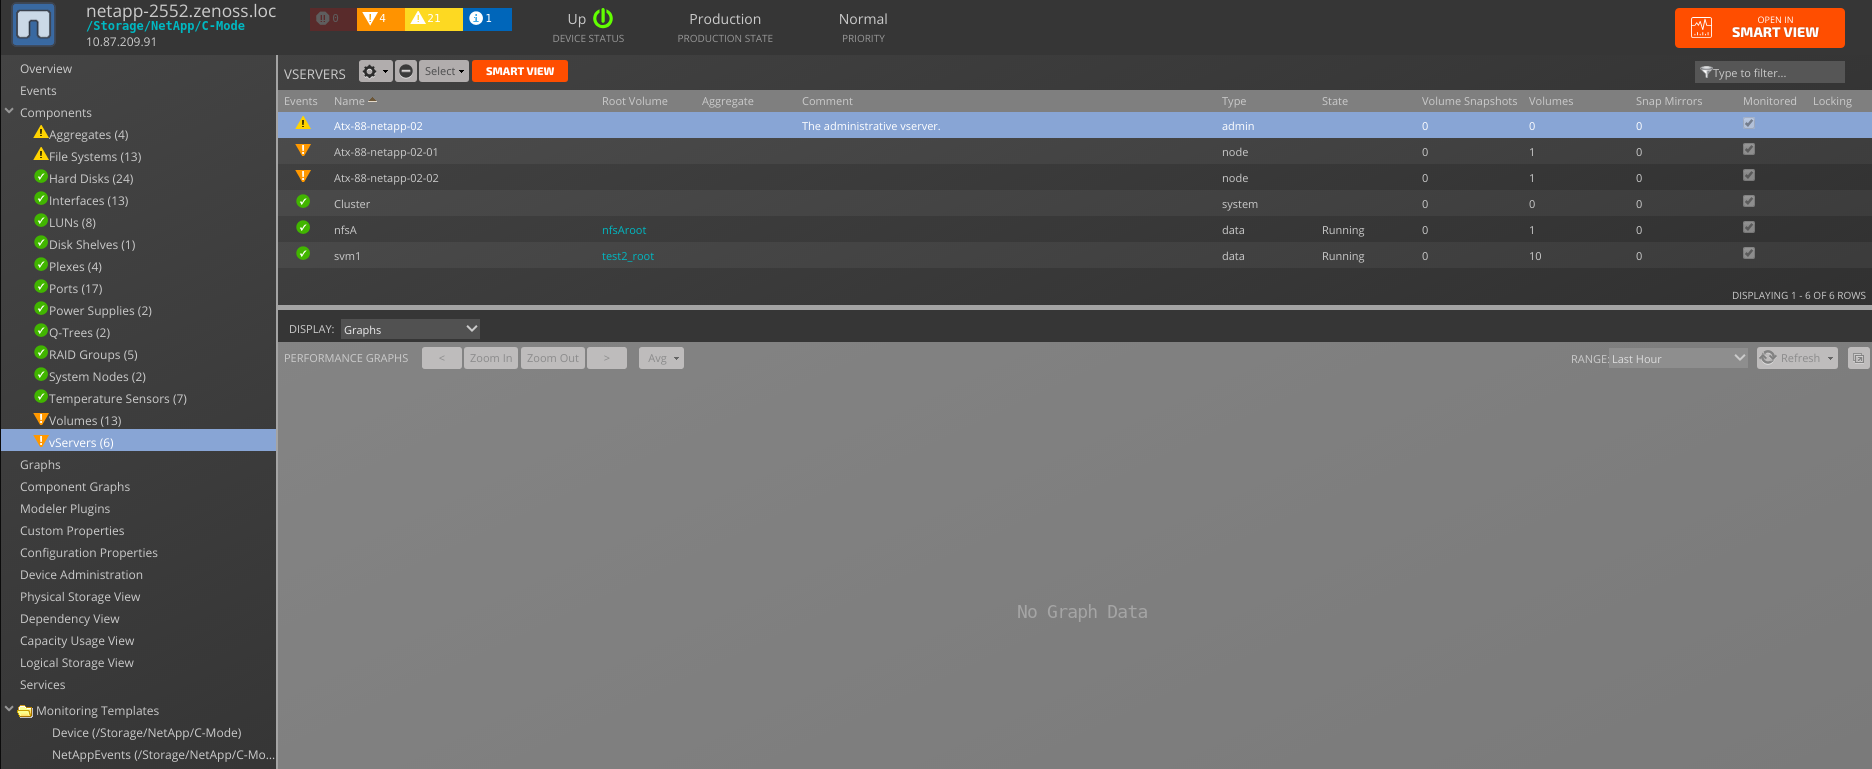
- VServers
- Monitoring Templates
- NetAppVServer
- Data Points
- Status.state
- Available only for REST API-based C-Mode
- nfsv3node_nfsv3cCreates
- nfsv3node_nfsv3cGetattrs
- nfsv3node_nfsv3cWrites
- nfsv3node_nfsv3cMkdirs
- nfsv3node_nfsv3cRenames
- nfsv3node_nfsv3cReadDirs
- nfsv3node_nfsv3cAccesses
- nfsv3node_nfsv3cSymlinks
- nfsv3node_nfsv3cReaddirPluss
- nfsv3node_nfsv3cNulls
- nfsv3node_nfsv3cLinks
- nfsv3node_nfsv3cRemoves
- nfsv3node_nfsv3cReadCalls
- nfsv3node_nfsv3cLookups
- cifsnode_cifsReads
- cifsnode_cifsWrites
- Thresholds
- None
- Graphs
- Available only for REST API-based C-Mode
- NFSv3 Calls: (nfsv3cAccesses, nfsv3cCreates, nfsv3cGetattrs, nfsv3cLinks, nfsv3cLookups, nfsv3cMkdirs, nfsv3cNulls, nfsv3cReadDirs, nfsv3cReaddirPluss, nfsv3cRemoves, nfsv3cRenames, nfsv3cSymlinks)
- NFSv3 Common Operations: (nfsv3cReadCalls, nfsv3cWrites)
- CIFS Reads and Writes: (cifsReads, cifsWrites)
- Available only for REST API-based C-Mode
- Monitoring Templates
Note: Root VServers won't be discovered and monitored for REST API-based C-Mode target devices due to REST API restriction.
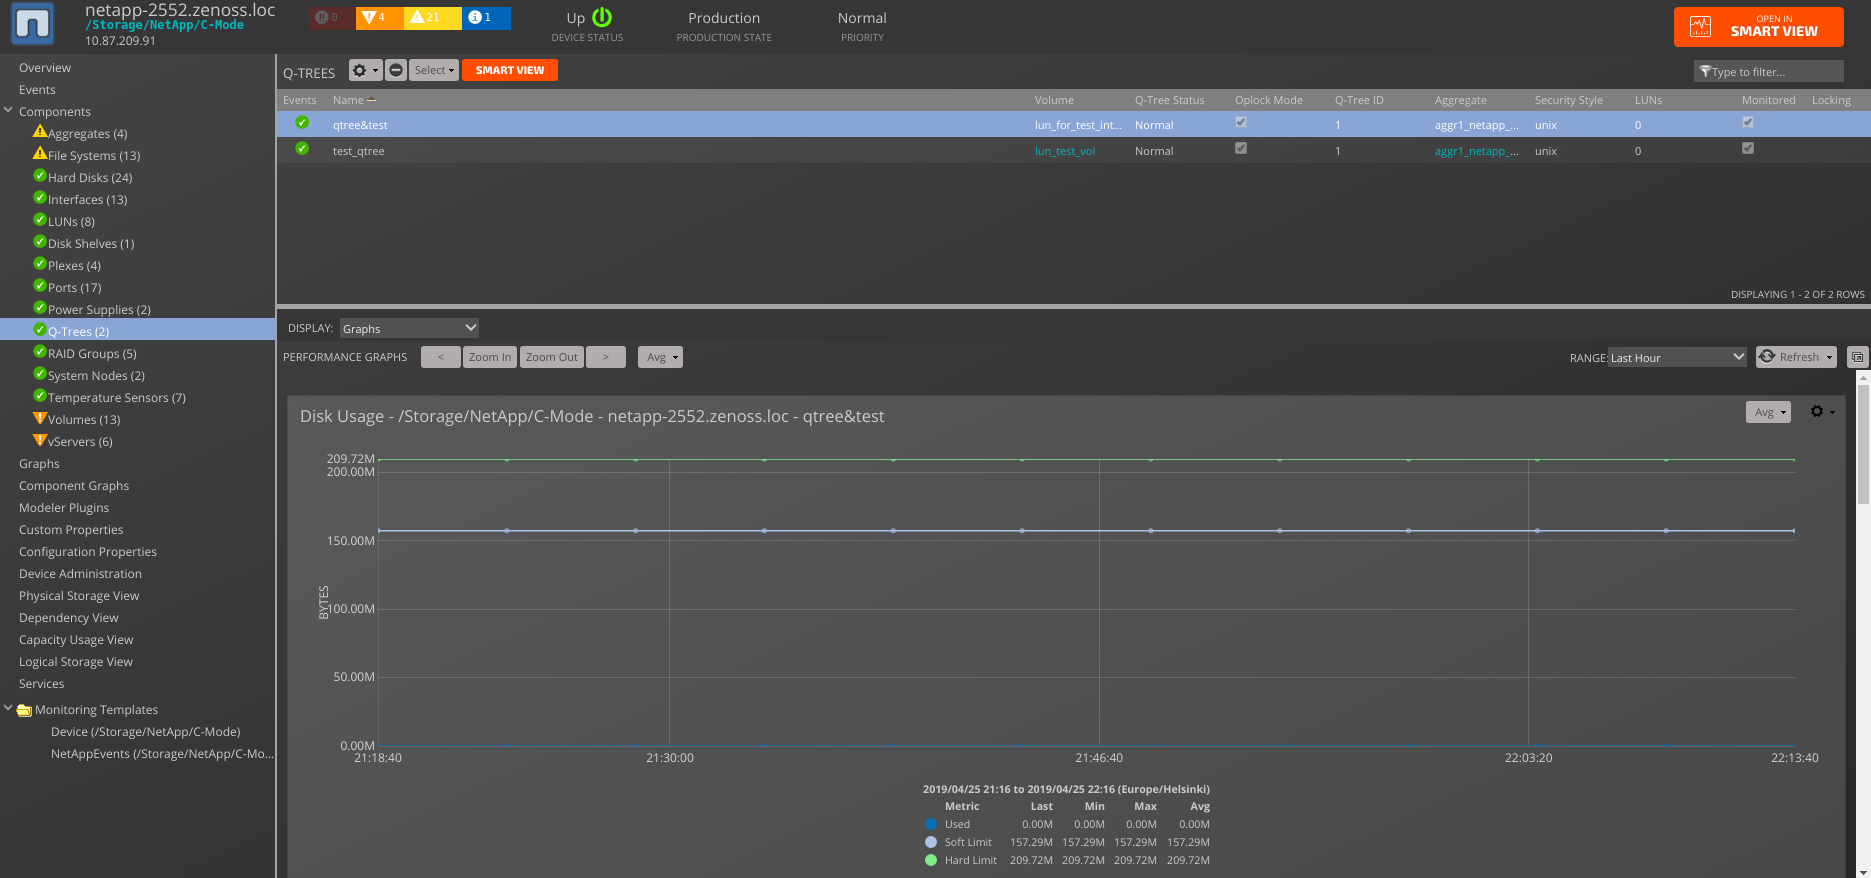
- QTrees
- Monitoring Templates
- NetAppQTree
- Data Points
- qtree.nfs_ops
- qtree.cifs_ops
- qtree.internal_ops
- qtree_usage.disk_limit
- qtree_usage.soft_disk_limit
- qtree_usage.disk_used
- qtree_usage.file_limit
- qtree_usage.soft_file_limit
- qtree_usage.files_used
- status.status
- Thresholds
- 90 Percent Used
- Graphs
- Disk Usage
- Disk Utilization
- Files Usage
- Files Utilization
- Monitoring Templates
Note: Root Q-Trees will be additionally discovered for the C-Mode REST API target devices due to API specifics.
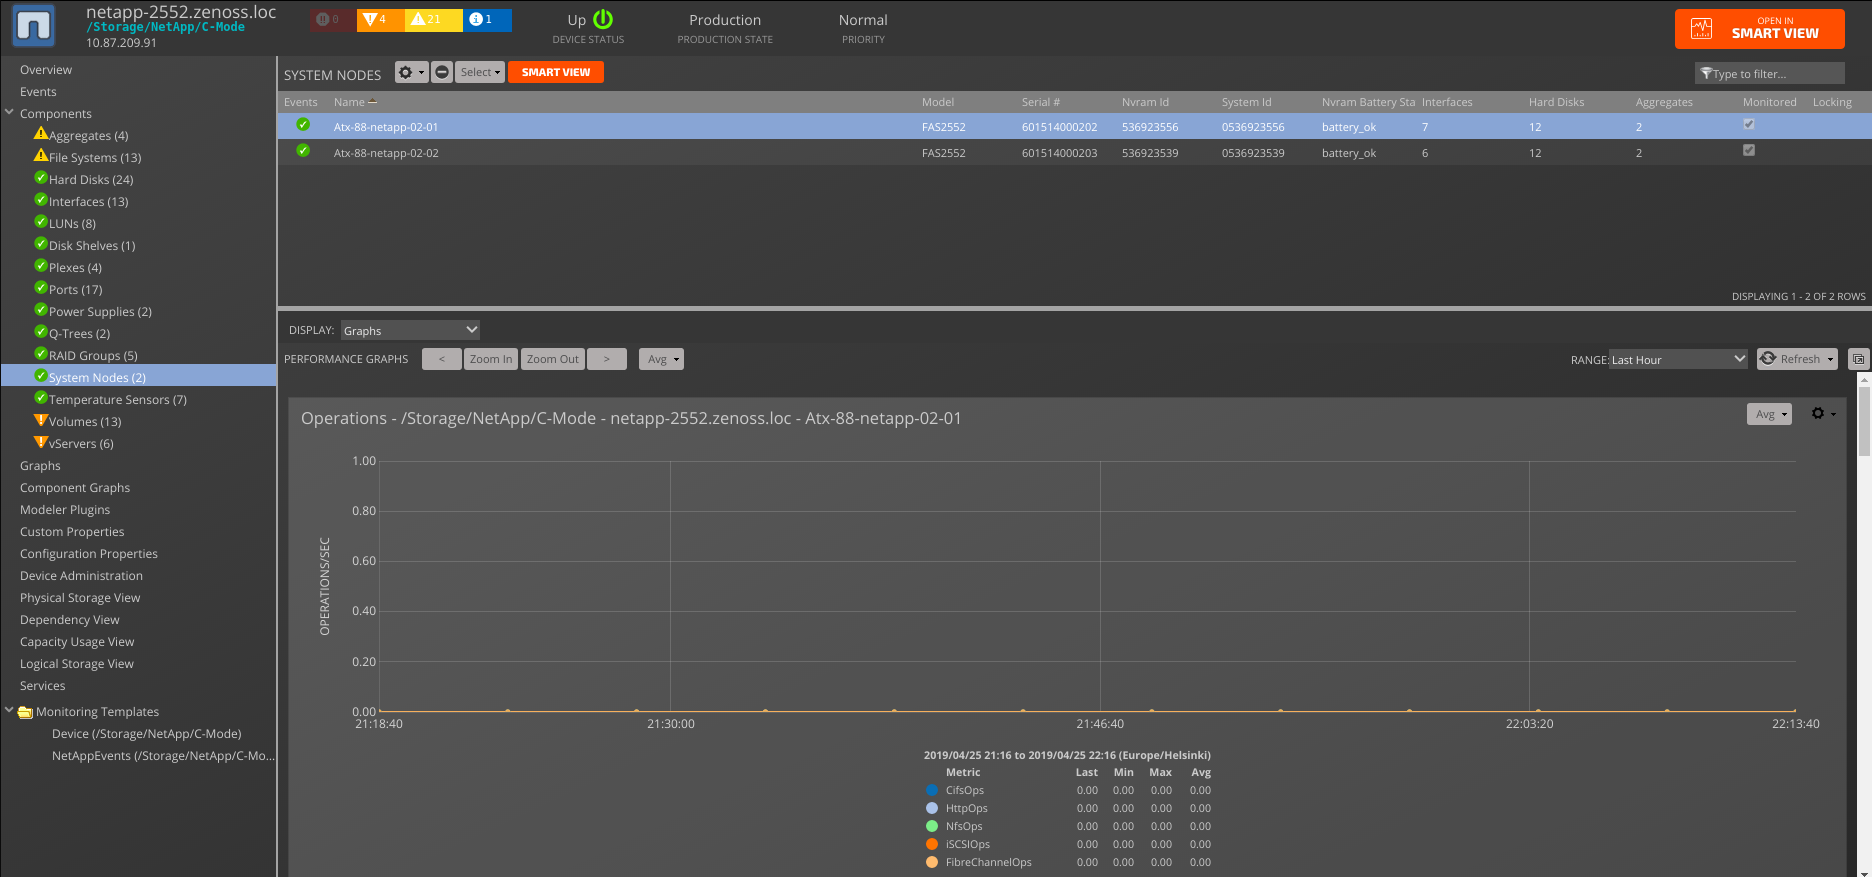
- System Nodes
- Monitoring Templates
- NetAppSystemNode
- Data Points (ZAPI C-Mode)
- cifsnode.cifsRead
- cifsnode.cifsWrites
- cpuBusyPercent.cpuBusyPercent
- cpuUtilization.Busy
- nfsv3node.nfsv3cAccesses
- nfsv3node.nfsv3cCreates
- nfsv3node.nfsv3cGetattrs
- nfsv3node.nfsv3cLinks
- nfsv3node.nfsv3cLookups
- nfsv3node.nfsv3cMkdirs
- nfsv3node.nfsv3cNulls
- nfsv3node.nfsv3cReadCalls
- nfsv3node.nfsv3cReadDirs
- nfsv3node.nfsv3cReaddirPluss
- nfsv3node.nfsv3cRemoves
- nfsv3node.nfsv3cRenames
- nfsv3node.nfsv3cSymlinks
- nfsv3node.nfsv3cWrites
- system.CifsOps
- system.FibreChannelOps
- system.FibreChannelreadBytes
- system.FibreChannelwriteBytes
- system.HttpOps
- system.MiscNetworkBytesReceived
- system.MiscNetworkBytesSent
- system.NfsOps
- system.cpuBusy
- system.cpuElapsed
- system.iSCSIOps
- system.processorBusyTotal
- system.sysUpTime
- systemnode.cpu_busytime
- systemnode.failed_fan_count
- systemnode.failed_power_supply_count
- systemnode.node_uptime
- status.Health
- Data Points (REST API-based C-Mode)
- systemnode.failed_fan_count
- systemnode.failed_power_supply_count
- systemnode.node_uptime
- status.Health
- Thresholds
- CPU Utilization
- Graphs (ZAPI C-Mode)
- CIFS Reads And Writes (cifsReads, cifsWrites)
- CPU Utilization (Busy)
- NFSv3Calls (nfsv3cAccesses, nfsv3cCreates, nfsv3cGetattrs, nfsv3cLinks, nfsv3cLookups, nfsv3cMkdirs, nfsv3cNulls, nfsv3cReadDirs, nfsv3cReaddirPluss, nfsv3cRemoves, nfsv3cRenames, nfsv3cSymlinks)
- NFSv3 Common Operations (nfsv3cReadCalls, nfsv3cWrites)
- Network Traffic (MiscNetworkBytesReceived, MiscNetworkBytesSent)
- Operations (CifsOps, HttpOps, NfsOps, iSCSIOps FibreChannelOps)
- Fibre Channel Traffic (FibreChannelreadBytes, FibreChannelwriteBytes)
- Graphs (REST API-based C-Mode)
- Failed Modules: (failed_fan_count, failed_power_supply_count)
- Monitoring Templates
NetAppMonitor 5.0.0 migration notes for REST API-based C-Mode devices:
- nfsv3node data source is now part of the VServer component.
- system data source is now migrated to the Device level.
These adjustments align with ONTAP REST API specifics.
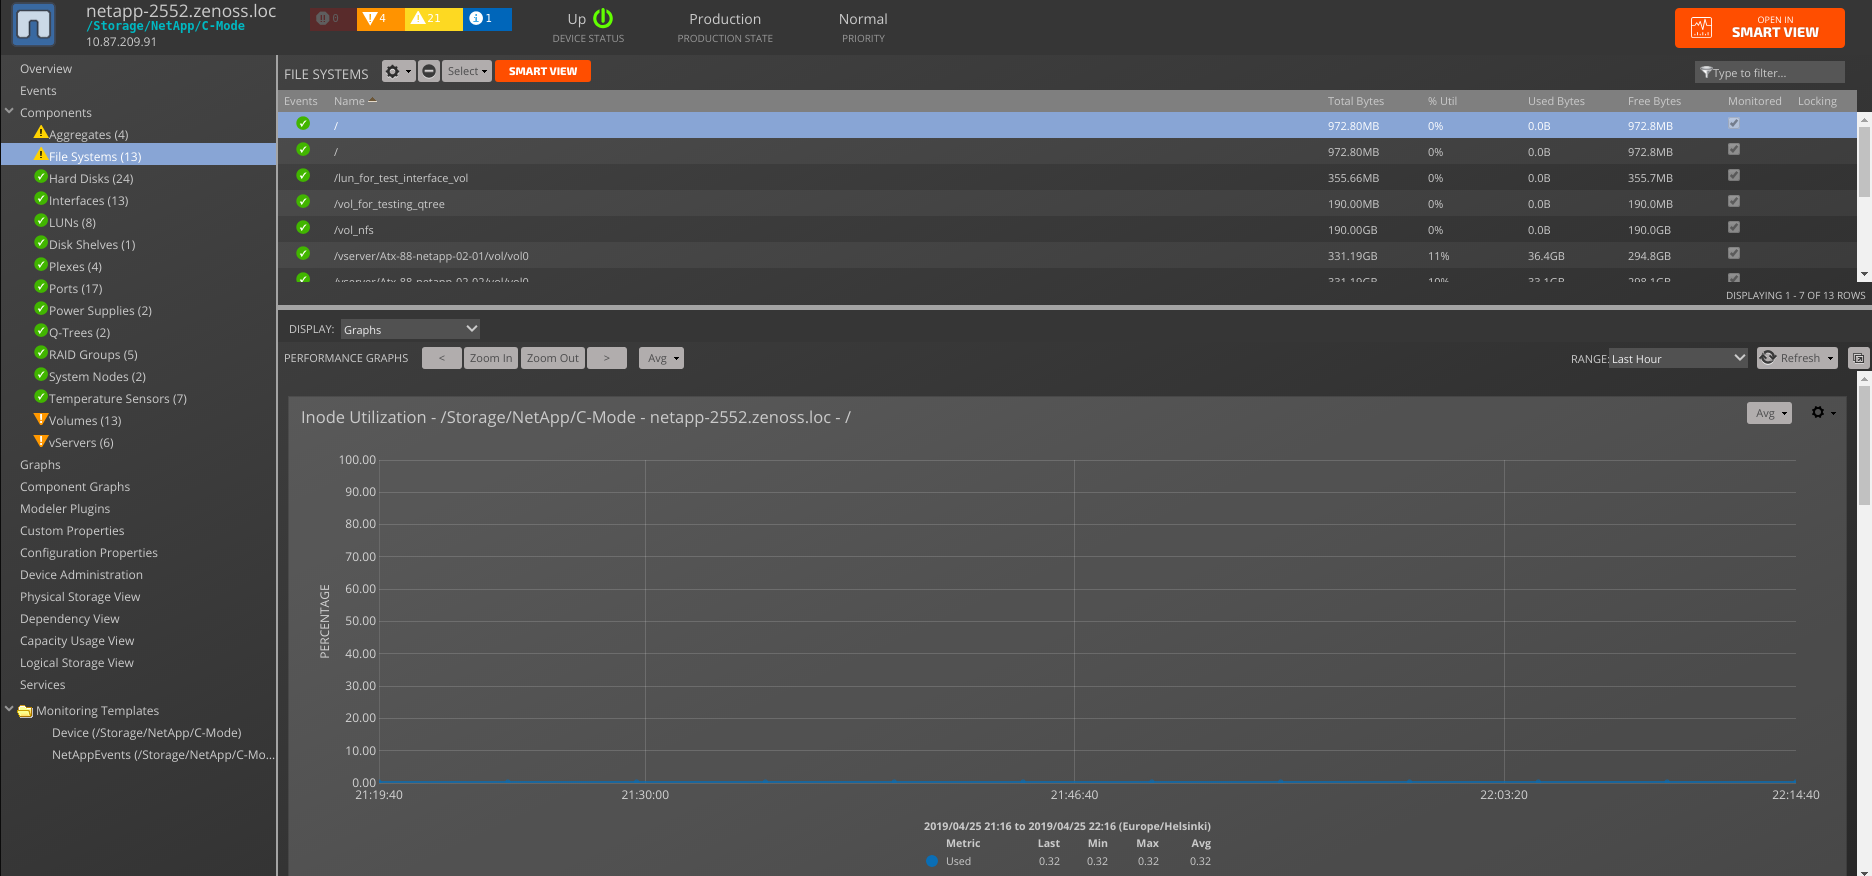
- File Systems
- Monitoring Templates
- FileSystem_Volume
- Data Points
- usedBlocks.dskPercent
- usedBlocks.inodeTotal
- usedBlocks.inodeUsed
- usedBlocks.inodeUsedPercent
- usedBlocks.sizeUsed
- Thresholds
- 90 percent used
- Graphs
- Utilization (dskPercent)
- Usage (sizeUsed)
- Inode Utilization (inodeUsedPercent)
- Inode Usage (inodeUsed, inodeTotal)
- Monitoring Templates
Note: Root File Systems won't be discovered and monitored for REST API-based C-Mode target devices due to REST API restriction.
-
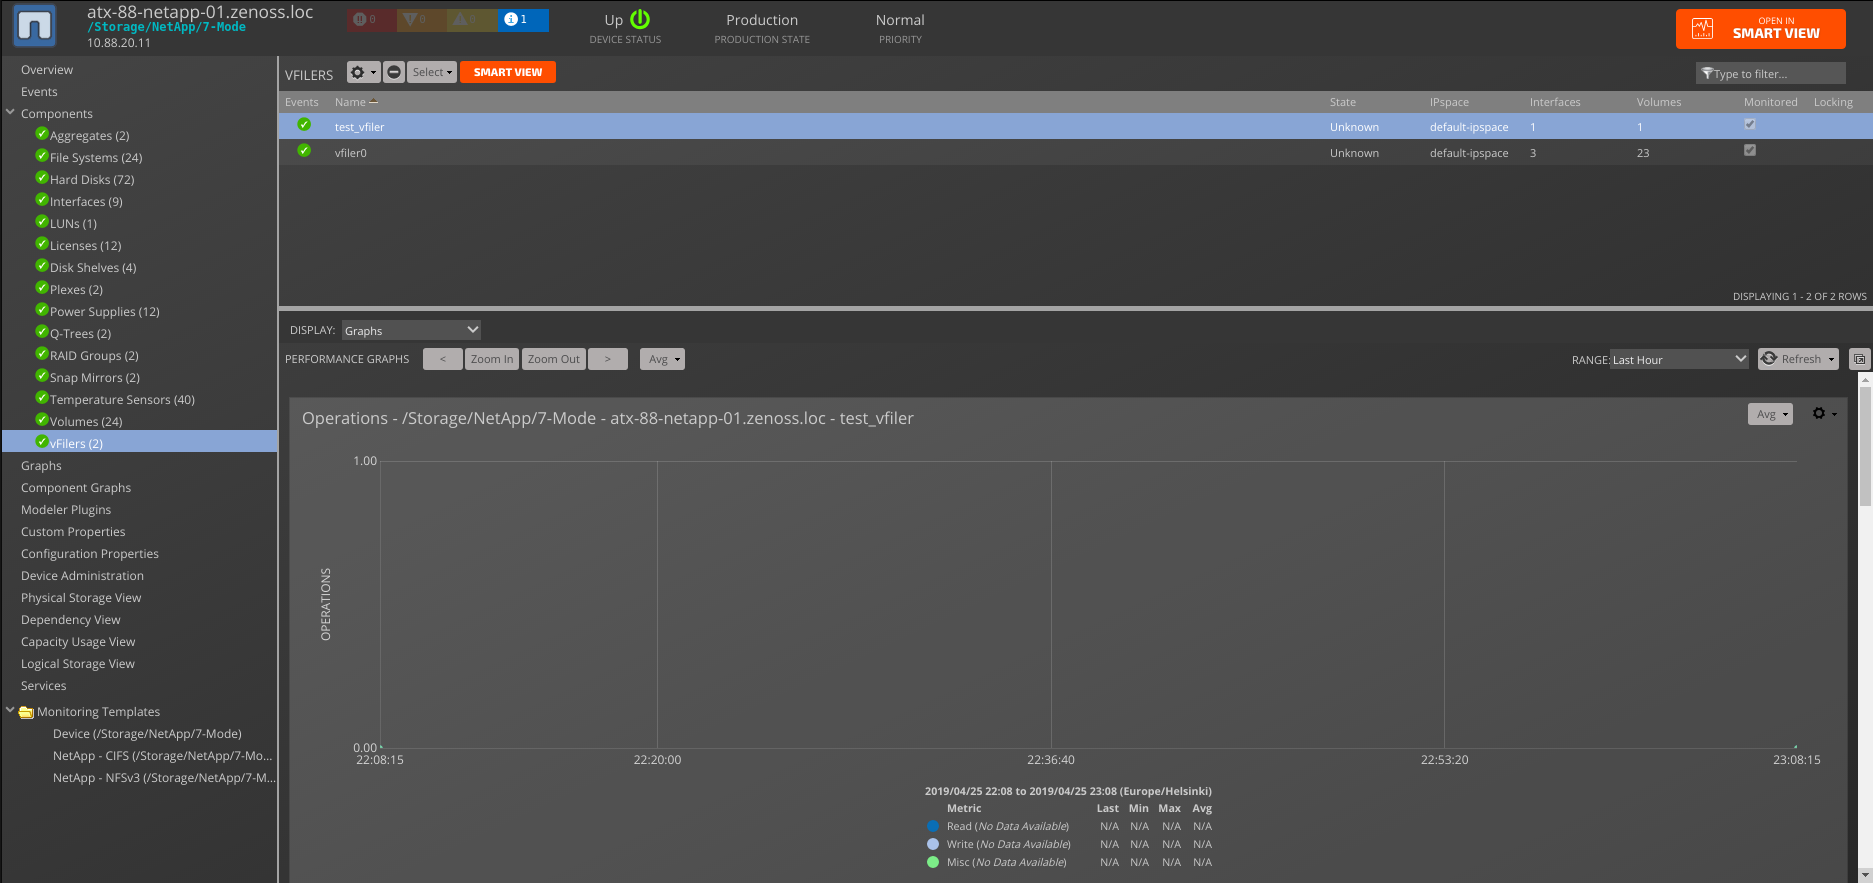
vFilers (ZAPI 7-Mode/SNMP)
- Monitoring Templates
- NetAppVFiler
- Data Points
- vfiler.vfiler_cpu_busy
- vfiler.vfiler_cpu_busy_base
- vfiler.vfiler_misc_ops
- vfiler.vfiler_net_data_recv
- vfiler.vfiler_net_data_sent
- vfiler.vfiler_read_bytes
- vfiler.vfiler_read_ops
- vfiler.vfiler_write_bytes
- vfiler.vfiler_write_ops
- Status.vf_state
- Thresholds
- None
- Graphs
- Operations (read_ops, write_ops, misc_ops)
- Throughput (read_bytes, write_bytes)
- Network Traffic (net_data_recv, net_data_sent)
- CPU (cpu_busy, cpu_busy_base)
- Monitoring Templates
-
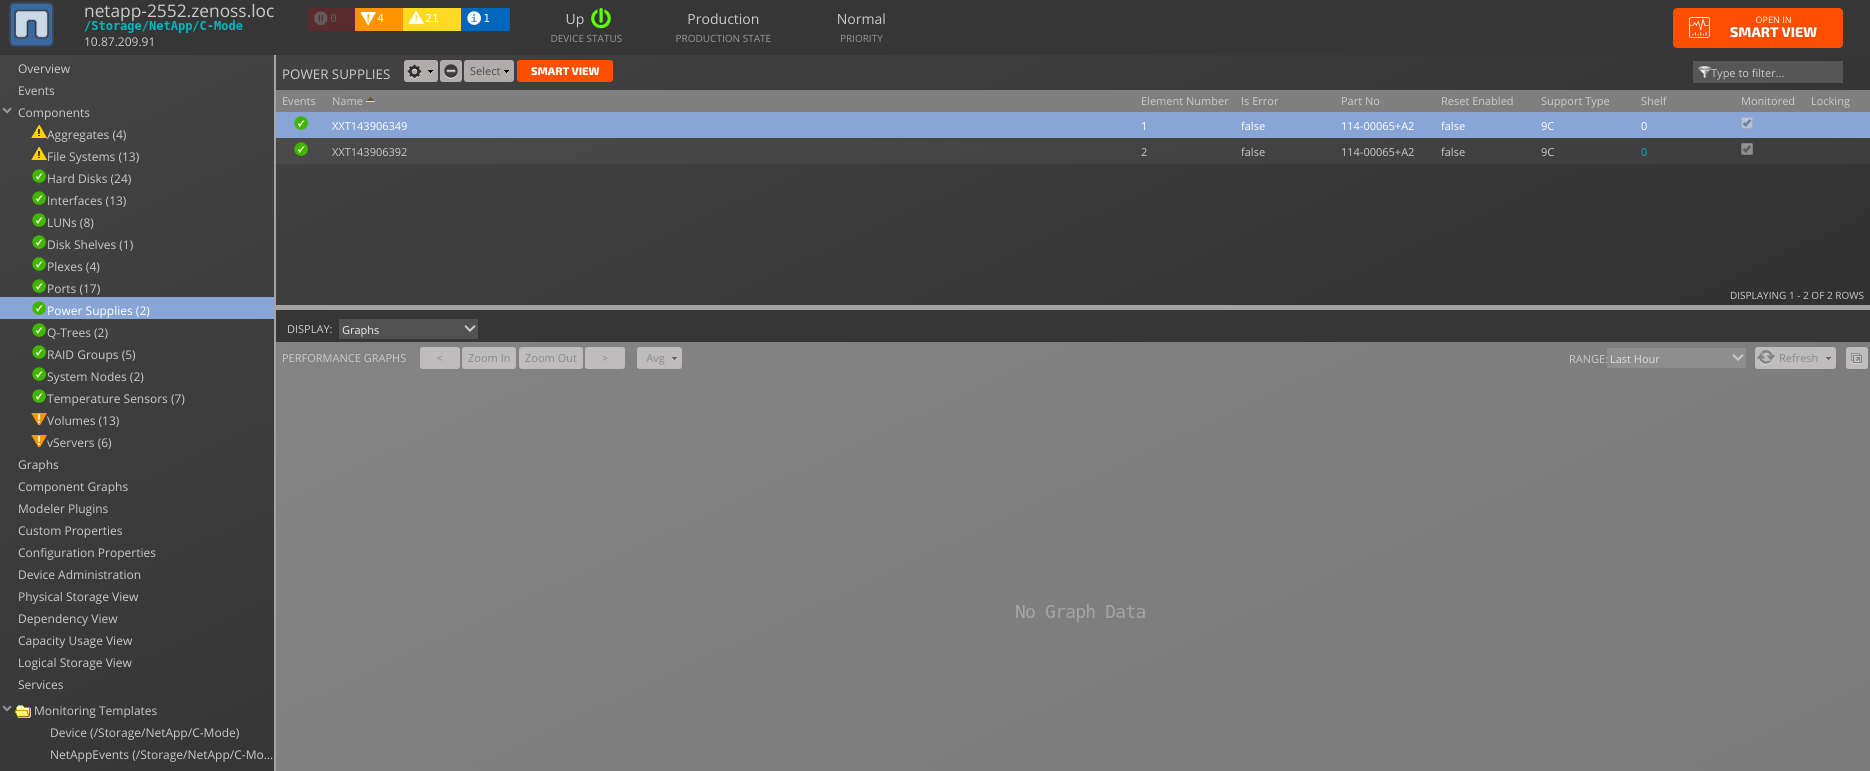
Power Supplies
- Monitoring Templates
- None
- Data Points
- None
- Thresholds
- None
- Graphs
- None
- Monitoring Templates
-
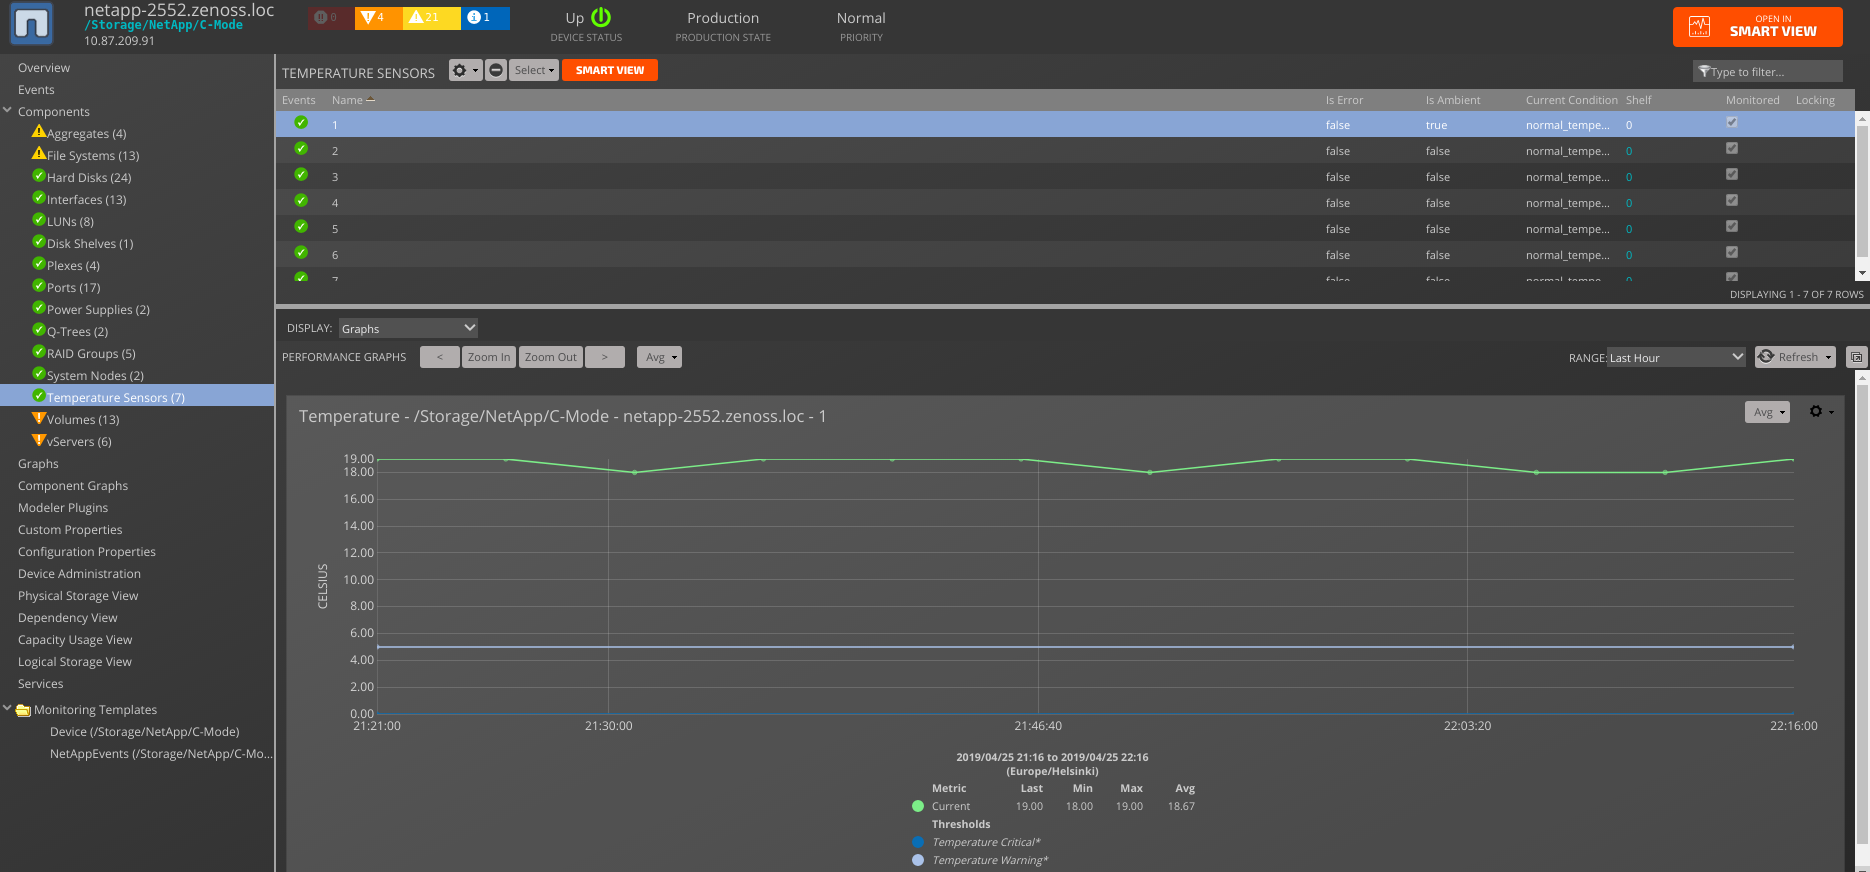
Temperature Sensors
- Monitoring Templates
- NetAppTemperatureSensor
- Data Points
- temperature.current
- temperature.hi_critical
- temperature.hi_warning
- temperature.low_critical
- temperature.low_warning
- Thresholds
- Temperature Critical
- Temperature Warning
- Graphs
- Temperature (temperature_current)
- Monitoring Templates
-
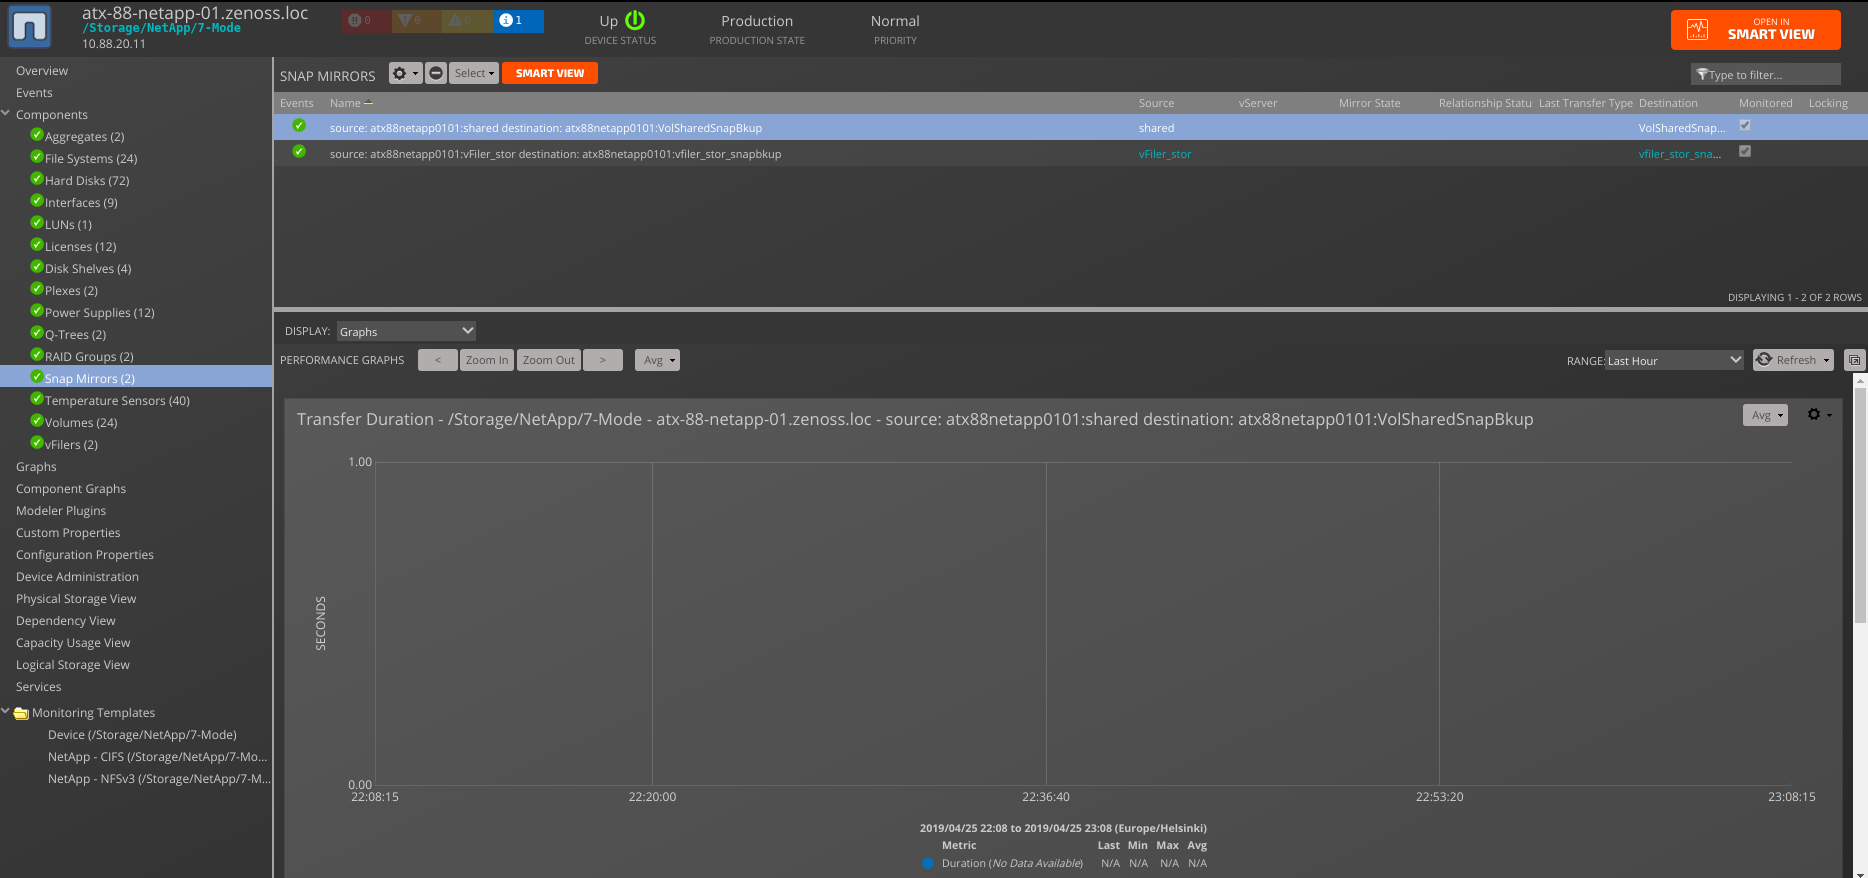
Snap Mirrors
- Monitoring Templates
- NetAppSnapMirror
- Data Points
- snapmirror.lag_time
- snapmirror.last_transfer_duration
- snapmirror.last_transfer_size
- Status.last_transfer_type
- Status.mirror_state
- Status.relationship_status (absent for REST API-based C-Mode)
- Thresholds
- None
- Graphs
- Transfer Duration (last_transfer_duration)
- Transfer Size (last_transfer_size)
- Monitoring Templates
Note: C-Mode Volumes which are MetroCluster mirrors of volumes resided on another device will not have metrics. Such volumes marked with "Mirror" property.
Note: Volumes "Data" or "Data Sector" for _Size_, _Used_, _Available_ means sector of Volume which is used exclusively for
user data, snapshot spill and doesn't include Snapshot reserve size, whereas "Total" applies to whole Volume size, including Snapshot reserve.
NetApp uses SSH to model NFS clients of file systems. It uses SNMP to model:
- Disks
- Storage Enclosures
- RAID Groups
- Plexes
- Aggregates
- Volumes
- LUNs
- QTrees
- Licenses
- vFilers
Configuration
Transitioning a NetApp Device from ZAPI to REST Monitoring for C-Mode devices
Starting with version 5.0.0, REST API support is introduced in the NetAppMonitor ZP, offering enhanced capabilities for monitoring NetApp devices. It is recommended to follow these steps to ensure a smooth transition process and avoid any unexpected issues:
-
Remove the Device from the
*/Storage/NetApp/C-Mode*Device Class. -
Re-add the Device to the
*/Storage/NetApp/REST*Device Class using the same management IP Address. Using the same management IP address ensures continuity and avoids any disruption in device, plugins and data sources recognition. There will be no loss of historical data for the same components during this transition.
Note: NetAppMonitor 5.0.0 ZP version supports ZAPI as well as REST API. So, if the target NetApp cluster version supports ZAPI you can continue using the ZAPI-based device classes, plugins and data sources.
Note: For the REST API-based target devices the N/A values are displayed on the Hard Disk graphs in case when disk is present in system, but it isn't attached to aggregate.
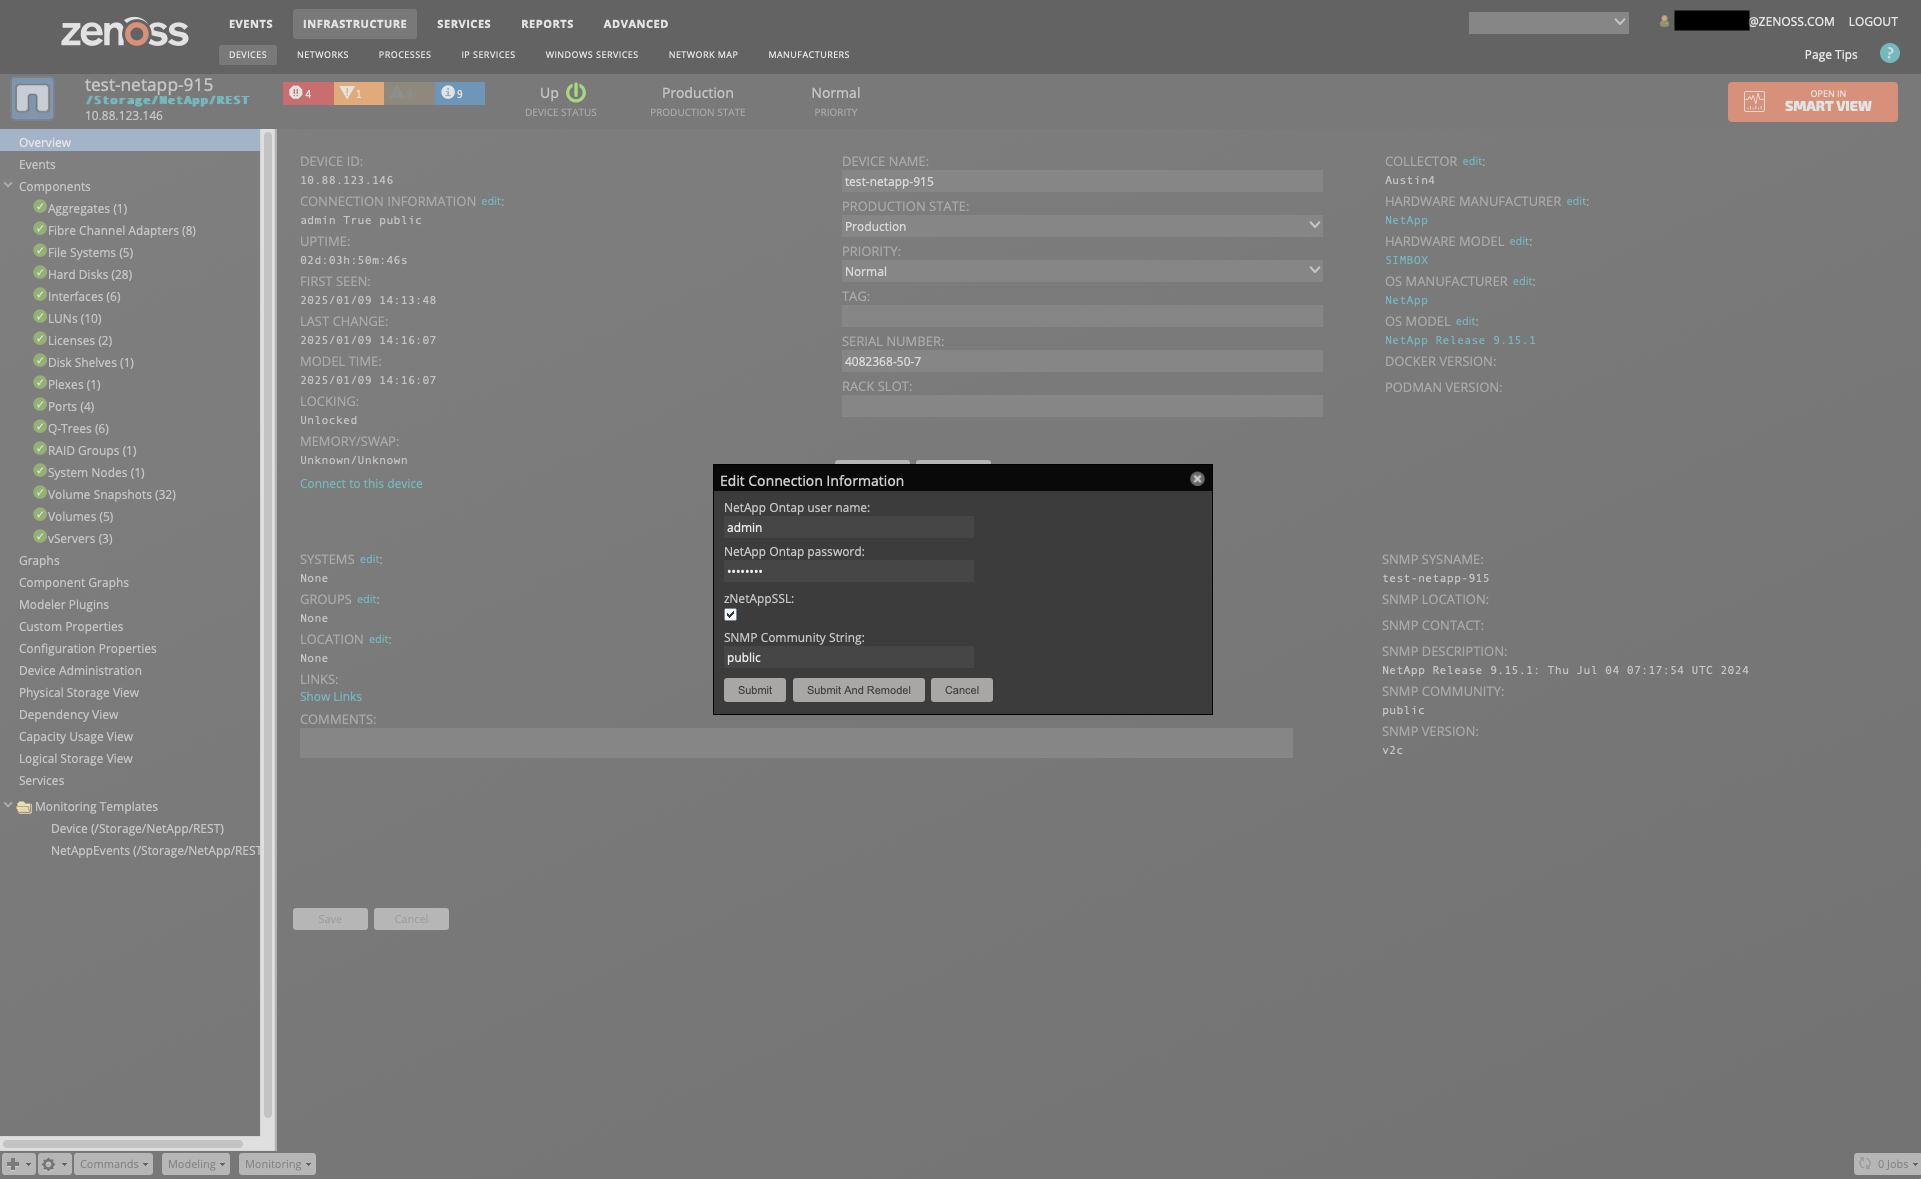
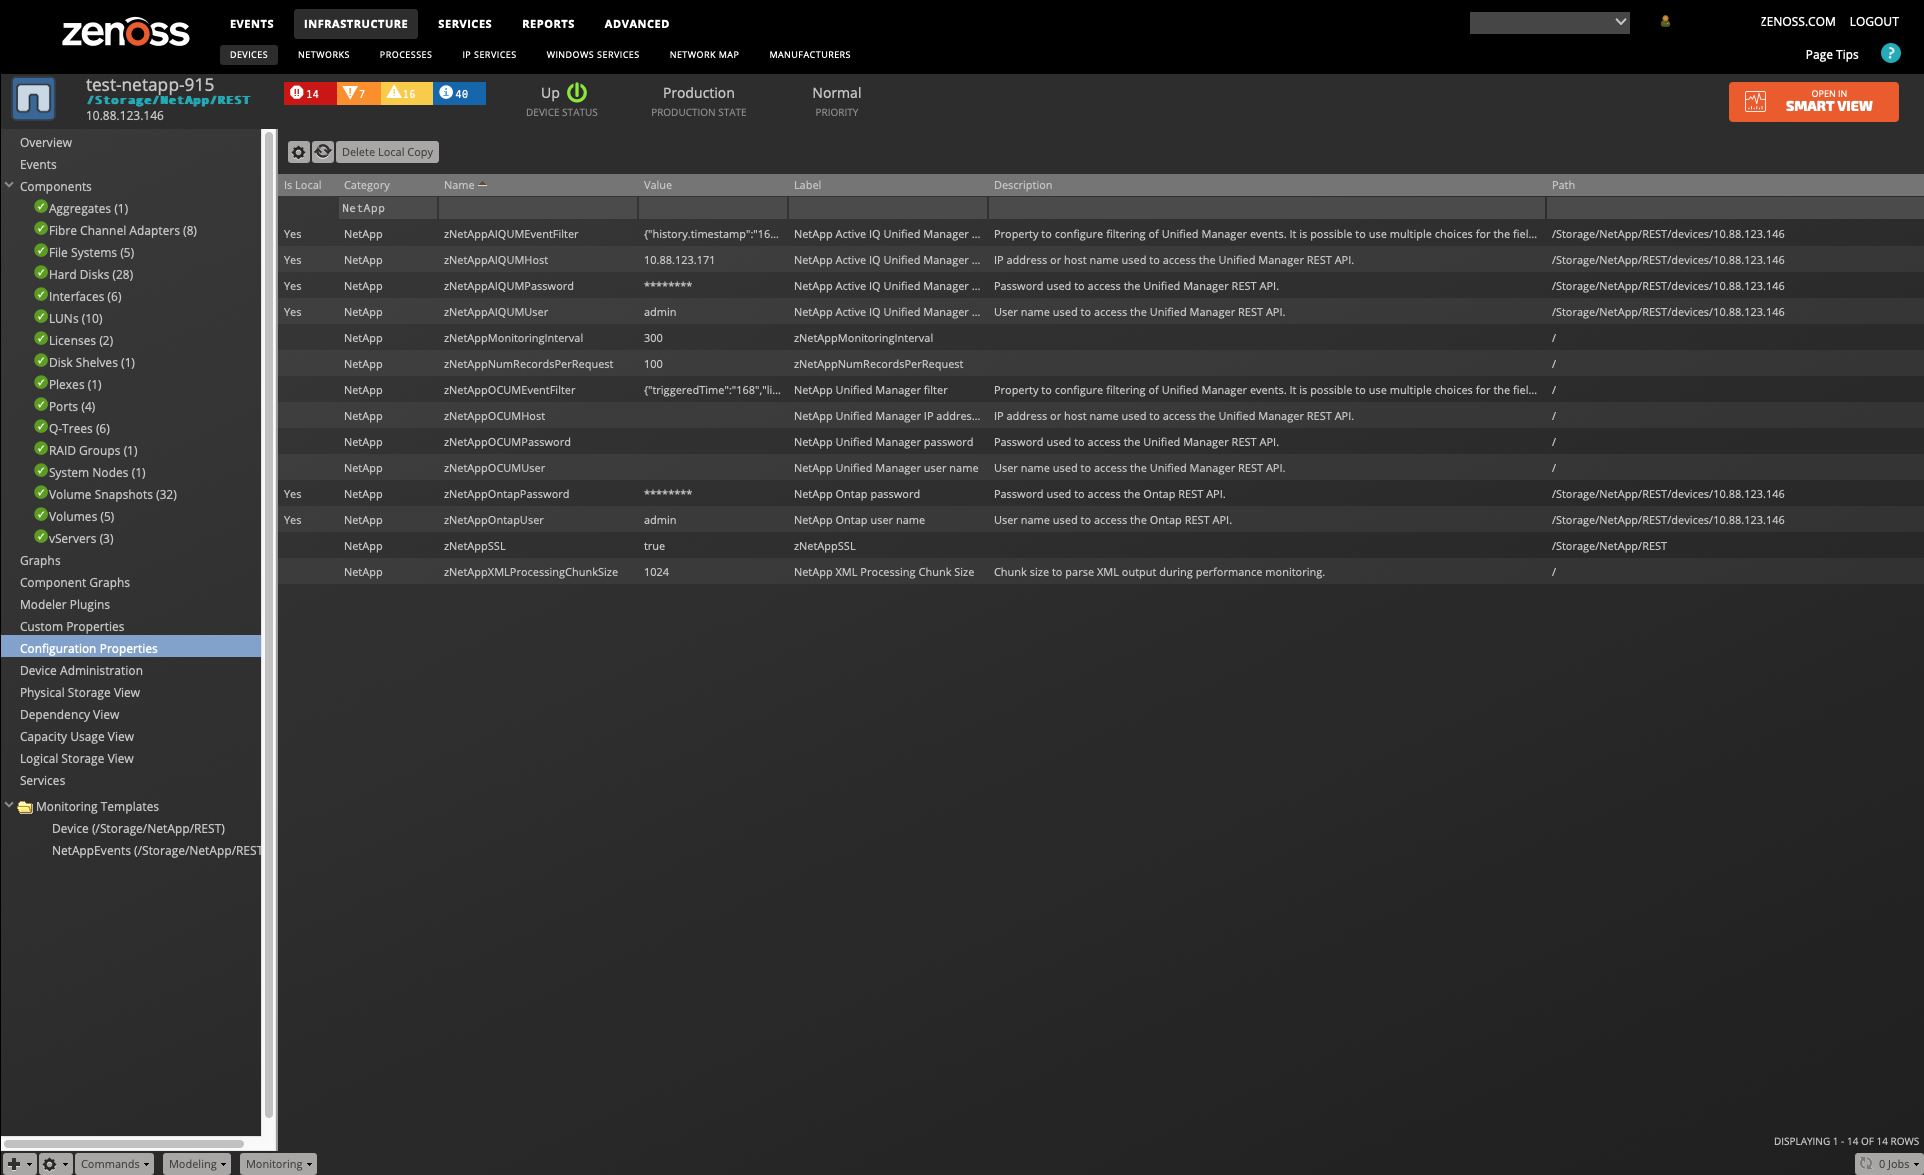
REST API-based C-Mode Configuration
- zNetAppOntapUser: The property to provide the username for the NetApp Filer.
- zNetAppOntapPassword: The property to provide the password for the NetApp Filer.
- zNetAppSSL: The property to specify the type of connection to the NetApp Filer (set to true to enable SSL).
- zNetAppNumRecordsPerRequest: The property to configure the number of records that NetAppMonitor retrieves per request during monitoring and modeling.
- zNetAppMonitoringInterval: The property to configure the monitoring cycle time in seconds.
- zNetAppAIQUMHost: The property to provide the IP address or fully qualified domain name (FQDN) of Active IQ Unified Manager.
- zNetAppAIQUMUser: The property to provide the username for Active IQ Unified Manager.
- zNetAppAIQUMPassword: The property to provide the password for Active IQ Unified Manager.
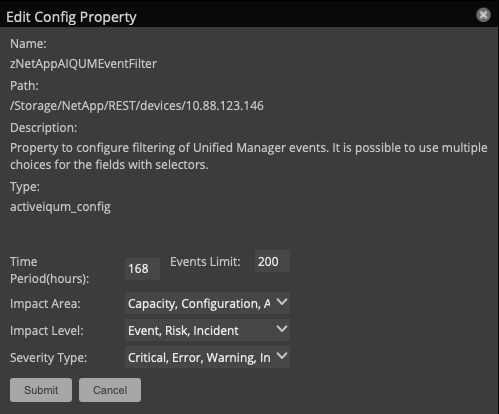
- zNetAppAIQUMEventFilter: The property to configure the filtering of Active IQ Unified Manager events. It allows you to set filters based on trigger time, event limits, event severity, impact area, and impact level. Multiple options can be used for the last three filters.
ZAPI C-Mode/7-Mode Configuration
- zCommandUsername: zProperty to provide the username for the NetApp Filer.
- zCommandPassword: zProperty to provide the password for the NetApp Filer.
- zNetAppSSL: zProperty to specify the type of connection to the NetApp Filer (set to true to enable SSL).
- zNetAppNumRecordsPerRequest: zProperty to configure the number of records that NetAppMonitor retrieves per request during monitoring and modeling.
- zNetAppMonitoringInterval: zProperty to configure the monitoring cycle time in seconds.
- zNetAppOCUMHost: zProperty to provide the IP address or fully qualified domain name (FQDN) of OnCommand Unified Manager.
- zNetAppOCUMUser: zProperty to provide the username for OnCommand Unified Manager.
- zNetAppOCUMPassword: zProperty to provide the password for OnCommand Unified Manager.
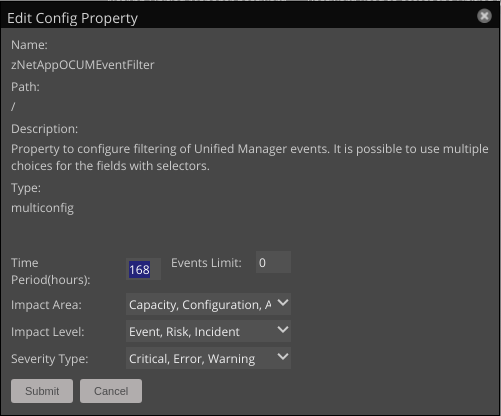
- zNetAppOCUMEventFilter: zProperty to configure the filtering of OnCommand Unified Manager events. It allows you to set filters based on trigger time, event limits, event severity, impact area, and impact level. Multiple options can be used for the last three filters.
Optionally, configure SNMP for 7-Mode NetApp devices and disable zSnmpMonitorIgnore property to monitor statuses for Interface components and monitor trunked interfaces through SNMP.
SNMP
Since version 4.2.0 NetAppMonitor ZenPack provides SNMP v3 support. See SNMP v3 support for additional information.
- Configure the SNMP settings to match the NetApp Filer.
- Configure zCommandUser/zCommandPass for ssh access to gather NFS Client information.
Events (all versions)
-
Configure v1 or v2 traps to be sent to Zenoss Resource Monitor.
-
Make sure SNMP is enabled:
options snmp.enabled on - Add Zenoss hostname or IP address to traphosts:
snmp traphost add - Enable SNMP Traps:
snmp init 1
For more information see NetApp Support, Commands for managing SNMP and Configuring SNMPv3 from the ONTAP 9.
- Forward syslog events by logging into the NetApp Device, configure syslog, add the following:
*.* @yourzenossserver
Replace yourzenossserver with the IP or DNS name of your Zenoss server.
SNMP traps should be enabled for LUN devices to receive events if a LUN goes offline.
- Hard Disks status warning events are enabled for those cases:
- Disk is in broken pool;
- Container is currently unknown;
- Disk is not supported;
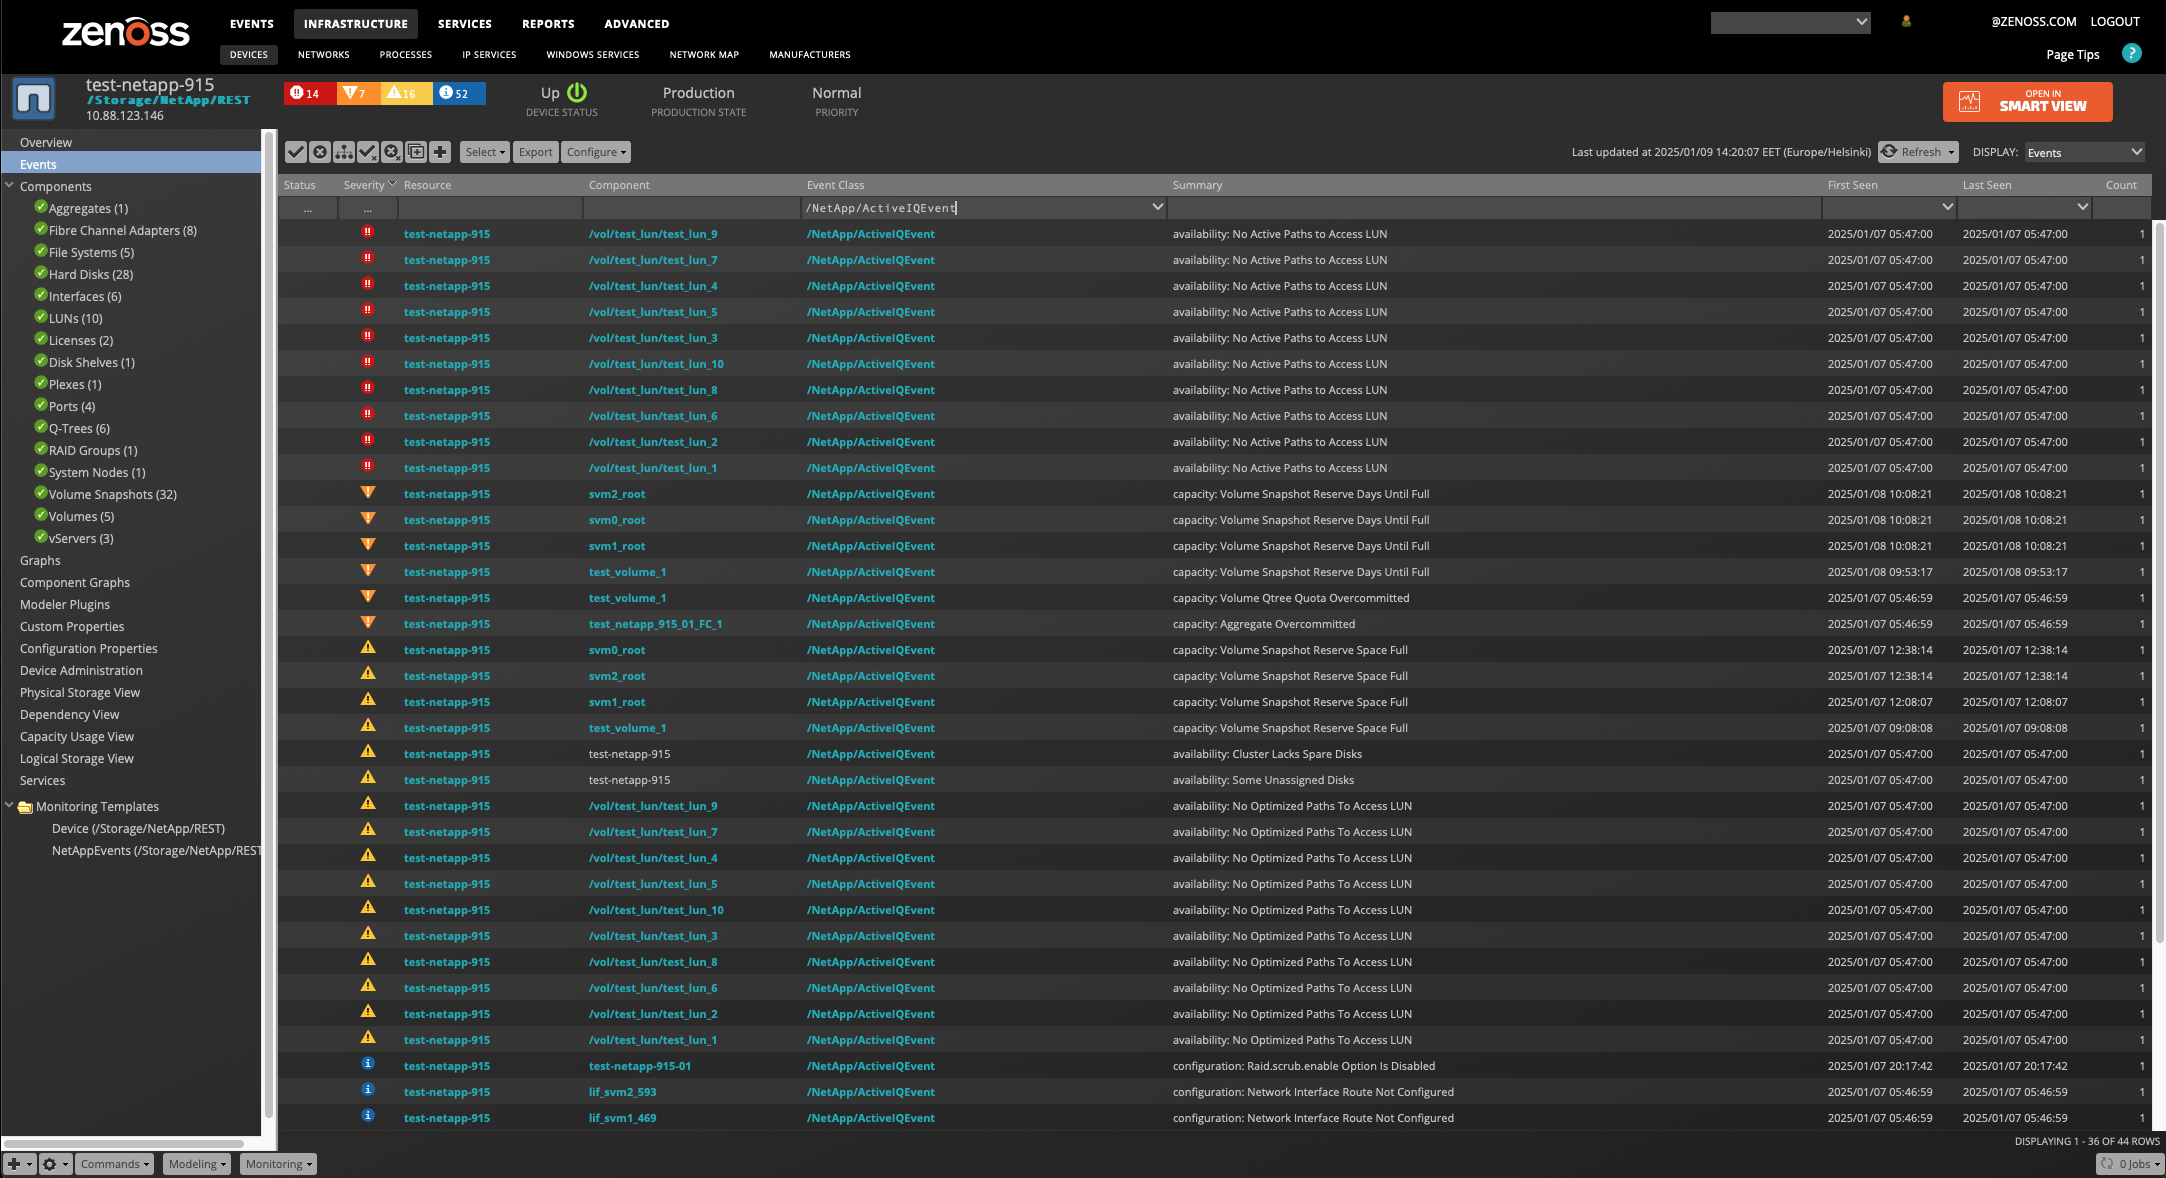
Monitoring Events from Active IQ Unified Manager
Since version 5.0.0, the NetAppMonitor ZenPack supports the monitoring of events from Active IQ Unified Manager (AIQUM) version 9.10 or higher. To enable monitoring of Active IQ Unified Manager events, you need to add a datasource of the 'NetApp Active IQ UM' type at the device level and configure the related zProperties, such as zNetAppAIQUMHost, zNetAppAIQUMUser, and zNetAppAIQUMPassword. Events from Active IQ Unified Manager can be filtered by configuring the zNetAppAIQUMEventFilter property. This filter can be configured to limit events by the following criteria:
- History timestamp: The period (in hours) during which events are triggered. By default, this is set to one week.
- Max records: The maximum number of events to be loaded from the Active IQ Unified Manager system. If set to 0, no limit will be applied.
- Severity: The severity levels of events to be loaded. Available severities include critical, error, warning, and information.
- Impact area: The categories of events to be loaded, such as availability, capacity, configuration, performance, and protection.
- Impact level: The severity levels of the event's impact, such as incident, risk, and event.
Note: To monitor events from Active IQ Unified Manager, you must have access to the REST API.
Monitoring events of OnCommand Unified Manager
Since version 4.0.0 NetAppMonitor ZenPack provides support for monitoring events from OnCommand Unified Manager versions 9.4-9.5. To add monitoring of OnCommand Unified Manager events, it is required to add datasource of 'NetAppMonitor OCUM' type on a device level, and to fill related zProperties like zNetAppOCUMHost, zNetAppOCUMUser, zNetAppOCUMPassword. Events of OnCommand Unified Manager could be filtered by configuring zNetAppOCUMEventFilter. This property can be configured to filter events by:
- triggered time - is a period in hours when events are triggered, by default it is set to one week
- events limit - is a number of events which will be loaded from the OnCommand Unified Manager system, if it is set to 0 limits will be disabled
- event severity - are severities of events which will be loaded from the OnCommand Unified Manager system, there are critical, error, warning, information
- impact area - impact areas of events which will be loaded from the OnCommand Unified Manager system, there are availability, capacity, configuration, performance, protection
- impact level - are impact levels of events which will be loaded from the OnCommand Unified Manager system, there are incident, risk, event.
Note: To monitor events from OnCommand Unified Manager it is required to have access to the REST API.
Custom Threshold Setting
Perform the following steps to set a custom threshold for lag time metric on SnapMirror component.
- Navigate to a template.
- Click Advanced
- Choose Monitoring Templates at the top of the page
- Find NetAppSnapMirror in the list
- Choose a monitoring template for C-Mode or 7-Mode
- Create a threshold.
- Click Add Threshold
- Type the name for threshold
- Choose a type MinMaxThreshold
- Configure your threshold.
- Double-click on your threshold
- Choose a snapmirror_lag_time datapoint from the left list and click on the arrow to the right
- Type a Maximum Value and choose required Severity and Event Class
- Click Save
Pay attention, that you should type the Maximum Value in seconds, so if you want to set, for example, 5 minutes, you should type 300 (60 seconds * 5)
Collecting Additional ZAPI Performance Metrics
Most components are collecting performance metrics from the perf
subsection of the ZAPI calls. When modeling we collect the base uuid and
store the information as a set of component XPath entries.
In most cases, we need to just add a new datapoint to the existing datasource, and then add the appropriate XPath fragment to retrieve the appropriate data.
Be cautious when enabling new metrics as large numbers of components can significantly increase the number of monitored datapoints being collected.
Collecting Additional REST API Performance Metrics
Most components collect performance metrics from the perf counter or base subsections of the REST API calls. During modeling, we collect the base object identifier and store the information as a set of component properties: api_objectname and api_object_key_value_mapping.
For base metrics, you will need to add a new datapoint to the existing datasource and then specify the appropriate path in the API response to retrieve the required data. This path should be entered in the Dict Path property of the datapoint’s configuration.
For perf counter metrics, you will need to add a new datapoint to the existing datasource and specify the Counter Name to retrieve the appropriate data. The Counter Name should be entered in the Counter property of the datapoint’s configuration.
Be cautious when enabling new metrics, as enabling large numbers of components can significantly increase the number of monitored datapoints being collected.
Linking Linux File System Storage Device with NetApp
If zenpack ZenPacks.zenoss.LinuxMonitor is installed and Linux devices under /Server/SSH/Linux use known NetApp devices as NFS servers, then Storage Device property on Linux Filesystem component will be transformed into link to the appropriate NetApp Filesystem
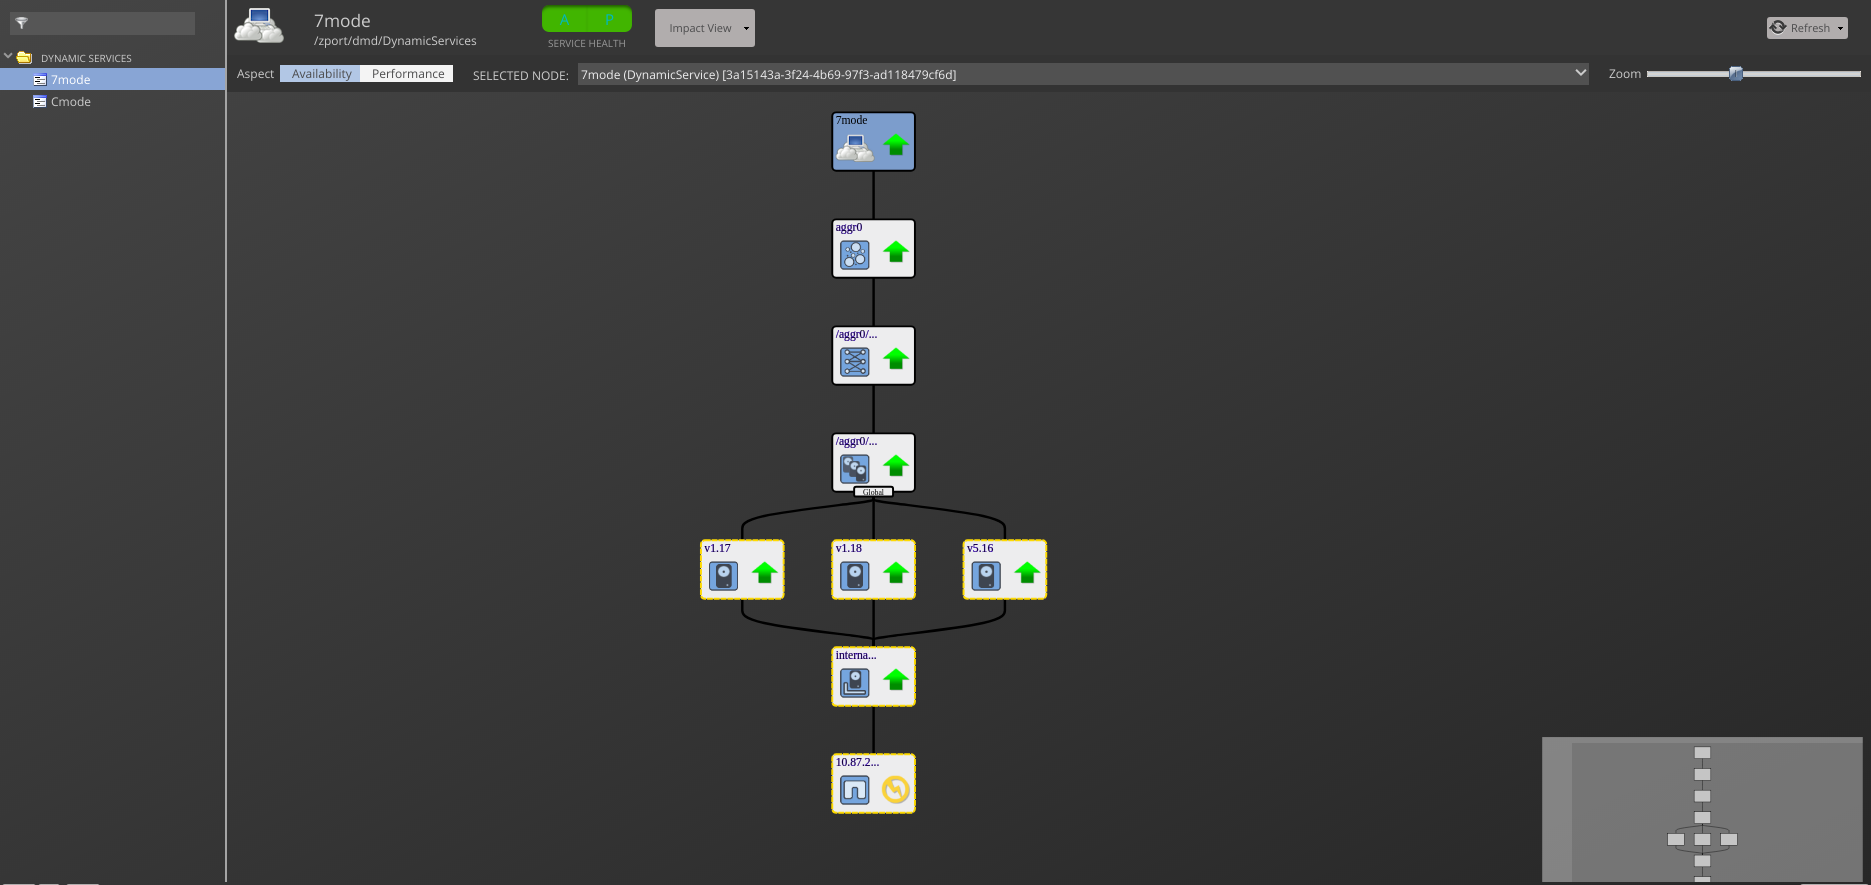
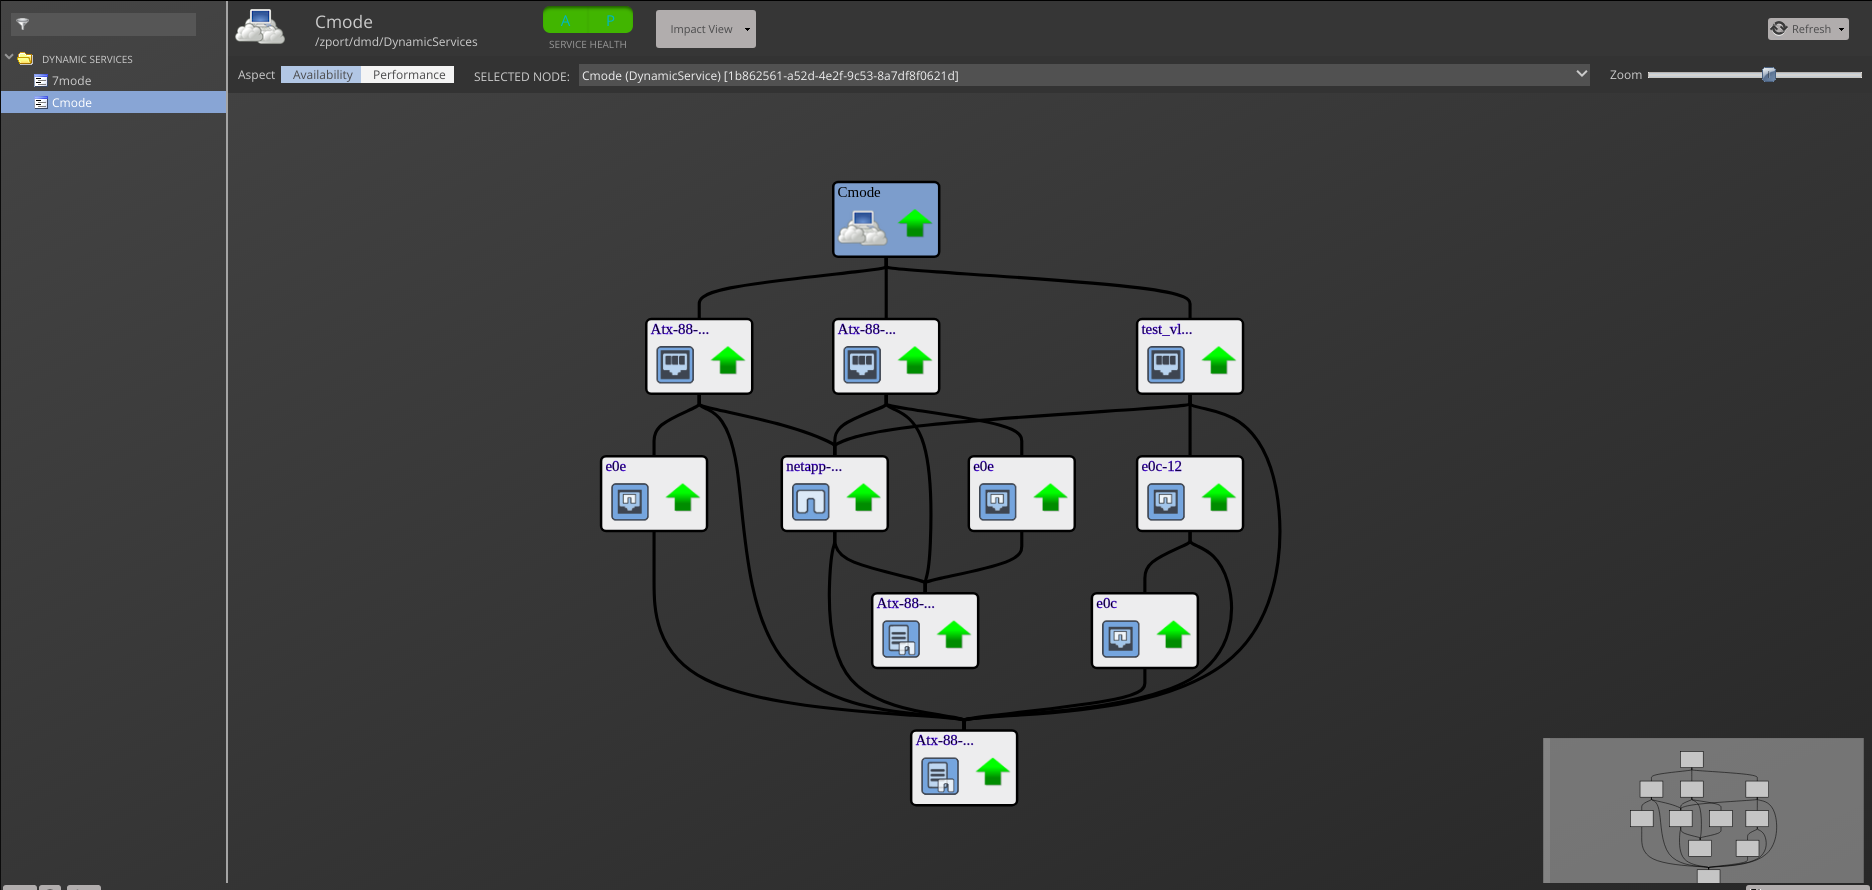
Service Impact
When combined with the Zenoss Service Dynamics product, this ZenPack adds built-in service impact capability for NetApp devices. The following service impact relationships are automatically added. These will be included in any services that contain one or more of the explicitly mentioned entities.
Service Impact Relationships
- System Nodes failure affects related Device, Interfaces and Ports (for C-Mode devices)
- Volume failure affects related Q-Trees, LUNs
- Aggregates, vServers and vFilers failure affects related Volumes
- LUNs failure affects related vServers and File Systems and Interfaces
- Plexes failure affects related Aggregates
- RAID Groups failure affects Plexes
- Hard Disks failure affects related RAID Groups
- Disk Shelves failure affects Hard Disks
- Temperature Sensors and Power Supplies failure affects Disk Shelves
- Interfaces, vServers, vFilers and Disk Shelves are affected by the associated device
- Interfaces affect related FC initiators
- Physical Port failure affects related Virtual Port
- Physical Port failure affects related Port Group
- Physical or Virtual Port or Interface Group failure affects related Interfaces
- Netapp filesystem mounted on the Linux device affects Linux filesystem
- Netapp LUNs affects Linux Hard Disks
- Netapp LUNs affects Windows Hard Disks
- Netapp LUNs affects vSphere Datastores
Zenoss Analytics
NOTE: These steps are applicable only for Zenoss Analytics 5.x.x. In Analytics 6.0.0, any third-party reporting tool can be used to generate reports.
This ZenPack provides additional support for Zenoss Analytics. Perform the following steps to install extra reporting resources into Zenoss Analytics after installing the ZenPack.
- Copy netappmonitor-analytics.zip from
$ZENHOME/ZenPacks/ZenPacks.zenoss.NetAppMonitor*/ZenPacks/zenoss/ NetAppMonitor/analytics/on your Zenoss server. - Navigate to Zenoss Analytics in your browser.
- Login as superuser.
- Remove any existing NetAppMonitor ZenPack folder.
- Choose Repository from the View menu at the top of the page.
- Expand Public in the list of folders.
- Right-click on NetAppMonitor ZenPack folder and choose Delete.
- Confirm deletion by clicking OK.
- Add the new NetAppMonitor ZenPack folder.
- Choose Server Settings from the ''Manage' menu at the top of the page.
- Choose Import in the left page.
- Remove checks from all check boxes.
- Click Choose File to import a data file.
- Choose the netappmonitor-analytics.zip file copied from your Zenoss server.
- Click Import.
You can now navigate back to the NetAppMonitor ZenPack folder in the repository to see the following resources added by the bundle.
Domains
- NetAppMonitor CMode Domain
- NetAppMonitor SevenMode Domain
For Analytics 4.x domains can be used to create Ad Hoc views using the following steps:
- Choose Ad Hoc View from the Create menu.
- Click Domains at the top of the data chooser dialog.
- Expand Public then NetAppMonitor ZenPack.
- Choose the NetAppMonitor Domain domain.
- Select CMode Domain or SevenMode Domain and press OK
For Analytics 5.x domains can be used to create Ad Hoc views using the following steps:
- Choose Ad Hoc View from the Create menu.
- Click on View as Tree button
- Expand Public then NetAppMonitor ZenPack.
- Choose the NetAppMonitor Domain domain.
- Select CMode Domain or SevenMode Domain and press OK
Troubleshooting
Please refer the Zenoss Service Dynamics documentation if you run into any of the following problems:
- ZenPack will not install
- Adding a device fails
- Don't understand how to add a device
- Don't understand how to model a device
If you cannot find the answer in the documentation, then Resource Manager (Service Dynamics) users should contact Zenoss Customer Support. Core users can use the #zenoss IRC channel or the community.zenoss.org forums.
Device Modeling or Monitoring Failed
Recursion error on a large number of records - to eliminate this error the value of zNetAppNumRecordsPerRequest zProperty can be increased to process more records per one request.
During the monitoring of 7-Mode devices, ZenPython logs may indicate that the onSuccess method is being blocked for 10 seconds or more. To address this issue, you can decrease the zNetAppXMLProcessingChunkSize zProperty to process smaller XML chunks.
No links to components from OnCommand/Active IQ Unified Manager related events
Links for a component field of OnCommand/Active IQ Unified Manager related events are build based on a particular property on device level which is filled with IDs of all components existing on NetApp device. For this property to be filled correctly enable modeler plugins for related components and remodel device. Also, it is possible that links between OnCommand Unified Manager related events and components are missing because associated components do not exist on NetApp device in Zenoss.
Some OnCommand/Active IQ Unified Manager related events are not monitored by Zenoss
ZenPack uses timestamps from the NetApp system during adding OnCommand/Active IQ Unified Manager related events. In case if an event is too old based on the event's configuration of the Resource Manager, it will not appear on the device. It is possible to modify this behaviour by changing the configuration of Event Aging Threshold (hours) and Don't Age This Severity and Above properties on Events tab on Advanced page.
Daemons
The following collection daemons are required to collect NetApp data.
- zenmodeler (modeling)
- zenpython (ZAPI performance metrics, REST API-based performance metrics)
- zenperfsnmp (legacy SNMP performance metrics)
- zencommand (legacy command based performance metrics)
Limitations
The current NetAppMonitor ZP version has the following known limitations:
- iSCSI support is only available for NetApp Cluster Mode version 8.3 and higher.
- NFS and LUN clients are excluded from ZAPI.
- HardDisk components with a shared type do not appear in the Disks drop-down for other components.
- LUN components will only be modeled if the Volumes modeler plugin is included in the list of modeler plugins.
- The new ONTAP REST API-based monitoring covers approximately 85% of the metrics provided by ZAPI.
- Temperature Sensors and Power Supplies components will only be modeled if the Disks modeler plugin is included in the list of modeler plugins.
Known Issues
Upgrades to 5.x.x
Starting with version 5.0.0, REST API support is introduced in the NetAppMonitor ZP, offering enhanced capabilities for monitoring NetApp devices. It is recommended to follow these steps to ensure a smooth transition process and avoid any unexpected issues:
-
Remove the Device from the
*/Storage/NetApp/C-Mode*Device Class. -
Re-add the Device to the
*/Storage/NetApp/REST*Device Class using the same management IP Address. Using the same management IP address ensures continuity and avoids any disruption in device, plugins and data sources recognition. There will be no loss of historical data for the same components during this transition.
Note: NetAppMonitor 5.0.0 ZP version supports ZAPI as well as REST API. So, if the target NetApp cluster version supports ZAPI you can continue using the ZAPI-based device classes, plugins and data sources.
Note: For the REST API-based target devices the N/A values are displayed on the Hard Disk graphs in case when disk is present in system, but it isn't attached to aggregate.
Upgrades from 3.6.x
When upgrading from 3.6.x to a newer version, it is recommended to ensure that the 'zenpython' service is shut down prior to upgrading this zenpack, and only restart it once the upgrade is complete. This will eliminate the issue and speed up the upgrade process.
Upgrades to 4.x or above when having '/Storage/NetApp' devices
After upgrade to 4.x or newer version, when there are SNMP based NetApp devices placed under '/Storage/NetApp' - `AttributeError: 'NoneType' object has no attribute 'getRRDDataPoints'` flare could appear when clicking Component graph in UI. This happens because some component templates from the '/Storage/NetApp' were moved down into '/Storage/NetApp/SNMP' device class. Possible solutions:
- Move SNMP NetApp devices into '/Storage/NetApp/SNMP' device class, which has the necessary component templates locally bound to it.
- Alternatively, if devices needed to remain in '/Storage/NetApp' device class, necessary templates from the '/Storage/NetApp/SNMP' device class need to be located and copied to the parent '/Storage/NetApp' level.
Upgrades from versions which are older or equal to 4.1.0
Error events with a message Unable to process COMMAND datasource(s)
for device <device-name> -- skipping may appear after upgrade to
4.1.0 or older version. They are not cleared automatically, so they may
be acknowledged or closed manually. These events occurs only once during
ZenPack upgrade installation and does not affect anything. Further
upgrades (starting from 4.1.0 version) will not produce such events.
Restarting of zproxy
On Zenoss 5.3.3 some of the components may be displayed incorrectly. If this issue is encountered, restart zproxy service (by restarting) top-level "Zenoss.resmgr" application in Control Center. It is not necessary to restart the child services.
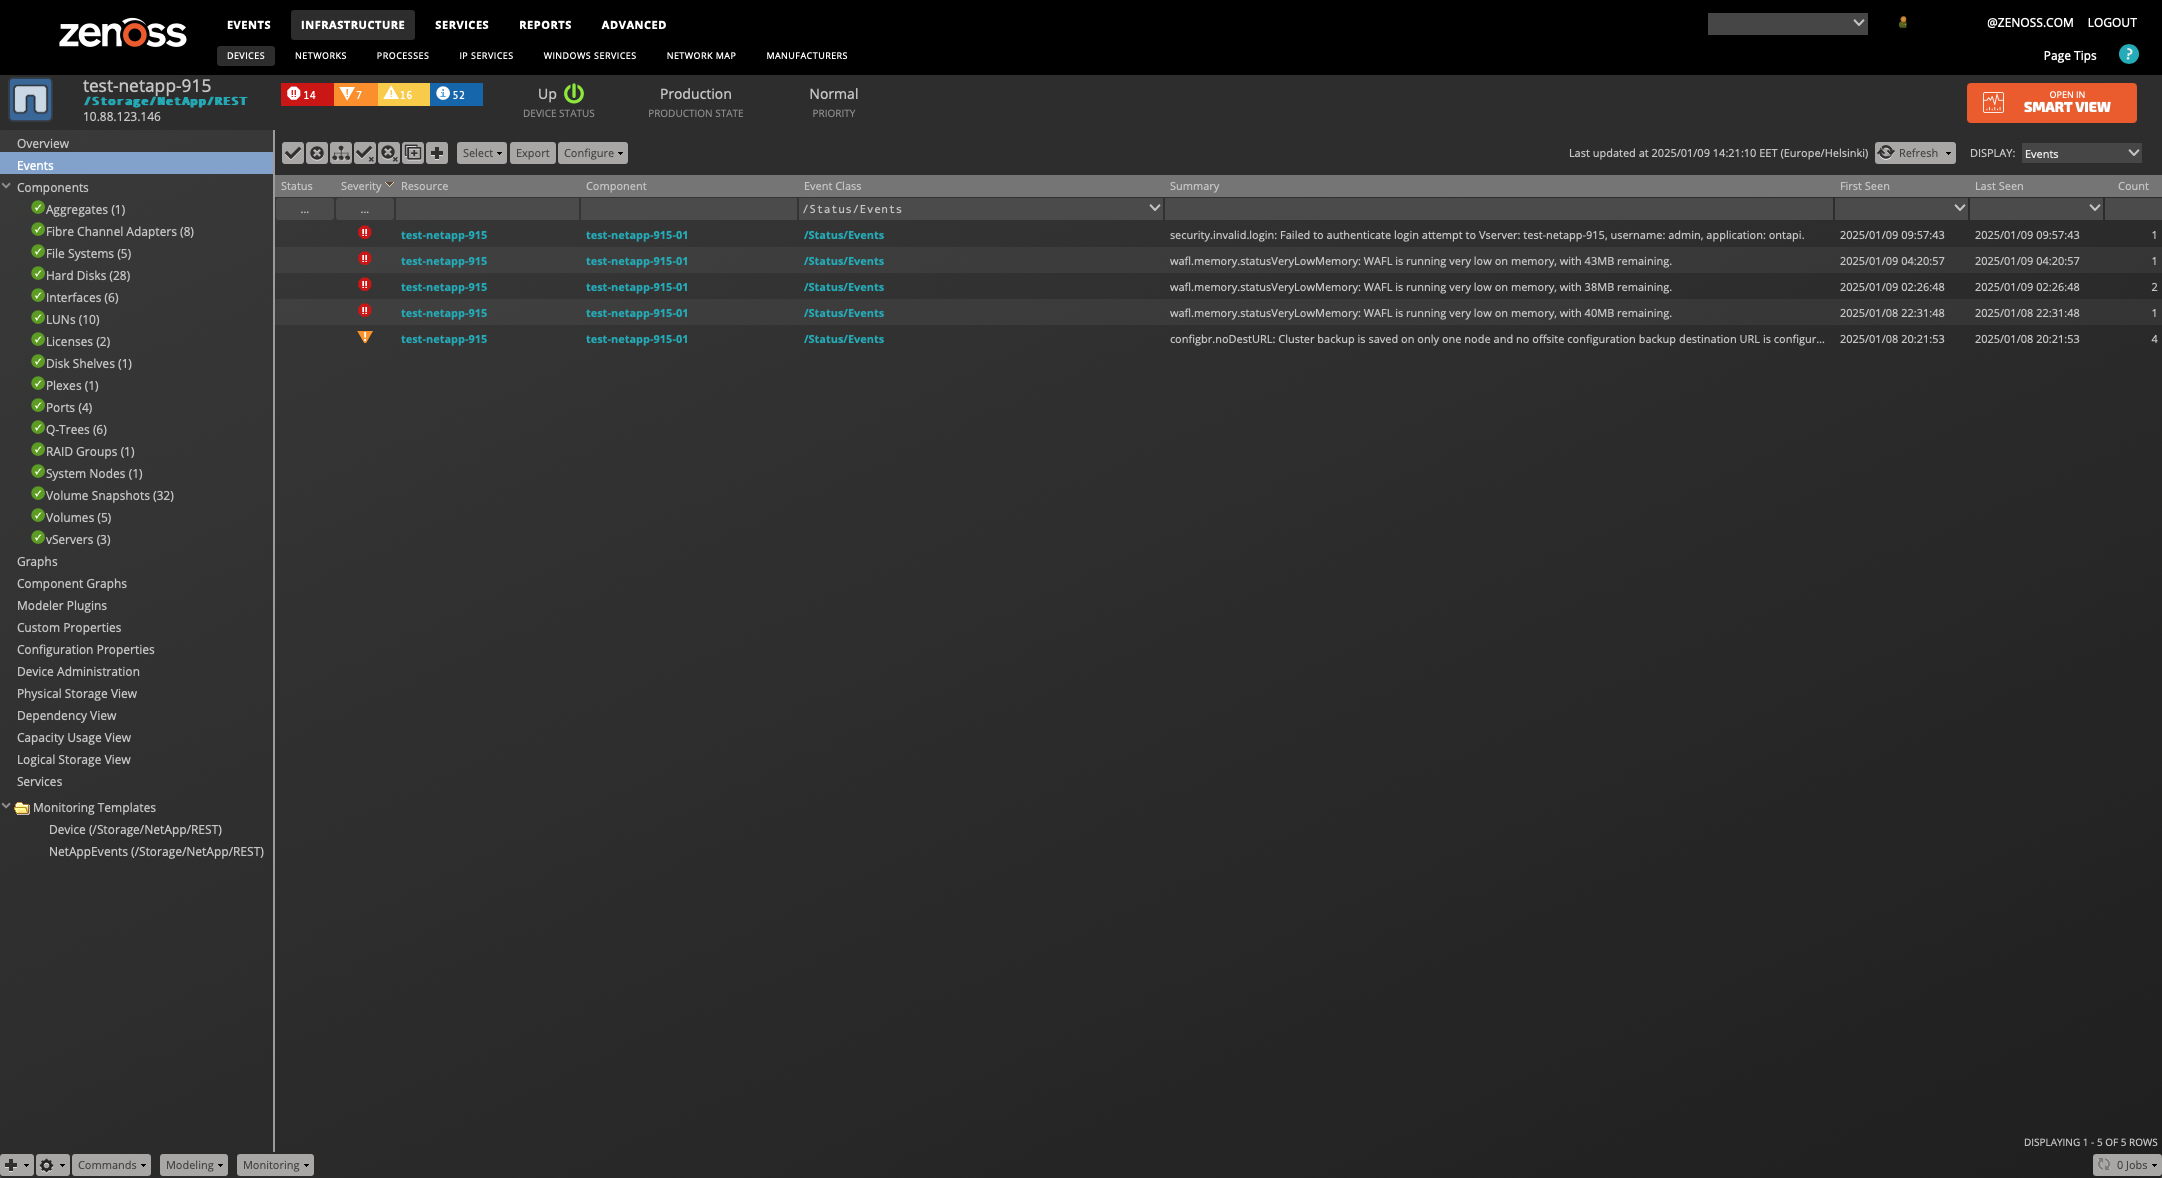
Events Severity Collision
NetApp Monitor ZenPack assigns severity 5 to security.invalid.login events generated on NetApp devices. This can cause dedup collisions from different devices with this particular event. This is due to our event system considering these events to be duplicates by disregarding the event summary. The reason for this is they occur on the same device/component, and NetApp does not give us a way to determine if summaries are different due to some transient information (like 83%) or because they are two distinct issues. If we were to consider such events as non-duplicates, the result would be more events (84%, 85%, etc) and more open incidents. Additionally, such events cannot be cleared automatically.
Changes
5.0.2
- Add support for -replacement and -addition templates (ZPS-9084)
- Fix modeling error on NetApp REST device with Temperature Sensors or Power Supplies (ZPS-9094)
- Fix SNMP command collection on the latest platform versions (ZPS-9204)
- Fix NetApp ONTAP timestamp parsing for events (ZPS-9202)
- Tested with Virtana Service Observability (formerly Zenoss Cloud), Virtana Resource Manager 6.9.0 and Service Impact 5.7.2
5.0.1
- Remove encoded characters from the ZenPack (ZPS-9129)
- Tested with Zenoss Resource Manager 6.8.0, Zenoss Cloud and Service Impact 5.6.0
5.0.0
- Improve Performance Processing XML Data from Large Filers (ZPS-4798)
- Implement new event class and thresholds for Q-Trees (ZPS-4993)
- Add ActiveIQ UM support for Netapp monitoring (ZPS-8044)
- Add support of new ONTAP REST API (ZPS-8400)
- Make distinct API calls for 7-Mode and C-Mode NetApp devices (ZPS-8748)
- Allow customisation of NetApp Event event class (ZPS-8950)
- Tested with Zenoss Resource Manager 6.7.0, Zenoss Resource Manager 6.8.0 Zenoss Cloud and Service Impact 5.6.0
4.2.1
- Add SNMP v3 support (ZPS-7590)
- Add disk's mediator state support (ZPS-6756)
- Update deprecated OIDs (ZPS-7794)
- Fix modeling error during LUN mapping (ZPS-7230)
- Tested with Zenoss Resource Manager 6.7.0, Zenoss Cloud and Service Impact 5.5.5
4.1.0
- Add separate monitoring and modeling for Volume Data sector and Total Volume Utilization. Add Volume Snapshot reserve utilization monitoring for C-Mode (ZPS-6606)
- Add Total Volume size property which includes Data sector and Snapshot reserve size (ZPS-6947)
- Fix bad Impact relations left after upgrading from 3.7.0 version of ZenPack (ZPS-6248)
- Fix modelling error when SnapMirror Volumes Resides on a Different Device during SnapMirror Replication (ZPS-6516)
- Fix modelling failure due to missing/unknown component (ZPS-6468)
- Fix Storage Capacity Threshold flood OpenTSDB with Metric Requests (ZPS-6474)
- Fix Volume state absence/changing issue in case if any device volume is MetroCluster mirror. Add identifier for such volumes (ZPS-6947)
- Tested with Zenoss Resource Manager 6.5.0, Zenoss Cloud and Service Impact 5.5.1
4.0.0
- Add SNMP datapoints and new graphs on device level and for LUN and HardDisk components (ZPS-2451)
- Add support for monitoring events of OnCommand Unified Manager (ZPS-2961)
- Convert monitoring templates to ZPL format (ZPS-4326)
- Convert NetApp components to ZPL format (ZPS-4326)
- Extend support of SNMP monitoring with additional datapoints and events (ZPS-2451)
- Fix thresholds for inode usage for offline volumes (ZPS-5394)
- Improve Impact and Dependency View relations (ZPS-4326)
- Move frequently changing metrics from modeling to monitoring (ZPS-5114)
- Tested with Zenoss Resource Manager 6.3.2, Zenoss Cloud and Service Impact 5.3.4
3.7.0
- Add capacity thresholds
- Add missing /Status/Events event class (ZPS-2404)
- Add monitoring IOPS for HardDisk components (ZPS-2370)
- Add new components: vFiler, Power Supply, Temperature Sensors and Snap Mirrors (ZPS-1372)
- Add the new zProperty - zNetAppMonitoringInterval, to handle monitoring cycle time
- Correct aliases for datapoints for QTree components (ZPS-2323)
- Fix NetApp SNMP file system check error (ZPS-1855)
- Fix StorageEnclosure and Aggregate SNMP monitoring (SVC-1192)
- Fix duplicate aliases (ZEN-29093)
- Update events mapping for C-Mode Events ZAPI datasource (ZPS-4626)
- Updates and fixes for SNMP devices
- Tested with Zenoss Resource Manager 5.3.3, Zenoss Resource Manager 6.2.1, Zenoss Cloud and Service Impact 5.3.4
3.6.0
- Add support 9.2(C-Mode) ONTAP API version
- Add monitoring usage for QTree components (ZPS-410)
- Add Auto-Sizing monitoring for Volume components (ZPS-2007)
- Fix speed property for thresholds for C-Mode Interface components (ZPS-1448)
- Fix issue related to missing monitoring data for NetApp C-Mode FileSystem components (ZPS-2047)
- Set correct logging level during modeling PowerSupply components (ZPS-1847)
- Update transformation for /Perf/FileSystem/NetApp event class (ZPS-2024)
- Tested with Zenoss Resource Manager 5.2.6, Zenoss Resource Manager 4.2.5 RPS 743 and Service Impact 5.1.7
3.5.0
- Improve performance during monitoring NetApp devices
- Fix recursion error for a specific case regarding modeling of QTree components
- Fix bug with removing or adding components during monitoring
- Fix monitoring statuses for 7-Mode interfaces
- Fix connection timeout issue during monitoring 7-Mode devices
3.4.2
- Add support 9.0(C-Mode) ONTAP API version
- Add Port component
- Add status monitoring for "vServer" and "Disk Shelf" components
- Fix ZEN-21557 (attribute error during modeling and monitoring)
- Fix ZEN-22440 (UTF8 monitoring issue)
- Fix ZEN-18846 (recursion error on a large number of records)
- Fix issue with negative scale for graphs
- Fix ZEN-21145 (fails to upgrade earlier version)
- Fix performance issue during modeling NFS Client components
- Fix modeling operational status and speed properties for virtual Interface components
3.3.0
- Fix ZEN-20626 (fixed modeling for interfaces with not full data set)
3.2.0
- Add Fibre Channel support
3.1.0
- Fix ZEN-15678 (/Status/Perf/ should be /Status/Perf)
- Fix ZEN-15558 (Proper formatting of Aggregate Events)
- Fix ZEN-13476 (Generate Events on Disk Failure)
- Use iter protocol for performance metrics
- Fix component templates to specify the proper id
- Fix inode percentage display
- Fix volume.asynchronous_frees datapoint
- Event management for EMS messages on C-Mode Filers
- Fix bug with incorrect displaying "Physical Storage View"
3.0.6
- Add status monitoring for "Volumes" and "LUNs" components
- Add support 8.2(7-Mode, C-Mode) and 8.3(C-Mode) ONTAP API version