Docker
ZenPacks.zenoss.Docker
This ZenPack provides support for monitoring Docker and Podman containers running on Linux devices.
Docker versions through 29.2.1 and Podman versions through 4.9.4 are known to be supported in Docker ZenPack as of March, 2026.
The features added by this ZenPack can be summarized as follows. They are each detailed further below.
- Discovery and periodic remodeling of Docker and Podman containers.
- Optional status and performance monitoring of Docker and Podman containers.
- Service impact and root cause analysis.
Applications Monitored: Docker (1.6 and later), Podman (2.2.1 and later)
Open Source
This ZenPack is developed and supported by Zenoss Inc. Contact Zenoss to request more information regarding this or any other ZenPacks. Click here to view all available Zenoss Open Source ZenPacks.
License
GNU General Public License, Version 2, or later
Releases
Version 2.2.0 Download
- Released: 2026-03-09
- Requires: ZenPackLib ZenPack
- Compatible with Virtana Service Observability (formerly Zenoss Cloud) and Virtana Resource Manager 6.x
Version 2.1.1 Download
- Released: 2022-06-08
- Requires: ZenPackLib ZenPack
- Compatible with Virtana Service Observability (formerly Zenoss Cloud) and Virtana Resource Manager 6.x
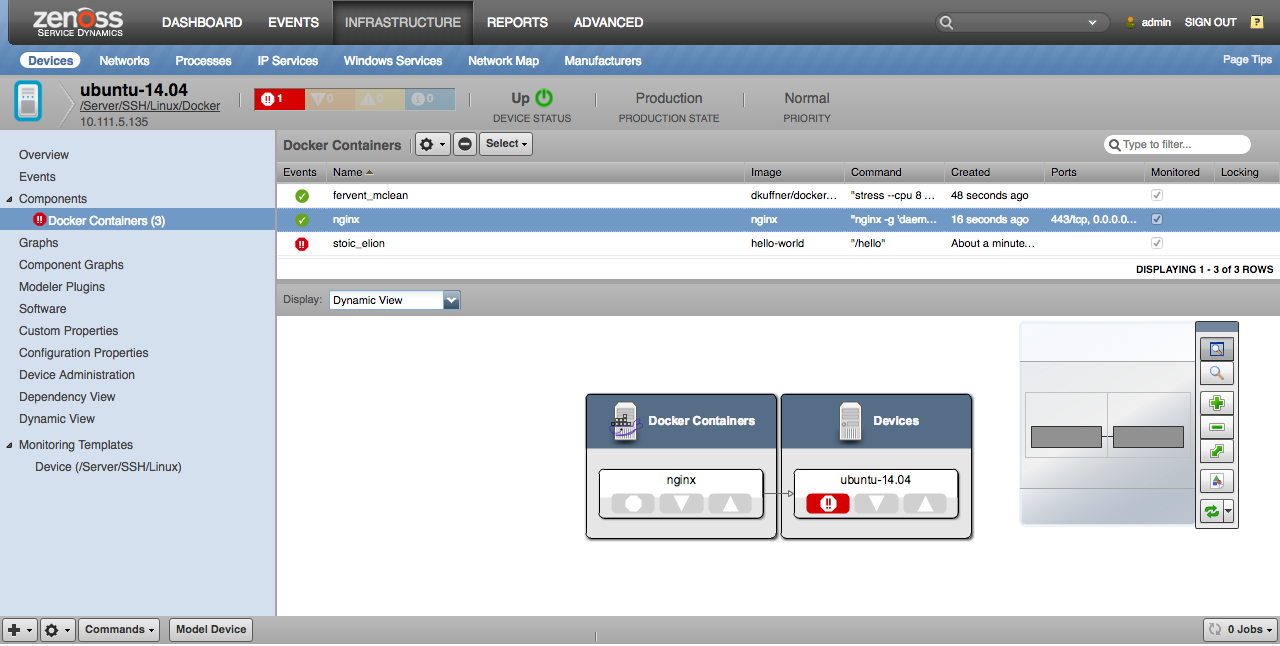
Discovery
The following components and properties will be automatically discovered when the DockerCollector modeler plugin is enabled for Linux devices running Docker.
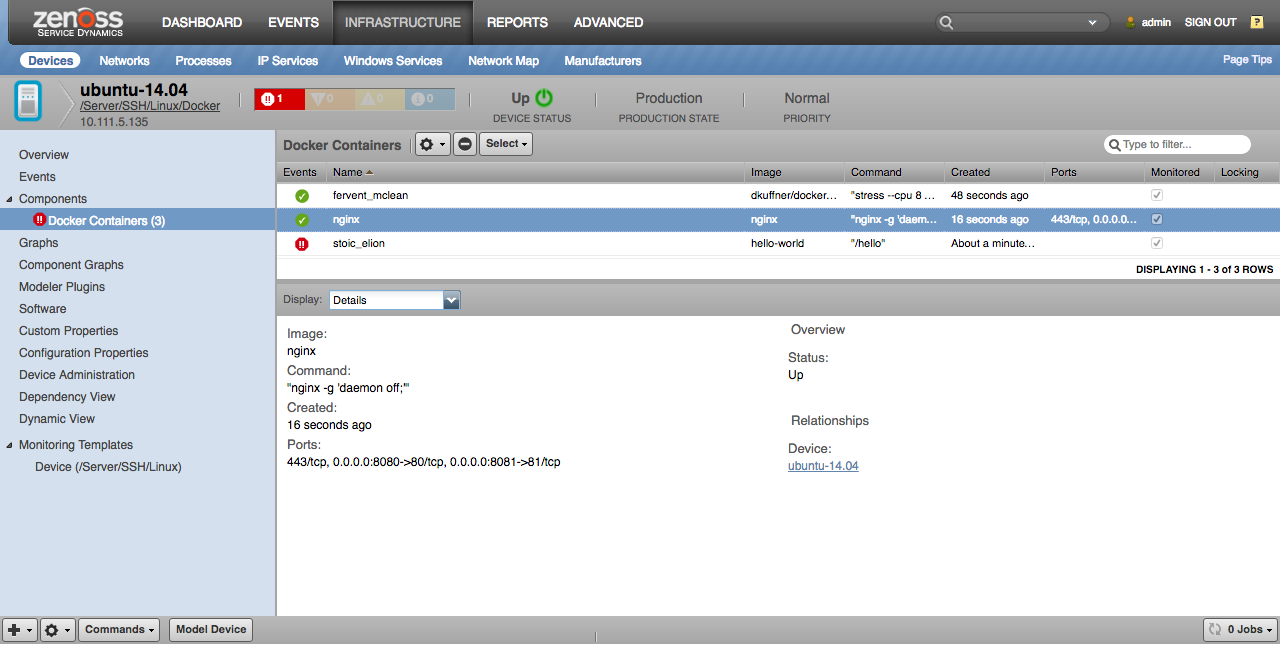
Docker Host (Linux Device)
- Properties: Docker Version
- Relationships: Docker Containers
Docker Container
- Properties: ID, Title (Name), Image, Command, Ports, Created
This information is obtained by running the following commands on the Linux device via SSH.
docker -vsudo docker ps -a --no-trunccat /proc/self/mountinfo
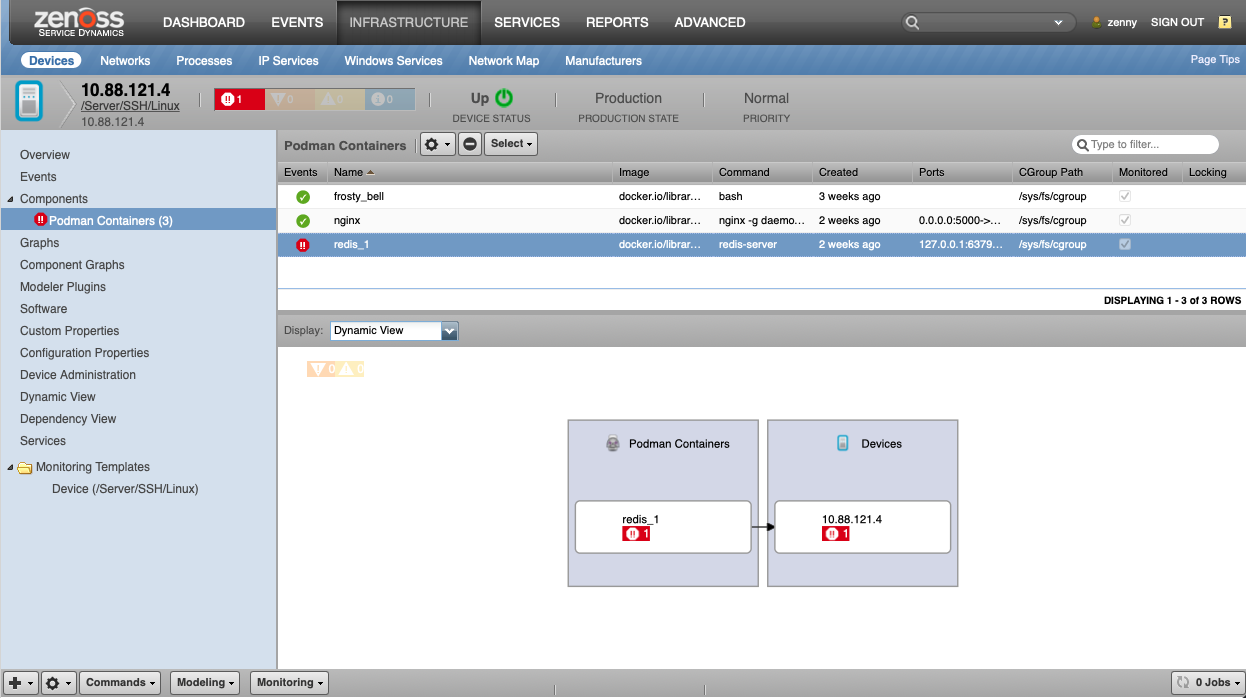
The following components and properties will be automatically discovered when the PodmanCollector modeler plugin is enabled for Linux devices running Podman.
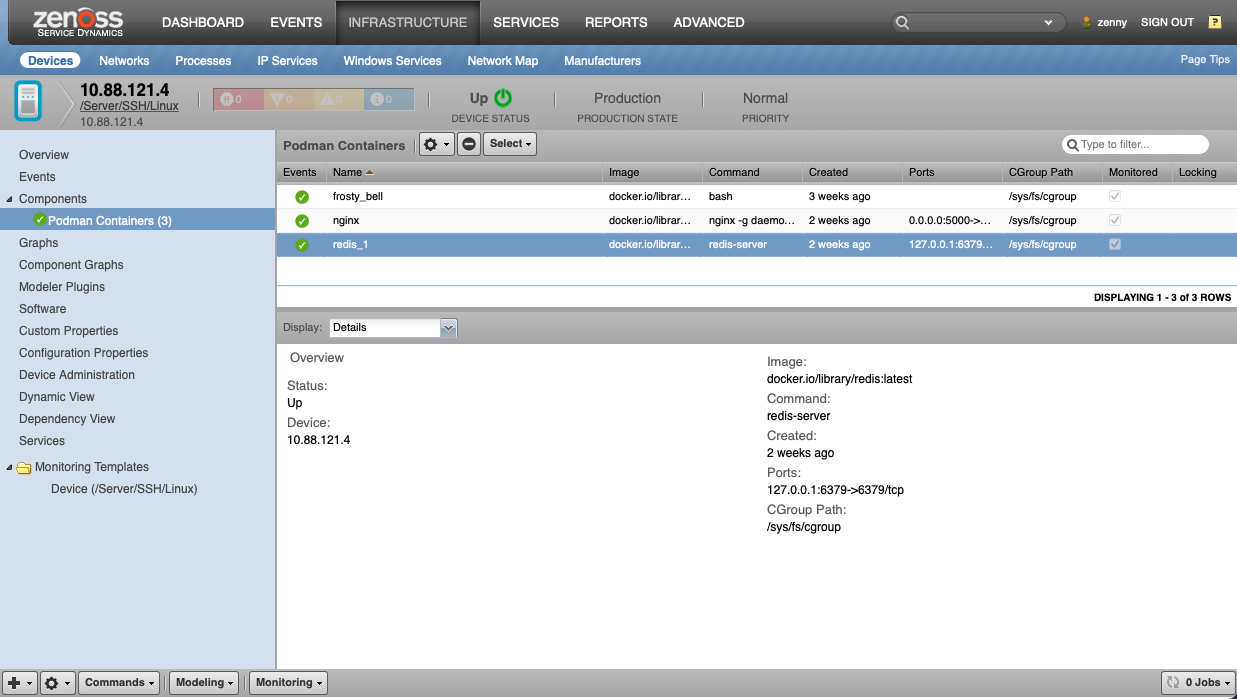
Podman Host (Linux Device)
- Properties: Podman Version
- Relationships: Podman Containers
Podman Container
- Properties: ID, Title (Name), Image, Command, Ports, Created
This information is obtained by running the following commands on the Linux device via SSH.
podman -vsudo podman ps -a --no-trunccat /proc/self/mountinfo
As with all SSH modeling, the zCommandUsername, zCommandPassword, and zKeyPath configuration properties are used to establish the SSH connection. For password authentication, zCommandUsername and zCommandPassword must be set. For public key authentication, zCommandUsername and zKeyPath must be set. The value of zCommandPassword will be used as the passphrase if the key file provided by zKeyPath requires a passphrase.
Note
The DockerCollector and PodmanCollector modeler plugins are not enabled by default for any device classes. Typically you would add it to the /Server/SSH/Linux device class so all Linux devices being monitored via SSH will have any containers discovered. Alternatively you could create a /Server/SSH/Linux/Docker or /Server/SSH/Linux/Podman device class under which you placed all of your Linux devices that operate as Docker or Podman hosts, and only add the DockerCollector/PodmanCollector modeler plugin for it.
Monitoring
Three types of monitoring are performed for all discovered Docker and Podman containers:
- Status
- Statistics
- Size
The monitoring of each of these aspects has been separated so that you can choose which you are interested in monitoring more easily.
Note
The default value of zCommandCommandTimeout is 15 seconds. This may not be long enough for the monitoring commands detailed below to execute. It is recommended that this value be increased to 60 seconds if status and statistics monitoring are enabled. It is recommended that this value be increased to 600 seconds if size monitoring is enabled.
Docker Status Monitoring
When either zDockerMonitorContainerStatus or zDockerMonitorContainerSize are enabled, the status of the docker daemon will be checked once per minute (for zDockerMonitorContainerStatus) or once every ten minutes (for zDockerMonitorContainerSize) by running one of the following commands respectively.
/usr/bin/env sudo docker ps -a --no-trunc/usr/bin/env sudo docker ps -a -s --no-trunc
An error event such as the following will be created if either of these commands results in an error instead of a list of containers.
Docker Error Event
- summary: received unexpected output from docker ps
- severity: error (4)
- eventClassKey: docker-ps-status
- eventKey: docker-ps-status
- component: docker (unlinked)
- device: example-device-id
- docker_command:
- docker_output:
A clear event such as the following will be created if the above commands properly result in a list of containers.
Docker Clear Event
- summary: received expected output from docker ps
- severity: clear (0)
- eventClassKey: docker-ps-status
- eventKey: docker-ps-status
- component: docker (unlinked)
- device: example-device-id
- docker_command:
- docker_output:
The ZenPack installs a docker-ps-status event class mapping into the /Status event class to handle these events by default. You can create an alternative mapping for the docker-ps-status eventClassKey with a lower sequence number if you wish to handle these events differently.
Podman Status Monitoring
When either zPodmanMonitorContainerStatus or zPodmanMonitorContainerSize are enabled, the status of the Podman will be checked once per minute (for zPodmanMonitorContainerStatus) or once every ten minutes (for zPodmanMonitorContainerSize) by running one of the following commands respectively.
/usr/bin/env sudo podman ps -a --no-trunc/usr/bin/env sudo podman ps -a -s --no-trunc
An error event such as the following will be created if either of these commands results in an error instead of a list of containers.
Podman Error Event
- summary: received unexpected output from podman ps
- severity: error (4)
- eventClassKey: podman-ps-status
- eventKey: podman-ps-status
- component: podman (unlinked)
- device: example-device-id
- podman_command:
- podman_output:
A clear event such as the following will be created if the above commands properly result in a list of containers.
Podman Clear Event
- summary: received expected output from podman ps
- severity: clear (0)
- eventClassKey: podman-ps-status
- eventKey: podman-ps-status
- component: podman (unlinked)
- device: example-device-id
- podman_command:
- podman_output:
The ZenPack installs a podman-ps-status event class mapping into the /Status event class to handle these events by default. You can create an alternative mapping for the podman-ps-status eventClassKey with a lower sequence number if you wish to handle these events differently.
Container Status Monitoring
When zDockerMonitorContainerStatus or zPodmanMonitorContainerStatus is enabled, the status of each Docker/Podman container will be checked once per minute by running the following commands.
- Docker Containers status:
/usr/bin/env sudo docker ps -a --no-trunc - Podman Containers status:
/usr/bin/env sudo podman ps -a --no-trunc
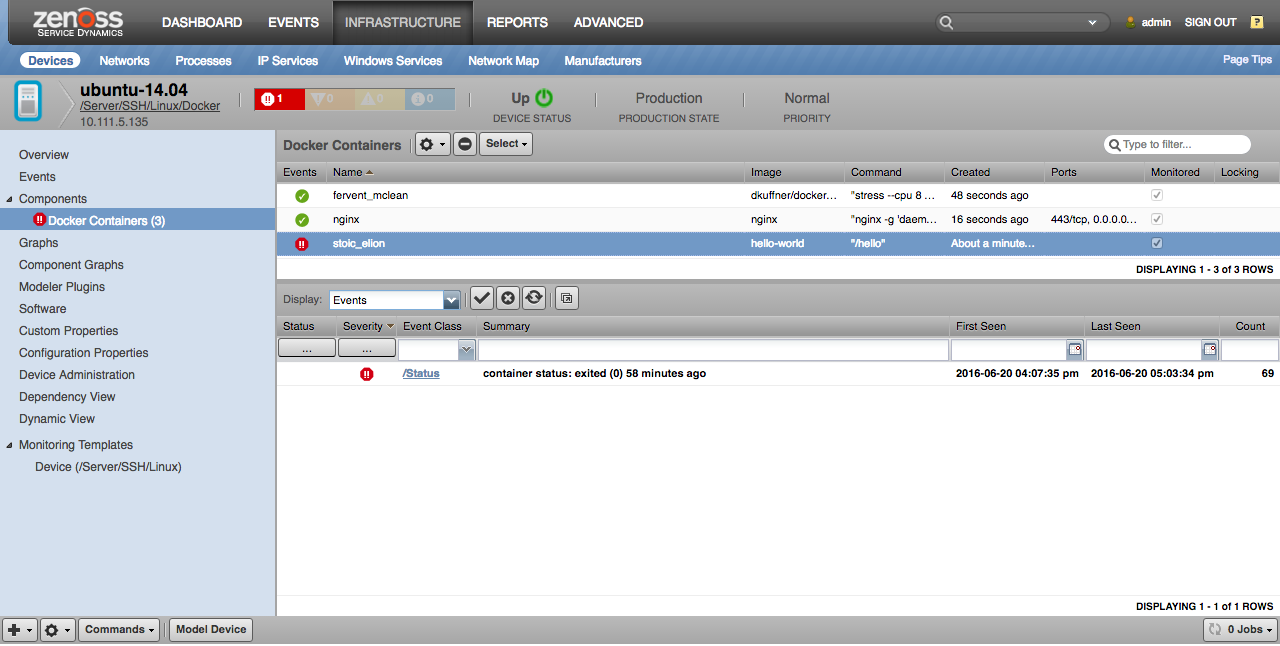
Containers with any status other than "Up" or "Created" will result in a critical event being created for the container with the following example fields.
Docker Clear Down Event
- summary: container status: exited (0) 31 minutes ago
- severity: critical (5)
- eventClassKey: dockerContainerStatus
- eventKey: dockerContainerStatus
- component: docker-container-id
- device: example-device-id
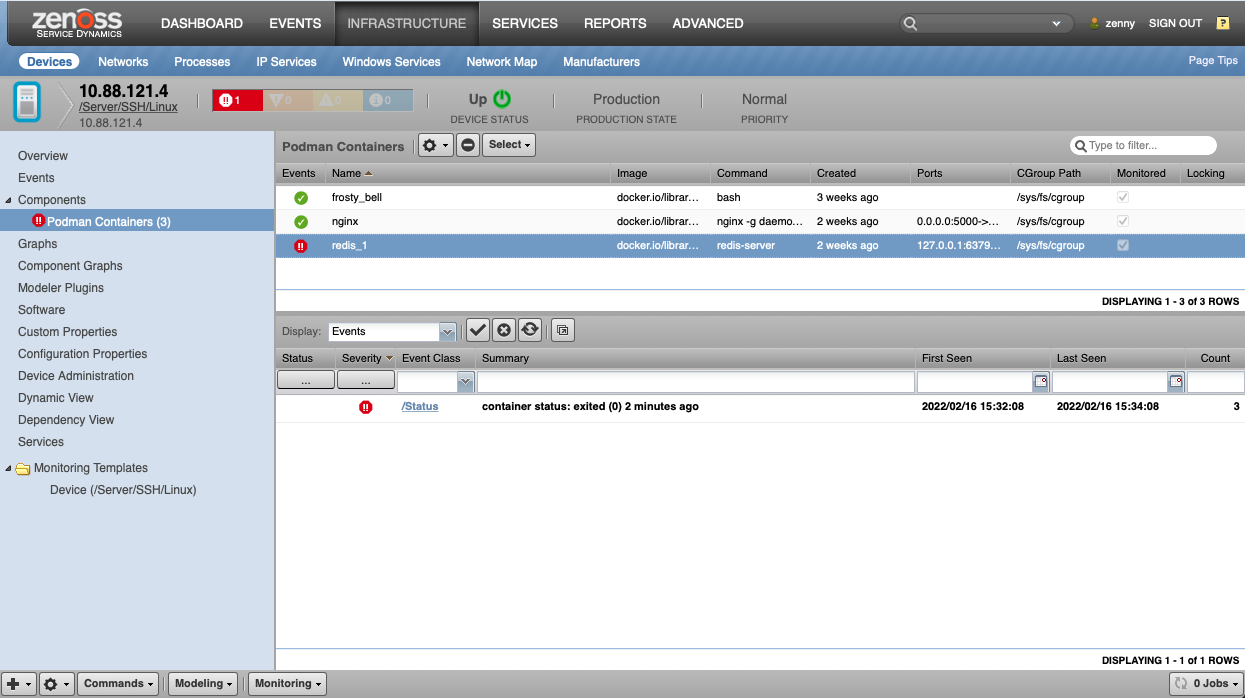
Podman Clear Down Event
- summary: container status: exited (0) 31 minutes ago
- severity: critical (5)
- eventClassKey: podmanContainerStatus
- eventKey: podmanContainerStatus
- component: podman-container-id
- device: example-device-id
Containers with an "Up" or "Created" status will result in a clear event being created for the container with the following example fields.
Docker Container Up Event
- summary: container status: up
- severity: clear (0)
- eventClassKey: dockerContainerStatus
- eventKey: dockerContainerStatus
- component: docker-container-id
- device: example-device-id
Podman Container Up Event
- summary: container status: up
- severity: clear (0)
- eventClassKey: podmanContainerStatus
- eventKey: podmanContainerStatus
- component: podman-container-id
- device: example-device-id
The ZenPack installs a dockerContainerStatus and podmanContainerStatus event class mapping into the /Status event class to handle these events by default. You can create an alternative mapping for the dockerContainerStatus or podmanContainerStatus eventClassKey with a lower sequence number if you wish to handle these events differently.
Note
Container status monitoring is disabled by default because container down events will only auto-clear if the same container is restarted. If the container is left in a non-running state, or if it is removed, its event must be manually cleared. If auto-clearing is important you may want to consider using Zenoss' normal process monitoring support to monitor the process(es) running within the container instead of monitoring the container.
Container Statistics Monitoring
When zDockerMonitorContainerStats or zPodmanMonitorContainerStats is enabled, the statistics of each Docker/Podman container will be collected once every five minutes by running the following commands.
/usr/bin/env sudo -u ${here/zContainerCommandUser} docker stats --no-stream --no-trunc --format '{{.Name}},{{.ID}},{{.CPUPerc}},{{.MemUsage}},{{.MemPerc}},{{.NetIO}},{{.BlockIO}},{{.PIDs}}'/usr/bin/env sudo -u ${here/zContainerCommandUser} podman stats --no-stream --format '{{.Name}},{{.ID}},{{.CPUPerc}},{{.MemUsage}},{{.MemPerc}},{{.NetIO}},{{.BlockIO}},{{.PIDs}}'
These two commands capture the docker stats and podman stats CPU, memory, and IO usage. They will work regardless of whether the cgroupfs or systemd driver are used.
Note
You can use zContainerCommandUser property to specify the user to run the commands as. By default, the commands are run as the root user. For non-root users, monitoring is only available for OSs with cgroup v2.
The following datapoints are parsed from the results of these commands.
CPUPerc-
Description: CPU usage percentage.
-
Provenance: Value of CPUPerc for container.
-
Units: percentage
MemPerc-
Description: Memory usage percentage.
-
Provenance: Value of MemPerc for container.
-
Units: percentage
MemUsageUsed-
Description: Memory usage for container.
-
Provenance: Value of MemUsageUsed for container.
-
Units: bytes
MemUsageLimit-
Description: Memory usage limit for container. (n/a indicates no limit)
-
Provenance: Value of MemUsageLimit for container.
-
Units: bytes or n/a
BlockIORead-
Description: Rate of IO read bytes for container.
-
Provenance: Value of BlockIORead for container.
-
Units: bytes per second
BlockIOWrite-
Description: Rate of IO write bytes for container.
-
Provenance: Value of BlockIOWrite for container.
-
Units: bytes per second
NetIORead-
Description: Rate of network IO read bytes for container.
-
Provenance: Value of NetIORead for container.
-
Units: bytes per second
NetIOWrite-
Description: Rate of network IO write bytes for container.
-
Provenance: Value of NetIOWrite for container.
-
Units: bytes per second
PIDs-
Description: Number of processes running in container.
-
Provenance: Value of PIDs for container.
-
Units: process count
The following graphs are built using these datapoints.
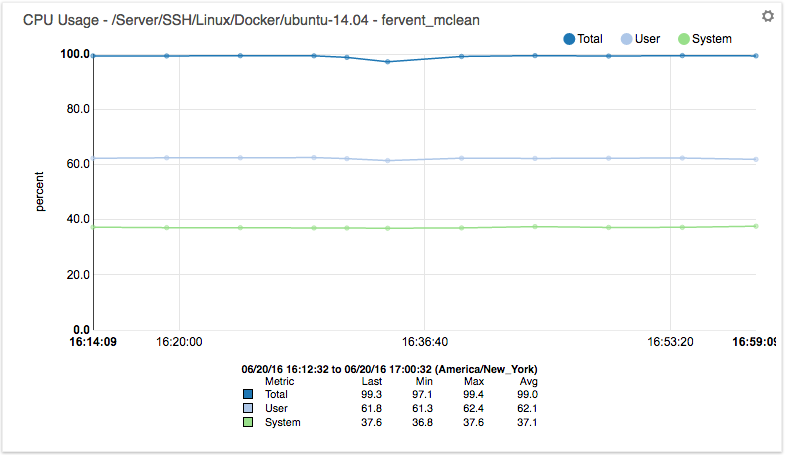
CPU Usage (percent): CPU
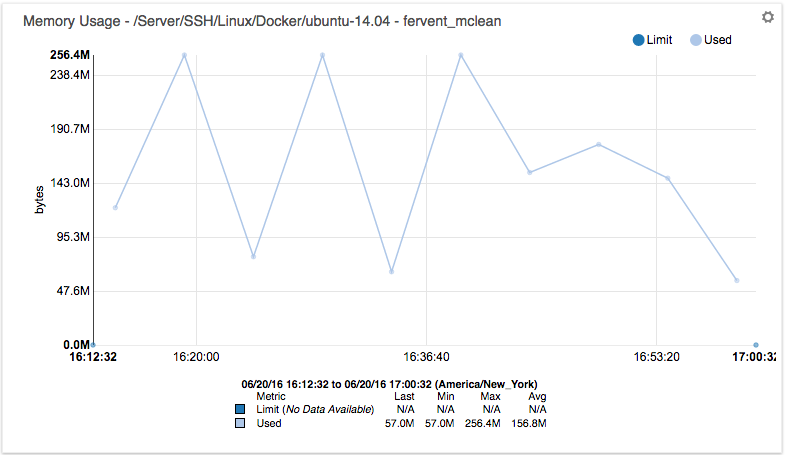
Memory Usage (bytes): Used, Limit
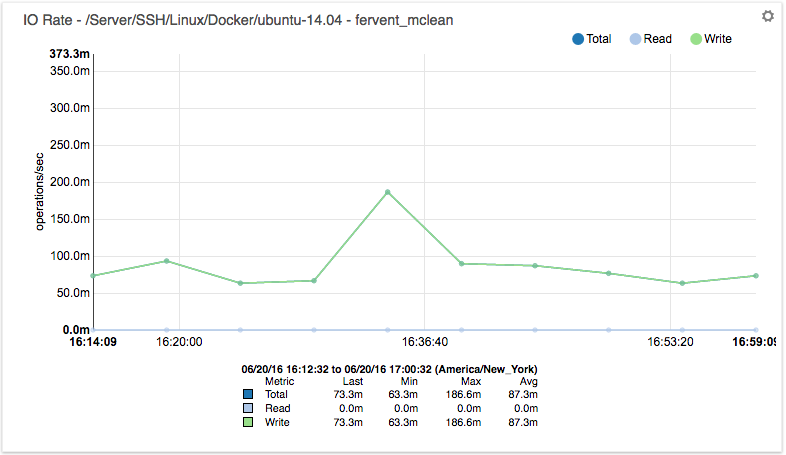
Block IO (bytes/sec): Read, Write
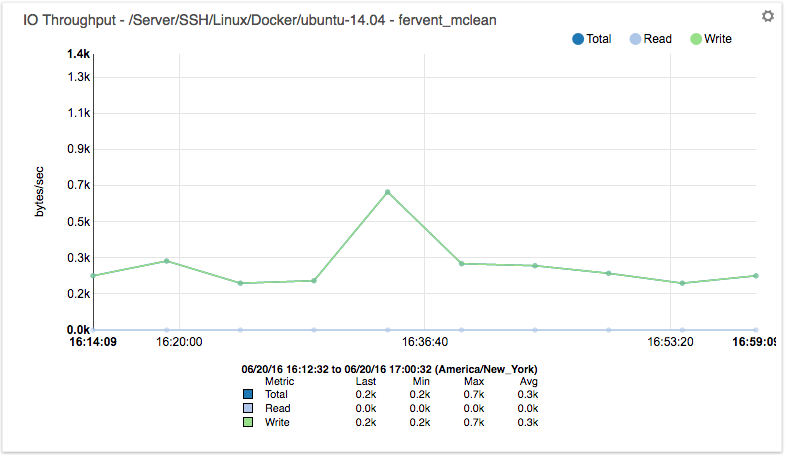
Net IO (bytes/sec): Read, Write
Note
Starting from version 2.2.0 Docker ZenPack supports modeling and monitoring of Docker and Podman containers which are running on OSs with cgroup v2.
Container Size Monitoring
When zDockerMonitorContainerSize or zPodmanMonitorContainerSize is enabled, the real size and virtual size of each Docker/Podman container will be monitored once every ten minutes by running the following command.
- Docker Containers size:
/usr/bin/env sudo docker ps -a -s --no-trunc 2> /dev/null - Podman Containers size:
/usr/bin/env sudo podman ps -a -s --no-trunc 2> /dev/null
Note: zDockerMonitorContainerSize and
zPodmanMonitorContainerSize are not enabled by default. The
reason for this is that adding -s flag to docker ps or podman ps can result in the command taking a very long time to run when many containers, or large containers are used. It is recommended
that you attempt to run the command on your Docker/Podman hosts manually and
see that it takes less than 10 minutes to execute before enabling
zDockerMonitorContainerSize or zPodmanMonitorContainerSize.
Note: Older versions of Docker only report real size, not virtual size. The exact version cut-off isn't known, but Docker 1.6.2 is known to not report virtual size.
The following datapoints are parsed from the results of this command.
size_size
- Description: Actual space used by this specific container.
- Provenance: First number in the SIZE column of 'docker/podman ps -s' converted to bytes.
- Units: bytes
size_size_virtual
- Description: Virtual size of container including image layers that may be shared with other containers.
- Provenance: Parenthetical number in the SIZE column of
docker/podman ps -sconverted to bytes. - Units: bytes
The following graph is built using these datapoints.
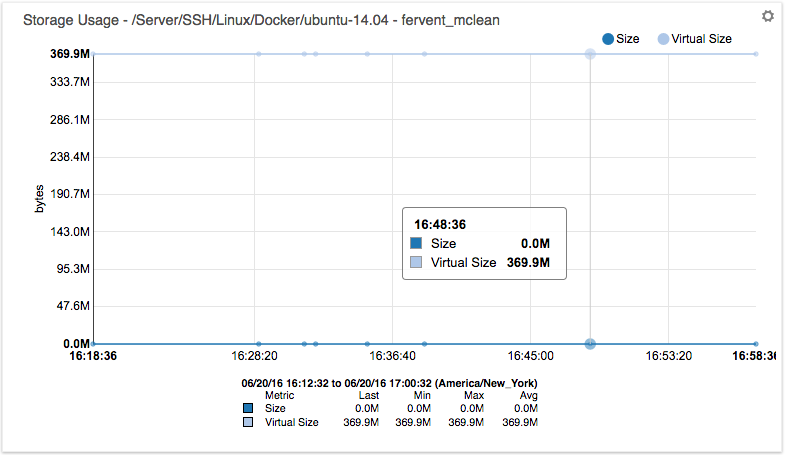
Storage Usage: Size: Virtual Size
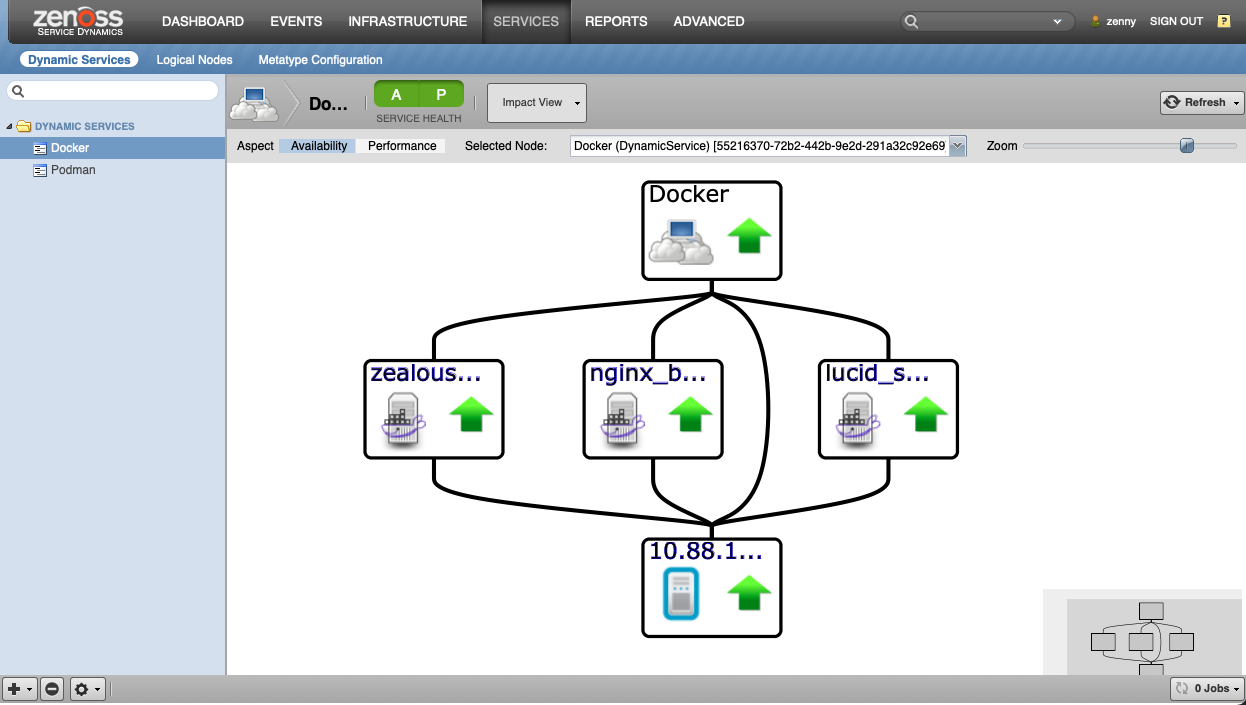
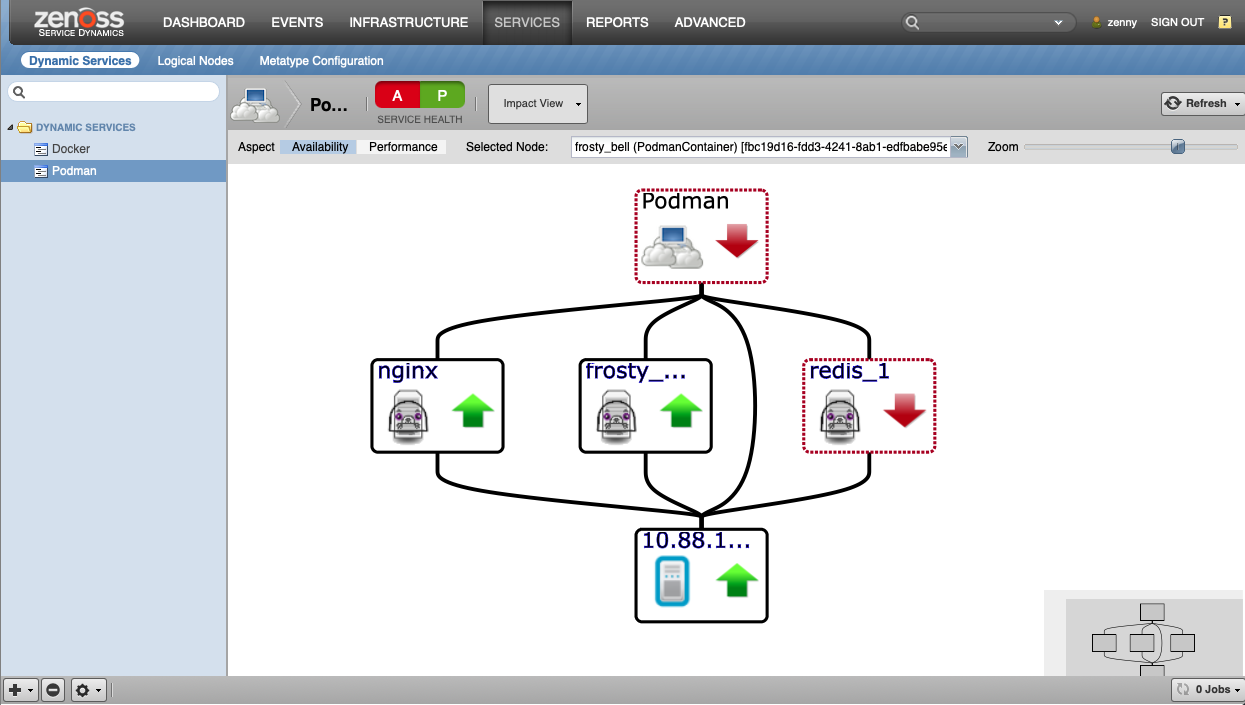
Service Impact
When combined with the Service Impact, this ZenPack adds built-in service impact capability for Docker Containers and Podman Containers. The following service impact relationships are automatically added. These will be included in any services containing one or more of the explicitly mentioned entities.
Usage
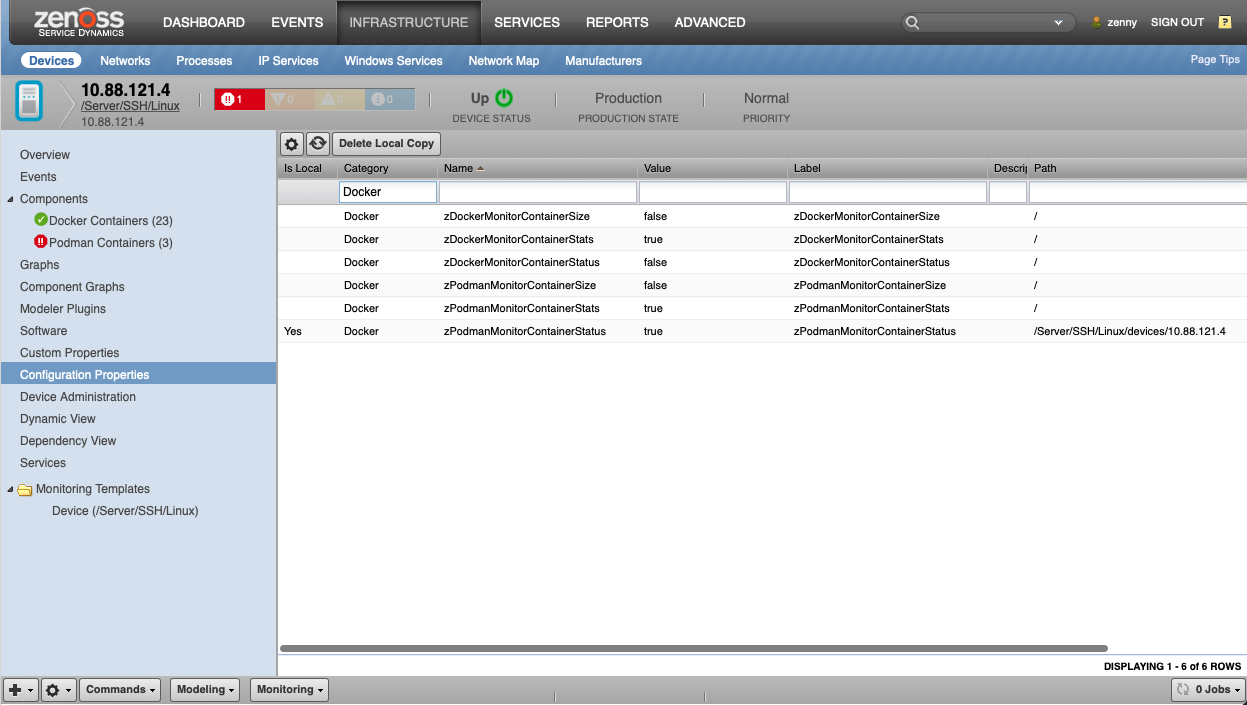
To begin discovering and monitoring Docker and Podman containers you must start by deciding what kind of monitoring you want to perform. There are three configuration properties for Docker containers and three configuration properties for Podman containers that will control how container monitoring is performed.
Configuration properties for Docker containers:
- zDockerMonitorContainerStatus
- zDockerMonitorContainerStats
- zDockerMonitorContainerSize
Configuration properties for Podman containers:
- zPodmanMonitorContainerStatus
- zPodmanMonitorContainerStats
- zPodmanMonitorContainerSize
You can refer to the various container monitoring sections above to understand exactly what the implications of each of these properties are. By default only zDockerMonitorContainerStatus and zDockerMonitorContainerStats are enabled. This is due to a potential performance consideration when monitoring container sizes. See the note above in the Container Size Monitoring section.
After setting these configuration properties to the desired values and depending on container engine type, you must enable the DockerCollector or PodmanCollector modeler plugin for the device class(es) or device(s) for which you want to discover running containers. One possibility would be to create a /Server/SSH/Linux/Docker or /Server/SSH/Linux/Podman device class, and add DockerCollector/PodmanCollector to the list of modeler plugins it will inherit from the /Server/SSH/Linux device class.
SSH Configuration
Docker container discovery and monitoring will occur by running commands on the monitored device with SSH. This SSH connectivity will use the same SSH configuration that is used for normal Linux device monitoring. The following configuration properties can be used to control SSH access.
- zCommandUsername
- zCommandPassword
- zKeyPath
- zCommandCommandTimeout
See the Discovery section for more information on how zCommandUsername, zCommandPassword, and zKeyPath are used. See the Monitoring section for a special note on zCommandCommandTimeout.
sudo Configuration
In addition to SSH access, this ZenPack executes specific commands via sudo both during discovery and monitoring. This means that sudo must be installed on the monitored system, and if zCommandUsername is not root, sudo must be configured to allow the user specified in zCommandUsername permission to run the following commands without specifying a password.
Docker Containers Discovery: sudo docker ps -a --no-trunc
If zDockerMonitorContainerStatus is enabled: /usr/bin/env sudo docker ps -a --no-trunc
If zDockerMonitorContainerSize is enabled: /usr/bin/env sudo docker ps -a -s --no-trunc
If zDockerMonitorContainerStats is enabled:
/usr/bin/env sudo find /sys/fs/cgroup/cpuacct/ -printf "\\n%p\\n" -exec cat {} 2>/dev/null \\;
/usr/bin/env sudo find /sys/fs/cgroup/memory/ -printf "\\n%p\\n" -exec cat {} 2>/dev/null \\;
/usr/bin/env sudo find /sys/fs/cgroup/blkio/ -printf "\\n%p\\n" -exec cat {} 2>/dev/null \\;
Podman Containers Discovery: sudo podman ps -a --no-trunc
If zPodmanMonitorContainerStatus is enabled: /usr/bin/env sudo podman ps -a --no-trunc
If zPodmanMonitorContainerSize is enabled /usr/bin/env sudo podman ps -a -s --no-trunc
If zPodmanMonitorContainerStats is enabled:
/usr/bin/env sudo find /sys/fs/cgroup/cpuacct/ -printf "\\n%p\\n" -exec cat {} 2>/dev/null \\;
/usr/bin/env sudo find /sys/fs/cgroup/memory/ -printf "\\n%p\\n" -exec cat {} 2>/dev/null \\;
/usr/bin/env sudo find /sys/fs/cgroup/blkio/ -printf "\\n%p\\n" -exec cat {} 2>/dev/null \\;
It is also important that sudo be configured to allow running commands without a tty. Specifically this means that a line such as the following in sudoers (visudo) can prevent discovery and monitoring.
Defaults requiretty
You can resolve this by disabling the requiretty option for all users by changing the above line to the following:
Defaults !requiretty
You can also selectively disable requiretty just for the user configured in Zenoss' zCommandUsername configuration property. Assuming that username was zenmonitor, this is how that would look.
Defaults requiretty
Defaults:zenmonitor !requiretty
Services
This ZenPack requires the following services (daemons) to be running.
zenmodeler
- Purpose: Modeling Docker/Podman version and containers.
- Location: All collectors expected to be modeling Docker/Podman.
zencommand:
- Purpose: Monitoring Docker/Podman containers status, statistics, and size.
- Location: All collectors expected to be monitoring Docker/Podman.
Installed Items
Installing this ZenPack will add the following items to your Zenoss system.
Configuration Properties
- zDockerMonitorContainerStatus
- zDockerMonitorContainerStats
- zDockerMonitorContainerSize
- zPodmanMonitorContainerStatus
- zPodmanMonitorContainerStats
- zPodmanMonitorContainerSize
- zContainerCommandUser
Modeler Plugins
- DockerCollector
- PodmanCollector
Monitoring Templates
- DockerContainer-Status (/Devices)
- DockerContainer-Stats (/Devices)
- DockerContainer-Size (/Devices)
- PodmanContainer-Status (/Devices)
- PodmanContainer-Stats (/Devices)
- PodmanContainer-Size (/Devices)
Event Class Mappings
- docker-ps-status (/Status)
- dockerContainerStatus (/Status)
- podman-ps-status (/Status)
- podmanContainerStatus (/Status)
Component Types
- DockerContainer (on related device)
- PodmanContainer (on related device)
Changes
2.2.0
- Update the Docker ZenPack to work with cgroup v2 (ZPS-9076)
- Update ZenPack to support modeling and monitoring Podman containers running for non-root users (ZPS-8697)
- Tested with Virtana Service Observability (formerly Zenoss Cloud), Virtana Resource Manager 6.9.0 and Service Impact 5.7.2
2.1.1
- Improved error handling to support Podman Containers.
- Tested with Zenoss 6.6.0, Zenoss Cloud and Service Impact 5.5.5.0.0
2.1.0
- Added support for Podman Containers. (ZPS-7870)
- Added Impact and DynamicView relations for Podman Containers. (ZPS-8022)
- Tested with Zenoss 6.6.0, Zenoss Cloud and Service Impact 5.5.5.0.0
2.0.5
- Docker Size and Virtual Size are now parsed correctly (ZPS-7037)
- Updated regex data parsing for better compatibility with differing linux distributions (ZPS-7037)
- Fix monitoring on linux that have custom cgroup (ZPS-3483)
- Tested with Zenoss Cloud, Zenoss Resource Manager 6.4.1 and Zenoss Resource Manager 6.5.0
2.0.4
- Ignore the new plugin_name attribute in datamaps
- Tested with Zenoss 5.3.3. 6.1.0, and 6.1.1
2.0.3
- Update to ZenPackLib v2 to address bugs in v1. (ZPS-2934)
- Fix collection of metrics from Kubernetes containers. (ZPS-2935)
- Tested with Zenoss 4.2.5, 5.3.3. 6.1.0, and 6.1.1
2.0.2
- Fix disabling of Dynamic View of non-Docker components. (ZPS-703)
2.0.1
- Disable container status monitoring by default. (ZEN-24043)
2.0.0
- Transparently support cgroupfs and systemd cgroup drivers.
- Add zDockerMonitor(Status|Stats|Size) configuration properties.
- Replace root file system monitoring with Docker's container size monitoring.
- Drop support for Docker versions earlier than 1.6.
- Support Dynamic View.
1.0.0
- Initial release.