Nutanix
ZenPacks.zenoss.Nutanix
This ZenPack provides system monitoring for Nutanix hyper-converged infrastructure.
Nutanix features include:
- Overall Cluster Health Monitoring
- Health Monitoring for Clusters, Hosts, and CVMs
- Graphs for key Nutanix settings and performance metrics
- Service Impact and root cause analysis. (Requires Zenoss Service Dynamics)
- Incremental modeling, when changes to the cluster are detected
- Event Management
Applications Monitored: Nutanix Hyperconverged Infrastructure
Commercial
This ZenPack is developed and supported by Zenoss Inc. Commercial ZenPacks are available to Zenoss commercial customers only. Contact Zenoss to request more information regarding this or any other ZenPacks. Click here to view all available Zenoss Commercial ZenPacks.
Releases
Version 2.1.2 - Download - Released on 2025/11/25 - Requires PythonCollector ZenPack, ZenPackLib ZenPack (>=2.0.8) - Compatible with Zenoss 6.x and Zenoss Cloud
Version 2.1.1 - Download
- Released on 2024/05/09
- Requires PythonCollector ZenPack, ZenPackLib ZenPack (>=2.0.8)
- Compatible with Zenoss 6.x and Zenoss Cloud
Version 2.1.0 - Download
- Released on 2023/10/05
- Requires PythonCollector ZenPack, ZenPackLib ZenPack (>=2.0.8)
- Compatible with Zenoss 6.x and Zenoss Cloud
Background
This ZenPack monitors Nutanix hyper-converged infrastructure.
Prerequisites
- Nutanix (5.15+)
- Nutanix API V1/V2
- Prism API credentials
- ZenPackLib ZenPack 2.0.8+
Gallery
Nutanix Overview
- Contains the device summary, status, and list of components.
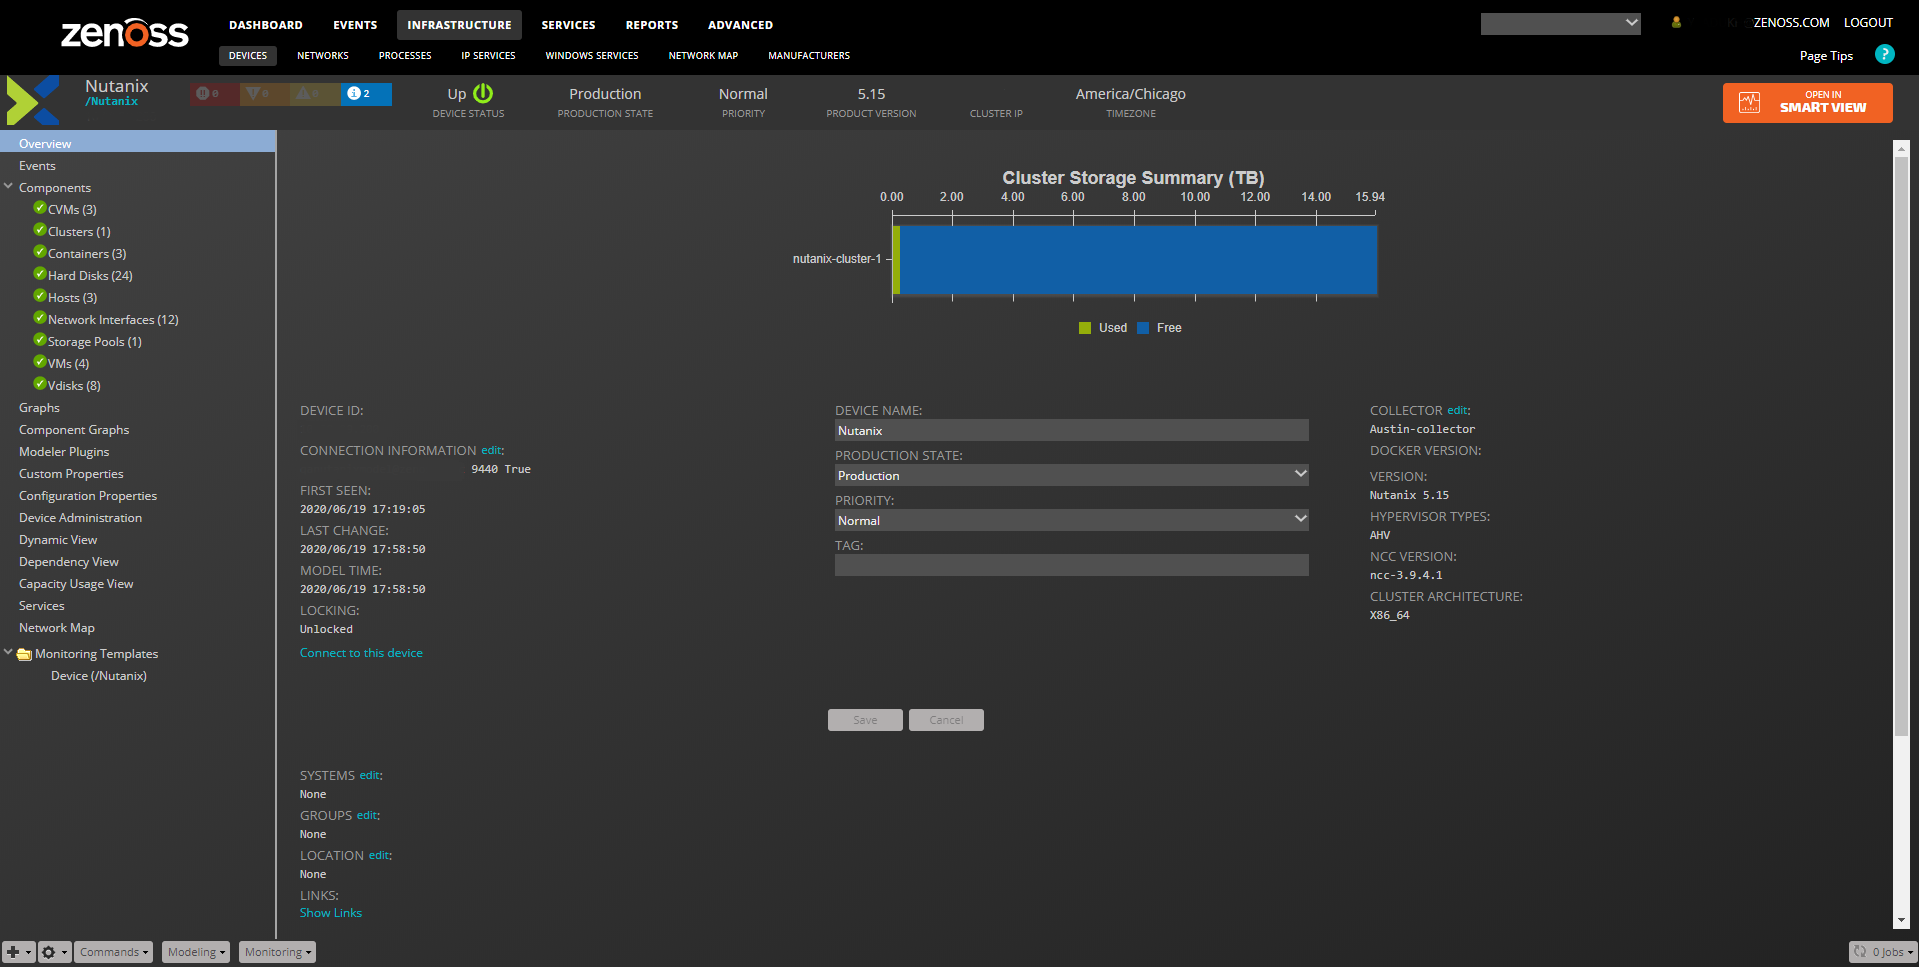
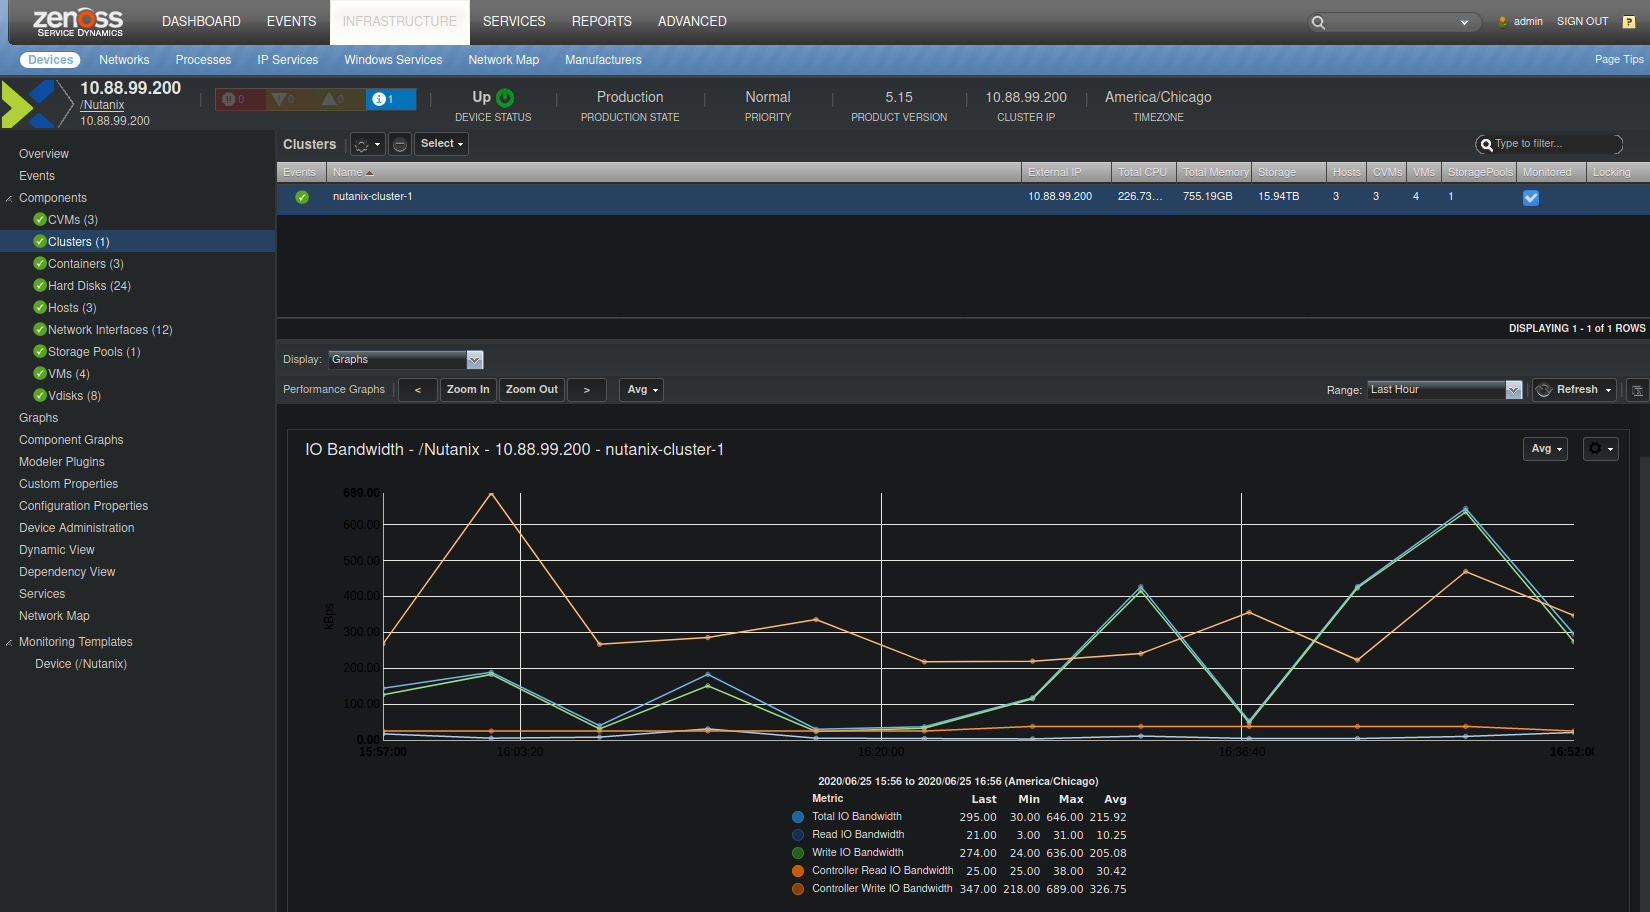
Cluster Summary
New graphs to 2.0.0 include the IO Bandwidth and IO Latency
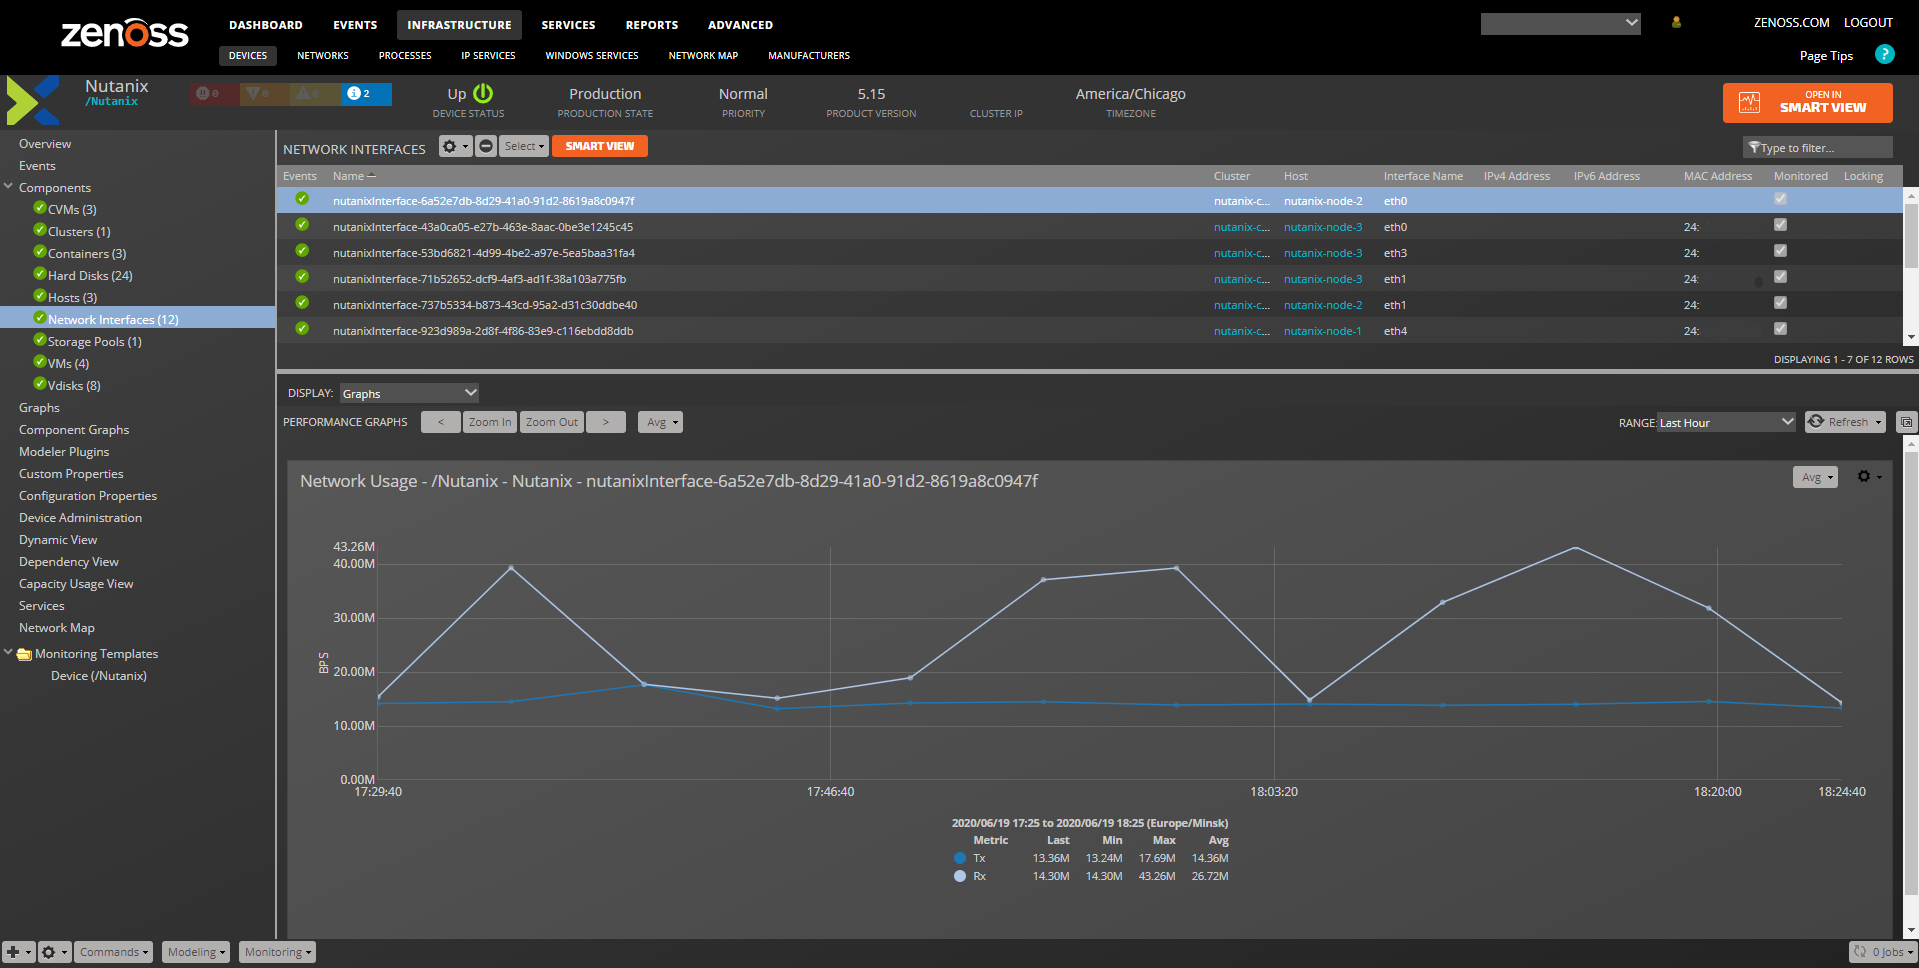
Nutanix Component - Interfaces
- A new component introduced in 2.0.0, is responsible for tracking network usage
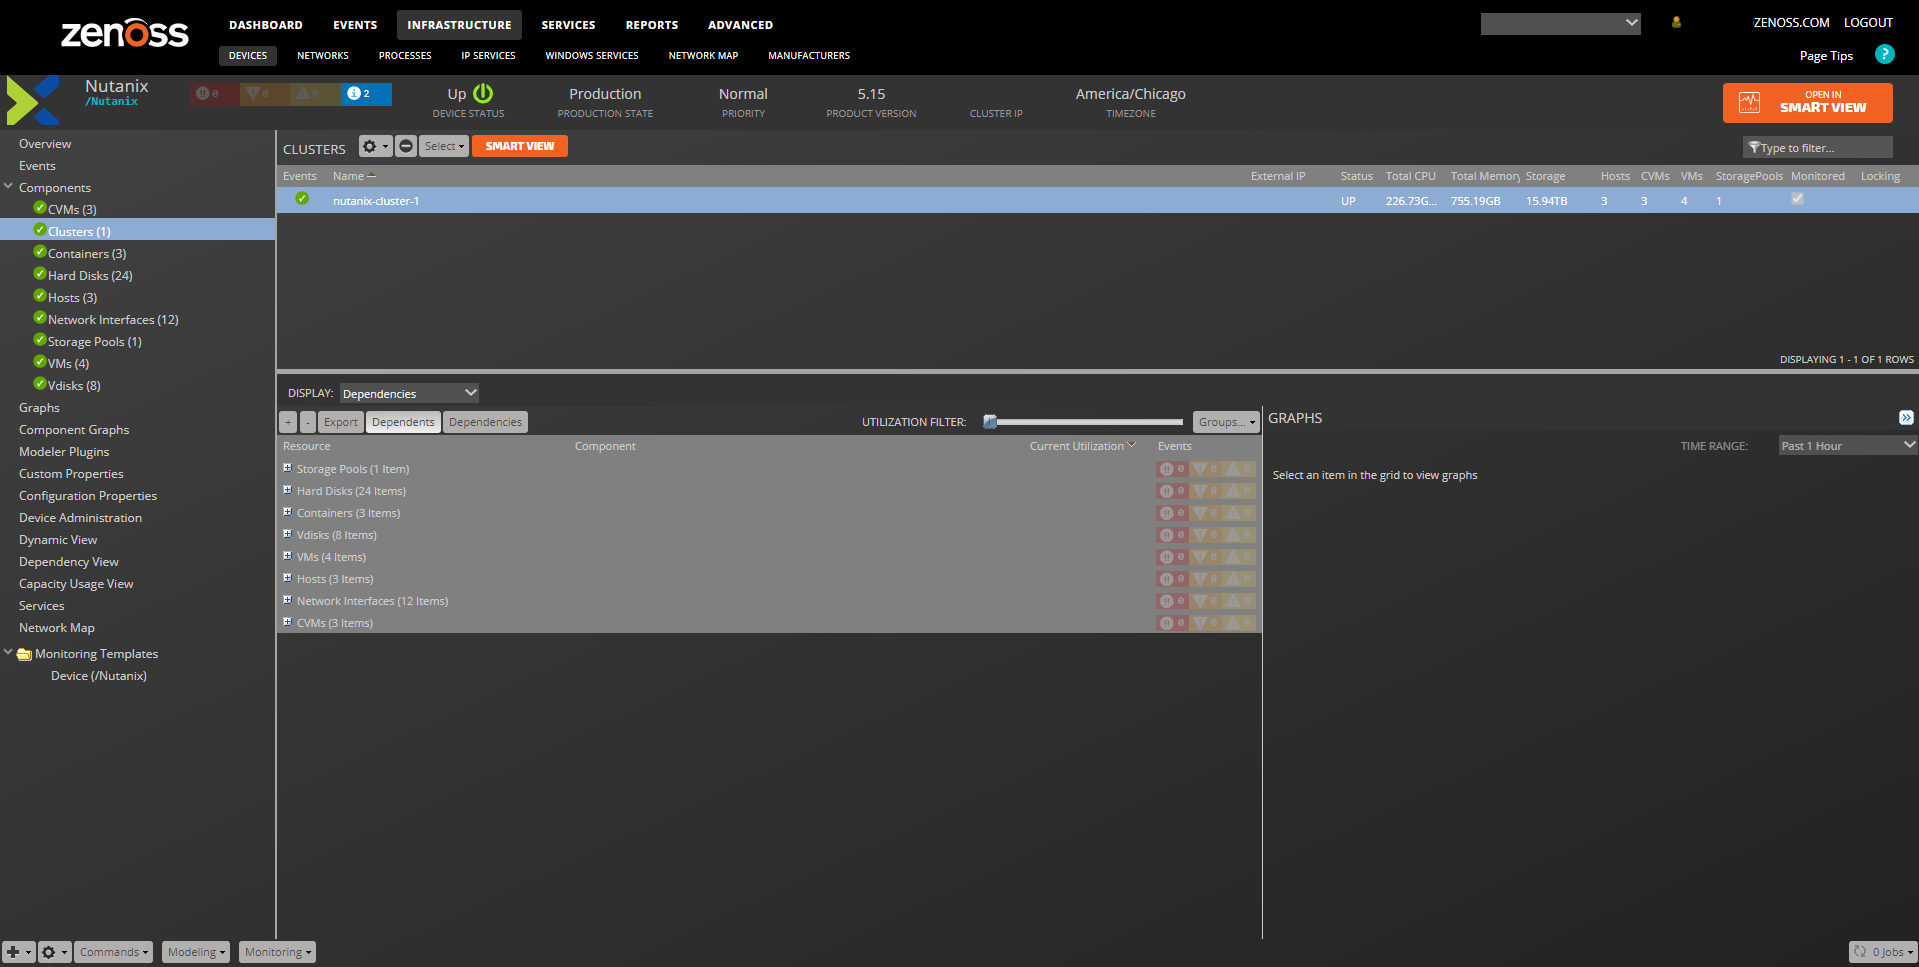
Nutanix Dependencies View
- Displays the known associations between the selected component and other components of the same device or linked devices.
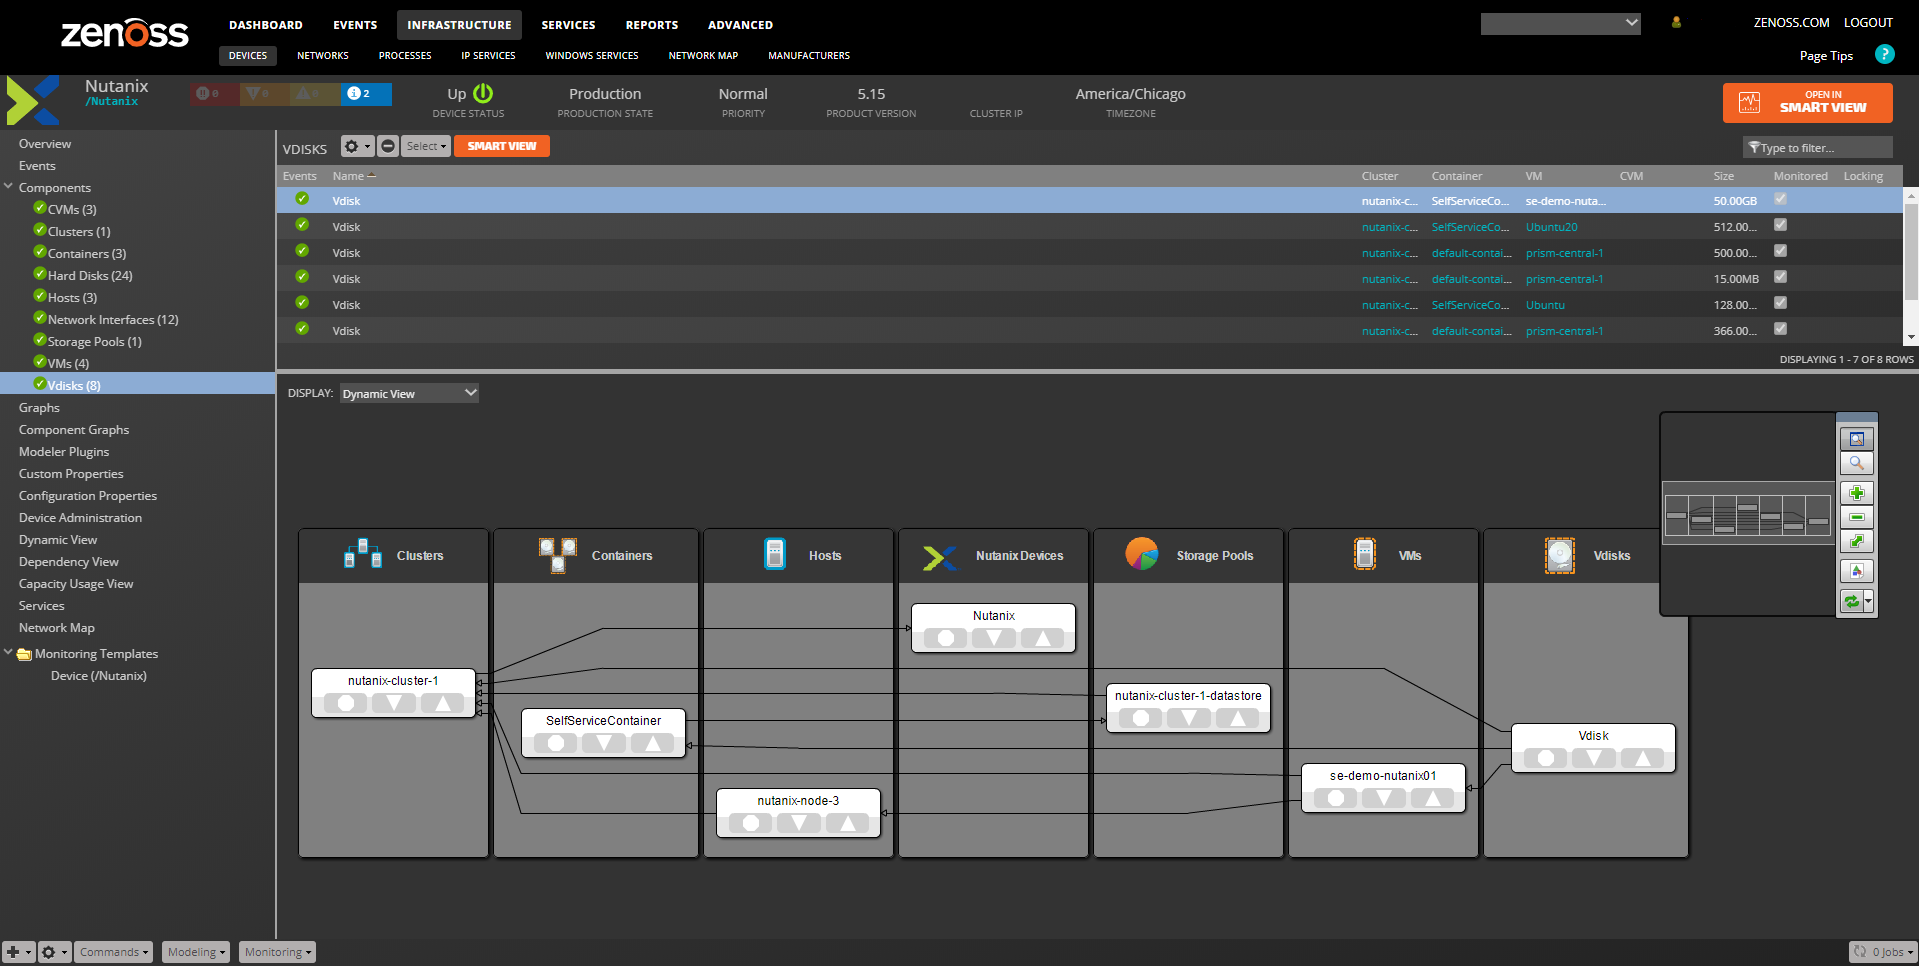
Nutanix Dynamic View
- Provides a visual representation of how the device's components are organized.
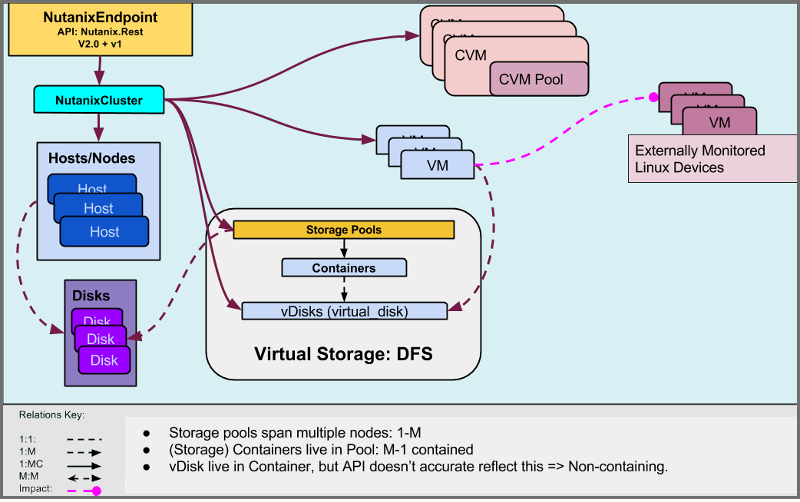
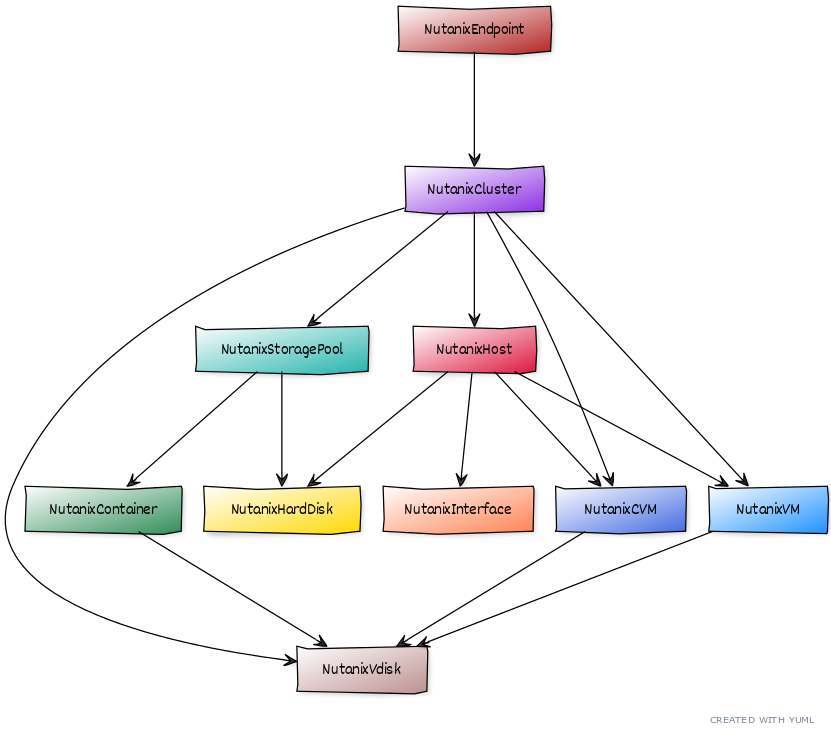
Nutanix Structure and Discovery
Objects are automatically discovered via the Nutanix API. The ZenPack class structure can be visualized in the following Diagram:
Nutanix Device (NutanixEndpoint)
- Description: The Nutanix device, can host multiple clusters.
- Attributes: cluster_external_ipaddress, cluster_uuid, device_uuid, hypervisor_types, model_name, ncc_version, product_version, timezone
- Relationships: nutanixClusters
- Datasources:
- events
- alerts
Nutanix Clusters (NutanixCluster)
- Description: The cluster component. Nutanix can host multiple clusters.
- Attributes: cluster_external_ipaddress, cluster_uuid, num_hosts, operation_mode, storage_usage_percent, total_cpu, total_memory, total_storage, version
- Relationships: nutanixEndpoint, nutanixCVMs, nutanixHosts, nutanixStoragePools, nutanixVMs, nutanixVdisks
- Datapoints:
- cluster:
- operationMode
- stats:
- contentCacheHitPercent
- controllerReadIoPercent
- controllerWriteIoPercent
- hypervisorCpuUsagePercent
- hypervisorKvmCpuUsagePercent
- hypervisorKvmMemoryUsagePercent
- hypervisorMemoryUsagePercent
- readIoPercent
- writeIoPercent
- ioBandwidthKBps
- readIoBandwidthKBps
- writeIoBandwidthKBps
- hypervisorIoBandwidthKBps
- hypervisorReadIoBandwidthKBps
- hypervisorWriteIoBandwidthKBps
- controllerIoBandwidthKBps
- controllerReadIoBandwidthKBps
- controllerWriteIoBandwidthKBps
- replicationTransmittedBandwidthKBps
- replicationReceivedBandwidthKBps
- avgIoLatencyUsecs
- hypervisorAvgIoLatencyUsecs
- hypervisorAvgReadIoLatencyUsecs
- hypervisorAvgWriteIoLatencyUsecs
- controllerAvgIoLatencyUsecs
- controllerAvgReadIoLatencyUsecs
- controllerAvgWriteIoLatencyUsecs
- usagestats:
- storageCapacityBytes
- storageFreeBytes
- storageUsagePercent
- storageTierDasSataCapacityBytes
- storageTierDasSataFreeBytes
- storageTierDasSataUsagePercent
- storageTierSsdCapacityBytes
- storageTierSsdFreeBytes
- storageTierSsdUsagePercent
- cluster:
- Graphs:
- IO Bandwidth
- IO Latency
- IO
- IO Cache Hit Ratio
- Controller IO
- Hypervisor Memory Utilization
- Storage Utilization
- SSD Storage
- DAS Storage
- Thresholds:
- 90 Percent Storage
- 95 Percent Storage
- 95 Percent hypervisor memory
- 98 Percent Controller IO
- 98 Percent Disk IO
Hosts (NutanixHost)
- Description: Hosts that Nutanix services run on
- Attributes: cluster_uuid, host_uuid, hypervisor_address, service_vmexternal_ip, cpu_capacity_in_hz, memory_capacity_in_bytes, hypervisor_version
- Relationships: nutanixCluster, nutanixHardDisks
- Datapoints:
- host:
- numVms
- state
- stats:
- contentCacheHitPercent
- controllerReadIoPercent
- controllerWriteIoPercent
- hypervisorCpuUsagePercent
- hypervisorMemoryUsagePercent
- readIoPercent
- writeIoPercent
- ioBandwidthKBps
- readIoBandwidthKBps
- writeIoBandwidthKBps
- hypervisorIoBandwidthKBps
- hypervisorReadIoBandwidthKBps
- hypervisorWriteIoBandwidthKBps
- controllerIoBandwidthKBps
- controllerReadIoBandwidthKBps
- controllerWriteIoBandwidthKBps
- avgIoLatencyUsecs
- hypervisorAvgIoLatencyUsecs
- hypervisorAvgReadIoLatencyUsecs
- hypervisorAvgWriteIoLatencyUsecs
- controllerAvgIoLatencyUsecs
- controllerAvgReadIoLatencyUsecs
- controllerAvgWriteIoLatencyUsecs
- usagestats:
- storageCapacityBytes
- storageFreeBytes
- storageUsagePercent
- storageTierDasSataCapacityBytes
- storageTierDasSataFreeBytes
- storageTierDasSataUsagePercent
- storageTierSsdCapacityBytes
- storageTierSsdFreeBytes
- storageTierSsdUsagePercent
- host:
- Graphs:
- IO Bandwidth
- IO Latency
- IO
- IO Cache Hit Ratio
- Hypervisor CPU Utilization
- Hypervisor Memory Utilization
- Storage Utilization
- SSD Storage
- DAS Storage
- Thresholds:
- 90 Percent Storage
- 95 Percent Storage
- 95 Percent hypervisor cpu
- 95 Percent hypervisor memory
- 98 Percent Disk IO
NutanixVM/NutanixCVM
Nutanix CVMs and VMs have a very similar structure and we cover them together although they are completely distinct components.
- Description: Virtual Machines and Controller Virtual Machines
- Attributes: cluster_uuid, host_uuid, ipAddresses, mac_addresses, memoryCapacityInBytes, network_uuids, nonNdfsDetails, num_vcpus, vdisk_uuids, vm_uuid
- Relationships: nutanixCluster, nutanixVdisk
- Datapoints:
- stats:
- memoryUsagePercent
- hypervisorConsumedMemoryBytes
- hypervisorCpuUsagePercent
- guestMemoryUsageBytes
- guestMemoryUsagePercent
- hypervisorIoBandwidthKBps
- hypervisorReadIoBandwidthKBps
- hypervisorWriteIoBandwidthKBps
- controllerIoBandwidthKBps
- controllerReadIoBandwidthKBps
- controllerWriteIoBandwidthKBps
- hypervisorAvgIoLatencyUsecs
- hypervisorAvgReadIoLatencyUsecs
- hypervisorAvgWriteIoLatencyUsecs
- controllerAvgIoLatencyUsecs
- controllerAvgReadIoLatencyUsecs
- controllerAvgWriteIoLatencyUsecs
- vm:
- powerState
- stats:
- Graphs:
- IO Bandwidth
- IO Latency
- Hypervisor CPU Utilization
- Memory Utilization
- Thresholds:
- 98 percent of guest memory
Network Interfaces (NutanixInterface)
- Description: Physical network interfaces associated with each host
- Attributes: cluster_uuid, host_uuid, interface_uuid, name, mac_address, ipv4_addr, ipv6_addr, link_mtu, link_capacity, details, discovery_protocol, switch, switch_port, switch_vlan_id, switch_mac_address, switch_details
- Relationships: nutanixHost
- Datapoints:
- nic:
- networkTransmittedBytes
- networkReceivedBytes
- nic:
- Graphs:
- Network Usage
Hard Disks (NutanixHardDisk)
- Description: Physical hard disks used for VM storage
- Attributes: cluster_uuid, disk_uuid, host_uuid, location, model, serial_number, size, storage_tier_name
- Relationships: nutanixHost, nutanixStoragePool
-
Datapoints:
- disk:
- diskStatus
- online
-
stats:
- readIoPercent
- writeIoPercent
- readIoBandwidthKBps
- writeIoBandwidthKBps
- avgIoLatencyUsecs
-
usagestats:
- storageCapacityBytes
- storageFreeBytes
- storageUsagePercent
- Graphs:
- Disk IO Bandwidth
- Disk IO Latency
- Storage Utilization
- Thresholds:
- 90 Percent Storage
- 95 Percent Storage
- disk:
Storage Pools (NutanixStoragePool)
- Description: The Nutanix logical storage objects
- Attributes: cluster_uuid, disk_uuids, free_bytes, size, storagepool_uuid, used_bytes
- Relationships: nutanixContainers, nutanixHardDisks
-
Datapoints:
-
stats:
- avgIoLatencyUsecs
- readIoBandwidthKBps
- writeIoBandwidthKBps
- readIoPercent
- writeIoPercent
- readIoPercent
- writeIoPercent
-
usagestats:
- storageCapacityBytes
- storageFreeBytes
- storageUsageBytes
- storageUsagePercent
- storageTierDasSataCapacityBytes
- storageTierDasSataFreeBytes
- storageTierDasSataUsageBytes
- storageTierDasSataUsagePercent
- storageTierSsdCapacityBytes
- storageTierSsdFreeBytes
- storageTierSsdUsageBytes
- storageTierSsdUsagePercent
- Graphs:
- IO Bandwidth
- IO Latency
- Storage Utilization
- SSD Storage
- DAS Storage
- Thresholds:
- 90 Percent Storage
- 95 Percent Storage
-
Nutanix Storage Containers (NutanixContainer)
- Description: Storage containers sub-divide Nutanix storage pools.
- Attributes: cluster_uuid, compressionEnabled, container_uuid, erasureCode, free_bytes, replicationFactor, size, storagepool_uuid, used_bytes
- Relationships: nutanixStoragePool, nutanixVdisks
- Datapoints:
- stats:
- controllerAvgReadIoSizeKbytes
- controllerAvgWriteIoSizeKbytes
- controllerReadIoBandwidthKBps
- controllerWriteIoBandwidthKBps
- controllerAvgReadIoLatencyUsecs
- controllerAvgWriteIoLatencyUsecs
- usagestats:
- storageUsagePercent
- storageUsageBytes
- storageCapacityBytes
- storageFreeBytes
- storageTierDasSataUsageBytes
- storageTierSsdUsageBytes
- stats:
- Graphs:
- Controller IO Bandwidth
- Controller IO Latency
- Storage Utilization
- SSD Usage
- DAS Usage
- Thresholds
- 90 Percent Storage
- 95 Percent Storage
Nutanix Virtual Disks (NutanixVdisk)
- Description: Virtual disks existing inside a NutanixContainer.
- Attributes: attached_vm_uuid, cluster_uuid, size, storage_container_uuid, vdisk_uuid
- Relationships: nutanixCVM, nutanixCluster, nutanixContainer, nutanixVM
- Datapoints:
- stats:
- controllerAvgReadIoSizeKbytes
- controllerAvgWriteIoSizeKbytes
- controllerReadIoBandwidthKBps
- controllerWriteIoBandwidthKBps
- controllerAvgReadIoLatencyUsecs
- controllerAvgWriteIoLatencyUsecs
- stats:
- Graphs: IO
- Controller IO Bandwidth
- Controller IO Latency
Usage
You must expose the Nutanix V1 and V2 APIs on your Prism system. Once you have the username and password, you can enter the device in Zenoss as follows:
- Go to Infrastructure Tab
- From the Add Device pull-down, select Add Nutanix Device
- Enter the hostname or IP address
- Enter the username
- Enter the password
- Select the correct collector
- Finally, click on Add
- After the modeling is complete you should see your device components
- If modeling large numbers of components you may have to increase zCollectorClientTimeout well beyond 600 to avoid model timeout.
The Nutanix model is automatically updated as changes are detected on the cluster. New and deleted components are updated as part of the regular monitoring cycle. However, to avoid overloading, Nutanix API incremental modeling has a 30-minute delay between cycles, and with the Zenoss monitoring cycle (default 5-minute cycles), it may take a minimum of 30 minutes before the Zenoss Nutanix model synchronizes with the Nutanix Cluster.
Controlling which VMs are Modeled
By default, all Virtual Machines (VMs) managed by the Nutanix endpoint are modeled. Optionally, you may exclude certain VMs that you don't want Zenoss to model through the use of the zNutanixModelExcludeVMNames and zNutanixModelIncludeVMNames zProperties. When the modeler matches these patterns, it first checks zNutanixModelExcludeVMNames against the VMs names, and then zNutanixModelIncludeVMNames. Therefore, you must set zNutanixModelExcludeVMNames before zNutanixModelIncludeVMNames can be useful.
Examples:
- To model only VMs with "prod" in their name:
- Exclude: .*
- Include: ^prod.*
- To exclude a specific VM name:
- Exclude: ^test.*
- Include: (leave blank)
Additionally, you might want to disable the modeling of Vdisks associated with disabled VMs. Use the zNutanixModelDisableAssociatedVdisks zProperty. By default, all associated Vdisks are modeled. To disable them, set the zNutanixModelDisableAssociatedVdisks value to True.
Nutanix Batch Configuration
You can also add your devices in batch for convenience and automation.
-
Attach to the Zope container:
serviced service attach zope -
Create a text file (filename:
/tmp/batch.txt) as follows:/Devices/Nutanix nutanix64 setManageIp='10.1.1.7', \ zNutanixUsername='username', \ zNutanixPassword='password' -
Now run the zenbatchload command:
zenbatchload /tmp/batch.txt -
The device should now load and model automatically
Install and Upgrade Instructions
If this is a new, clean install, no special actions are required.
When upgrade ZenPacks.zenoss.Nutanix from a version prior to 2.0.0, the service 'zenjobs' must be stopped in order to fully complete the upgrade to the latest version! If you run the upgrade while zenjobs is running, a warning message will appear. Please stop zenjobs and rerun the installation once more.
Alternatively, you can add the install job manually. If you have previously successfully installed this version, no further action is necessary.
Installed Items
Installing this ZenPack will add the following items to your Zenoss system:
Configuration and zProperties
The zProperties and default settings are as follows:
- zNutanixAlertsInterval: Interval to collect alerts; default 60 seconds
- zNutanixEventsInterval: Interval to collect events; default 60 seconds
- zNutanixPerfInterval: Interval to collect metric data; default 300 seconds
- zNutanixUsername: API username
- zNutanixPassword: API password
- zNutanixPort: API port; default 9440
- zNutanixUseSSL: API SSL boolean; default True
- zNutanixModelIncludeVMNames: List of regular expressions (matched against VM names) to control which VMs are modeled. Note that zNutanixModelIncludeVMNames takes precedence over zNutanixModelExcludeVMNames.
- zNutanixModelExcludeVMNames: List of regular expressions (matched against VM names) to control which VMs are NOT modeled. Note that zNutanixModelIncludeVMNames takes precedence over zNutanixModelExcludeVMNames.
- zNutanixModelDisableAssociatedVdisks: Disable modeling Vdisk associated with VMs that have been excluded by zNutanixModelExcludeVMNames, zNutanixModelIncludeVMNames, boolean; default False
Modeler Plugins
- zenoss.Nutanix
Known issues
Upgrade to 2.1.2
As a part of the datapoint migration to the new naming convention, historical data from legacy datapoints may not be visible on the standard graphs. To address this, deprecated graphs have been added, providing access to historical data from the previous datapoints names. Deprecated datapoints are also retained in the list to provide access to historical data collected prior to the migration to the new naming convention.
Upgrade to 2.1.0
Data for previous periods will be missed for Host, VM, CVM components due to changes in the naming of datasources.
Zenoss Analytics
The following steps are applicable only for Zenoss Analytics 5.x.x. In Analytics 6.0.0, any third-party reporting tool can be used to generate reports.
This ZenPack provides additional support for Zenoss Analytics. Perform the following steps to install extra reporting resources into Zenoss Analytics after installing the ZenPack.
-
Copy analytics-bundle.zip from $ZENHOME/ZenPacks/ZenPacks.zenoss.Nutanix*/ZenPacks/zenoss/Nutanix/analytics/ on your Zenoss server.
-
Navigate to Zenoss Analytics in your browser.
-
Log in as a superuser.
-
Remove any existing Nutanix_ZenPack folder.
- Choose Repository from the View menu at the top of the page.
- Expand Public in the list of folders.
- Right-click on Nutanix_ZenPack folder and choose Delete.
- Confirm deletion by clicking OK.
-
Add the new Nutanix_ZenPack folder.
- Choose Server Settings from the ‘’Manage’ menu at the top of the page.
- Choose Import in the left page.
- Remove checks from all check boxes.
- Click Choose File to import a data file.
- Choose the analytics-bundle.zip file copied from your Zenoss server.
- Click Import.
You can now navigate back to the Nutanix_ZenPack folder in the repository to see the following resources added by the bundle.
Domains
- Nutanix Domain
Domains can be used to create ad hoc views using the following steps.
- Choose Ad Hoc View from the Create menu.
- Click Domains at the top of the data chooser dialog.
- Expand Public then Nutanix ZenPack.
- Choose the Nutanix Domain domain
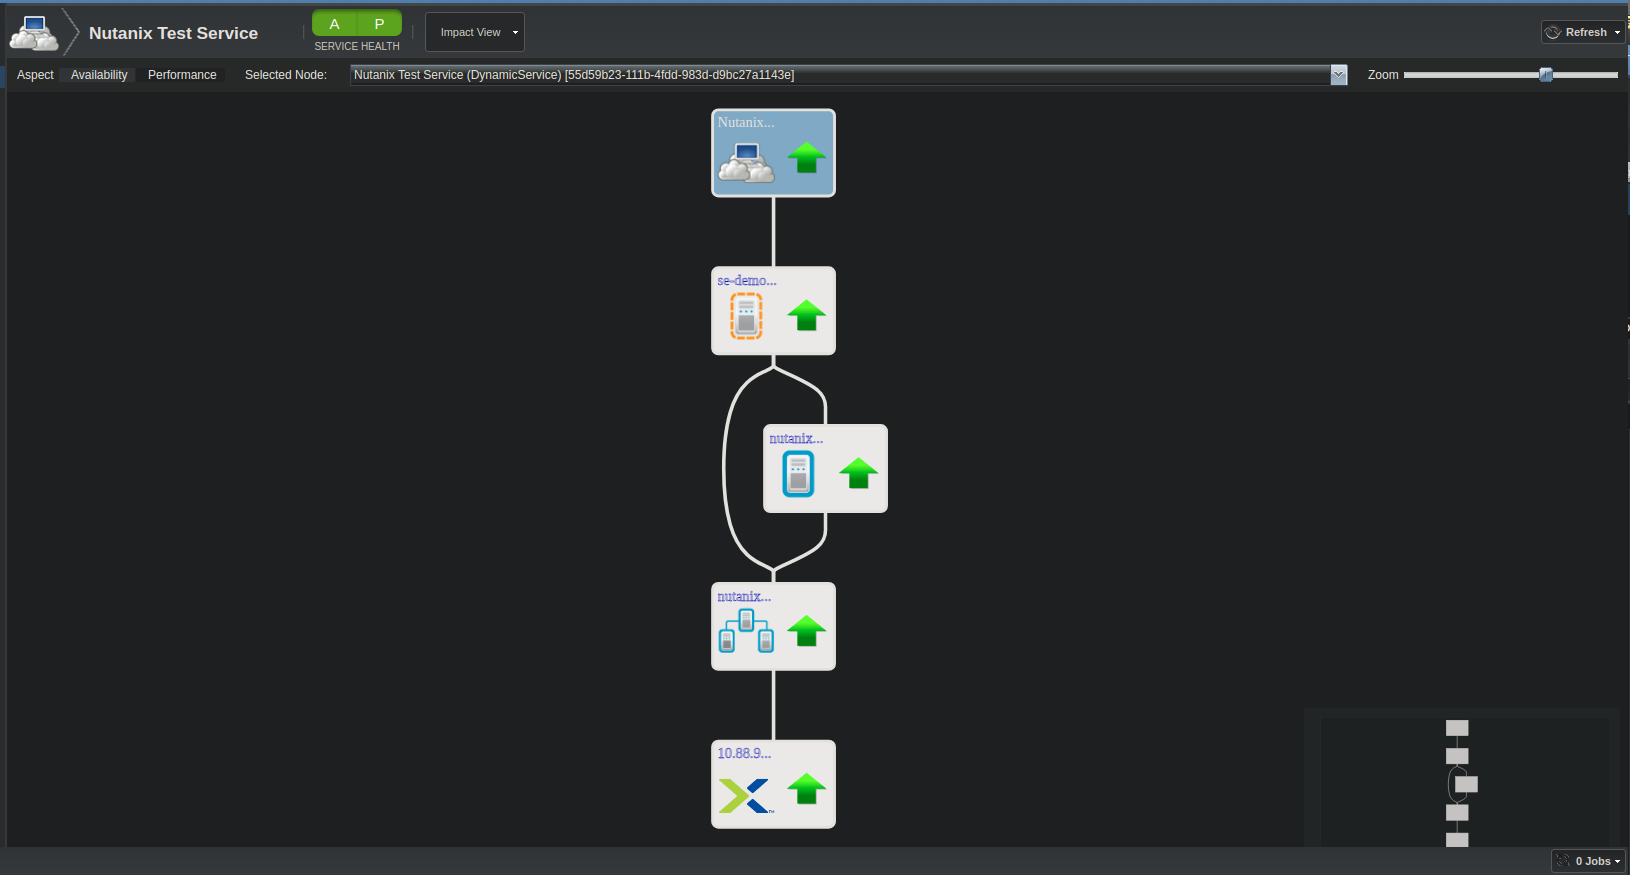
Service Impact and Root Cause Analysis
When combined with the Zenoss Service Dynamics product, this ZenPack adds built-in service impact and root cause analysis capabilities. The service impact relationships shown in the diagram (right) and described below are automatically added and maintained. These will be included in any services that contain one or more of the explicitly mentioned components.
The following object types would typically be added to Impact services.
- NutanixVM
- Linux or Windows devices associated with a NutanixVM
Internal Impact Relationships between Nutanix Components
- NutanixEndpoint: impacts all NutanixHosts.
- NutanixCluster: impacts NutanixVMs, NutanixStoragePools
- NutanixHost: impacts NutanixCVMs
- NutanixCVM: impacts NutanixCluster
- NutanixHardDisk: impacts NutanixStoragePool
- NutanixStoragePool: impacts NutanixContainers
- NutanixContainers: impacts NutanixVdisks
- NutanixVdisks: impacts NutanixVM
External Impact Relationships
- NutanixVM: impacts: GuestDevice (the hosted Linux or Windows system)
Changes
2.1.2
- Updated datapoint naming. Datapoint names now use camelCase instead of snake_case (ZPS-9088)
- Fixed threshold functionality (ZPS-9088)
- Added support for deprecated charts. Deprecated charts are displayed to maintain backward compatibility (ZPS-9169)
- Tested with Zenoss Cloud, Zenoss Resource Manager 6.9.0, Service Impact 5.7.2 and Analytics 6.0.0
2.1.1
- Make Nutanix ZenPack compatible with Ubuntu-based CZ 7.2.0 (ZPS-8858)
- Tested with Zenoss Cloud, Zenoss Resource Manager 6.7.0, Service Impact 5.6.1 and Analytics 6.0.0
2.1.0
- Added ability to specify filters and not model VMs and associated VDisks (ZPS-8253)
- Changed names for Host, VM, CVM components to improve working with dashboards (ZPS-8471)
- Fixed creating Aged Events from Nutanix Events Plugin (ZPS-7317)
- Tested with Zenoss Cloud, Zenoss Resource Manager 6.7.0, Service Impact 5.6.1 and Analytics 6.0.0
2.0.1
- Fixed pulling critical events after the original ones are aged out (ZPS-7317)
- Fixed generation of critical events when there are no changes in the Nutanix cluster (ZPS-7525)
- Fixed modeling of a Nutanix 5.20 instances (ZPS-7703)
- Tested with Zenoss Cloud, Zenoss Resource Manager 6.6.0, and Service Impact 5.5.5
2.0.0
- Updated to be compatible with Nutanix Prism 5.15 LTS
- Added incremental modeling support (ZPS-7013)
- Corrected the relations between hosts, CVMs, VMs, and other components (ZPS-6823)
- Updated the callhome routine to correctly count monitored systems (ZPS-5843)
- Added Network Interface components, contained by hosts (ZSP-5625)
- Updated component graphs to report bandwidth and latency, similar to the Nutanix console (ZPS-7095)
- Correctly linking VMs to their devices in Zenoss (ZPS-7128)
- Tested with Zenoss Resource Manager 6.4.1, 6.5, Zenoss Cloud and Impact 5.5.1
1.0.3
- Fix relationships between CVMs <-> Hosts (ZPS-6676)
- Fix flare in UI when Storage Summary Data is wrong (ZPS-5832)
- Fix memory leak in zenpython caused by Nutanix datasource (ZPS-4701)
- Tested with Zenoss Resource Manager 6.4.1, Zenoss Cloud, and Impact 5.5.1
1.0.2
- Fix minor log warnings (ZPS-5620)
- Fix incorrect datapoint for vm/cvm memory_usage_pct (ZPS-2904)
- Fix unhandled plugin errors while monitoring (ZPS-3428)
- Fix modeling when cluster uuid missing from API (ZPS-4189)
- Tested with Zenoss Cloud, Zenoss 6.3.2, and Service Impact 5.3.4 
1.0.1
- Add debug info for modeler (ZPS-2310)
- Guard for missing disk hw info (ZPS-2311)
- Extend zCollectorClientTimeout to 600, optimize modeling (ZPS-2316, ZPS-2430)
- Tested with Zenoss Resource Manager 5.3.2 & 6.0.0, Service Impact 5.2.2, Analytics 5.0.8
1.0.0
- Initial Release
- Tested with Zenoss Resource Manager 5.2.6 & 5.3.1, Service Impact 5.1.7, Analytics 5.0.8