OpenVZ
You are viewing the ZenPack Archive
This page is part of the ZenPack Archive. Archived ZenPacks may not be compatible with your version of Zenoss Service Dynamics or Zenoss Cloud.
Open Source
This ZenPack is developed and supported by Zenoss Inc. Contact Zenoss to request more information regarding this or any other ZenPacks. Click here to view all available Zenoss Open Source ZenPacks.
Authors
Daniel Robbins
Maintainers
Daniel Robbins
Organization
Zenoss, Inc.
License
GNU General Public License, Version 2, or later
Name
ZenPacks.zenoss.OpenVZ
Git Sources (For Cloning)
Applications Monitored
OpenVZ
OpenVZ ZenPack
Provides specialized modeling and monitoring capabilities for OpenVZ hosts.
Support
This is an Open Source ZenPack developed by Zenoss, Inc. Enterprise support for this ZenPack is available to commercial customers with an active subscription.
Releases
- Version 2.0- Download: Summary of changes: New, very useful IO utilization metrics and
- graph for each container.
- Released on 2013/04/11: Compatible with Zenoss Core 3.2.x, Zenoss Core 4.2.x, Zenoss Resource Manager 4.1.x, Zenoss Resource Manager 4.2.x
Background
This project is a Zenoss extension (ZenPack) that provides specialized modeling and monitoring capabilities for OpenVZ hosts.
While Zenoss always has had the ability to monitor an OpenVZ host system and containers (also called "VE"s) as standalone devices by connecting to the host and containers directly using SSH or SNMP, it did not have the ability to understand the relationship between the OpenVZ host and the container. It also did not have the ability to "see" containers by simply monitoring the host.
This ZenPack allows you to see the containers as components within an OpenVZ host even if you are not actively monitoring the individual containers. A number of metrics are made available for the containers without requiring monitoring to be configured on the containers themselves. This is a great benefit for hosting providers as well as large enterprise OpenVZ deployments.
With this ZenPack, it is also still possible to monitor containers "the old-fashioned way", as Linux devices by using SSH or SNMP, and if you do this, Zenoss will now be able to "connect" the OpenVZ host to the container device that you are monitoring. For containers containing production workloads, this dual-monitoring approach allows you to use traditional Zenoss monitoring and alerting functions within the container.
Usage
As of version 1.0.2, this ZenPack typically requires no manual post-install steps to enable for any OpenVZ host devices. All you need to do is to ensure that Zenoss has root SSH credentials for your OpenVZ host devices and that the OpenVZ system is in the /Server/Linux or /Server/SSH/Linux device classes. If you ensure that this is done, a remodel of the device should result in OpenVZ containers being monitored and appearing as components for the device.
Modeling OpenVZ Hosts
To see OpenVZ containers in Zenoss right away, simply add your OpenVZ hosts to Zenoss if you have not already. Once discovered or added, you should see OpenVZ Containers menu under the device's Components list, in addition to a new OpenVZ Container Memory Utilization graph under the OpenVZ host device's Graphs page, at the bottom.
For any existing OpenVZ hosts that were added to Zenoss prior to ZenPack installation, choose Model Device... from the device's "gear" menu in the lower left of the detail screen to immediately remodel the device and display any OpenVZ containers that exist on the system.
Again, note that Zenoss must be configured so that it has root access to the OpenVZ host, either by password or via RSA/DSA public key. root access is required to properly retrieve all OpenVZ-related information. This information is specified under the Configuration Properties page.
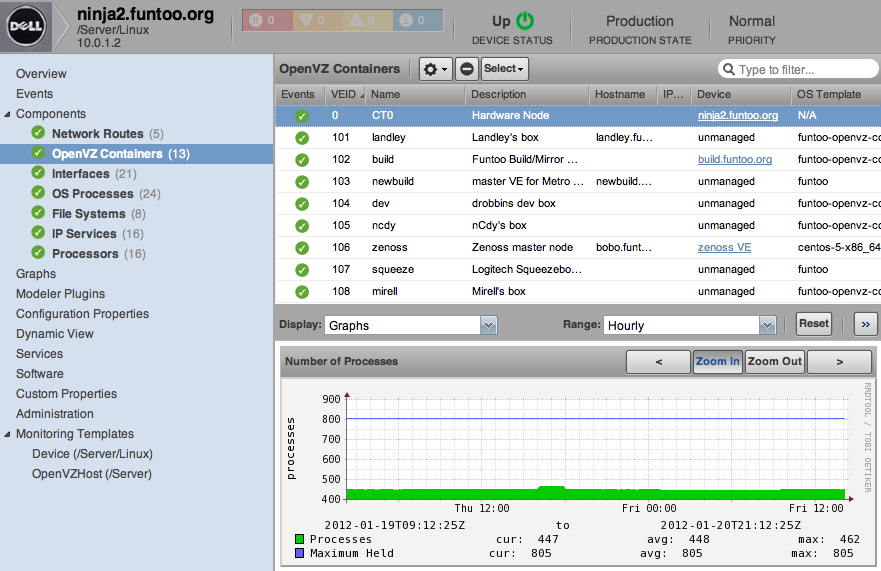
With the modeler plugin enabled, remodeling the device should cause OpenVZ Containers to be displayed as Components of the modeled device. You should also see relevant information for each container on the system, such as its VEID, name, hostname, IP Address(es) (if assigned via venet), a link to the device (if you are monitoring the container directly via SSH or SNMP), the OS Template that was used to create the VE, the status of the "On Boot" flag and its status (running, stopped, etc.) In addition, you should see an OpenVZ Container Memory Utilization graph on the OpenVZ host device's Graphs page.
The OpenVZ host device's detail page should now look like this:
There will also be a new graph showing memory utilization of all containers on the system. This graph will be initially empty and will populate with data over the next hour:
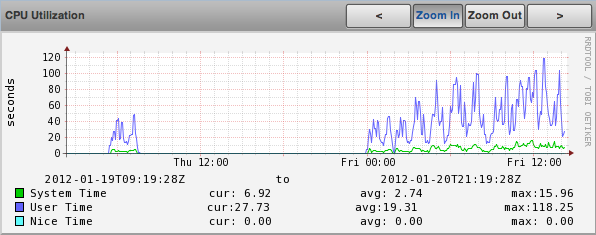
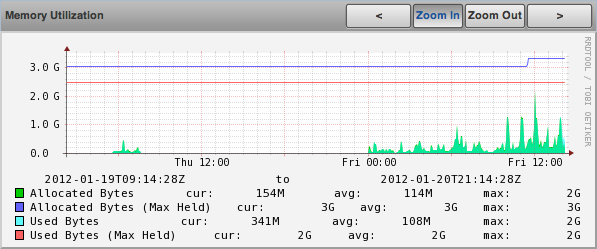
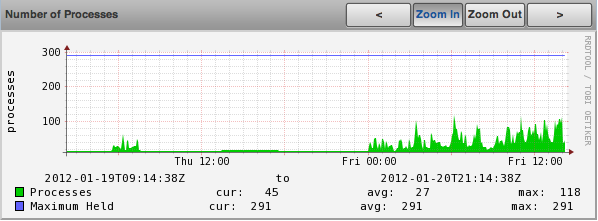
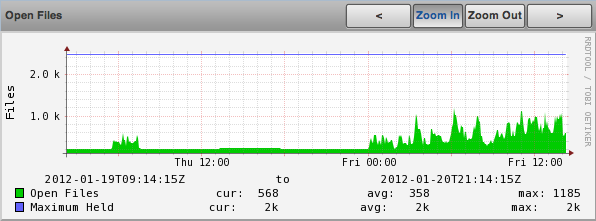
Clicking on a Container in the OpenVZ Containers list will display these predefined graphs:
Behind the Scenes
As mentioned earlier, typically no post-install steps are required to actually enable the OpenVZ ZenPack other than installing it and adding OpenVZ hosts or remodeling any existing OpenVZ hosts already in Zenoss. However, if you have a highly customized Zenoss install, it is possible that some manual steps still may be required to get the OpenVZ ZenPack up and running. This section describes what the OpenVZ ZenPack does "behind the scenes" to automatically enable itself, so that you can perform these steps manually if necessary, and also validate that the OpenVZ ZenPack is fully functional in your environment.
When the OpenVZ ZenPack is installed, it will automatically add the zenoss.cmd.linux.OpenVZ modeler plugin to the device classes /Server/Linux and /Server/SSH/Linux. The modeler plugin is the heart of the OpenVZ ZenPack, and is what connects to your Linux system and determines if OpenVZ is running, and if so will model the containers on the system as components which appear under the OpenVZ Containers components list. If for some reason you are using different device classes for Linux devices than those for which the OpenVZ ZenPack automatically is enabled, you will need to manually add zenoss.cmd.linux.OpenVZ as one of the modeler plugins for the device classes you are using.
Once the zenoss.cmd.linux.OpenVZ modeling plugin is enabled, it will connect to OpenVZ host devices and determine if they in fact have OpenVZ enabled. If OpenVZ is detected, the modeling plugin will automatically bind the OpenVZHost monitoring template to the OpenVZ Host device. In addition, each container detected on the device will automatically have the OpenVZContainer monitoring template bound to it. These monitoring templates run once every few minutes to collect new RRD metrics and utilization information. You will see charts under each Container listed under OpenVZ Containers, and as you might guess these metrics are collected by the OpenVZContainer monitoring template. In addition, you will see a new graph called OpenVZ Container Memory Utilization under the OpenVZ host device's Graph list, and RRD data for this graph is collected/calculated by the OpenVZHost monitoring template. The OpenVZHost monitoring template will also fire events when a new container is created, a container is destroyed, or there is another type of status change for a container such as it being started, stopped or suspended.
Please ensure that all the provided functionality in the OpenVZ ZenPack is being enabled. If not, you should now know where to look for troubleshooting purposes. If you get stuck, you may have encountered a bug of some kind, so file an Issue at https://github.com/zenoss/ZenPacks.zenoss.OpenVZ with detailed information about the problem you are experiencing.
Container Metrics and Graphs
The OpenVZContainer monitoring template collects data for each container and uses this data to populate data points in its openvz data source with new metrics every few minutes.
Note: These settings can be viewed by navigating to Advanced, Monitoring Templates, OpenVZContainer, /Server in the UI.
By default, the OpenVZContainer monitoring template defines four graphs that will appear for each Container component on an OpenVZ host:
- number of processes
- open files
- memory utilization
- CPU utilization
The first three graphs are generated using data extracted from /proc/user_beancounters on the OpenVZ host. The CPU utilization graph is generated using /proc/vz/vestat information.
vestat
The openvz datasource has several data points pre-defined for you that are sourced from the /proc/vz/vestat file on the OpenVZ Host Device. These data points will appear with the prefix openvz. in the Data Points list:
- vestat.nice.seconds
- vestat.system.seconds
- vestat.user.seconds
The following datapoints can be defined by you (typically they would be set up as a GAUGE, though you could create a DERIVED if you wanted to see a delta) and if found, the OpenVZContainer monitoring template will populate them with data:
- vestat.user.jiffies - user CPU time in jiffies
- vestat.system.jiffies- system CPU time in jiffies
- vestat.nice.jiffies- user nice CPU time in jiffies
- vestat.uptime.jiffies - container uptime in jiffies
The "raw" form of the name, such as vestat.user, is also supported, but it's recommended that you use the explicit .jiffies suffix above.
In addition, a variant of these data points are available, with the CPU time conveniently converted to seconds (1 second = 100 jiffies):
- vestat.user.seconds (pre-defined)
- vestat.system.seconds (pre-defined)
- vestat.nice.seconds (pre-defined)
- vestat.uptime.seconds
The following cycles-based counters are also available:
- vestat.idle.cycles - idle CPU cycle count for container
- vestat.uptime.cycles- container uptime in CPU cycles
- vestat.used.cycles- CPU cycles used on all CPUs by container
The OpenVZ ZenPack does not provide .seconds equivalents for CPU cycles metrics. This may be added in a future release.
Beancounters
The openvz datasource also pulls data from the OpenVZ host device's /proc/user_beancounters file, which contains a number of container-specific metrics. This ZenPack includes some beancounters data points that are already defined for you, but additional ones you may be interested can also be defined and will be populated with data by the OpenVZContainer monitoring template if found.
These data points will appear with the prefix openvz. in the Data Points list, but don't have an additional prefix like vestat.. What this means that if a data point doesn't begin with openvz.vestat in the Data Points list, it is a beancounters data point. Here is a list of the data points that we have defined for you:
- numfile
- numfile.maxheld
- numproc
- numproc.maxheld
- oomguarbytes
- oomguarbytes.maxheld
- privvmbytes
- privvmbytes.maxheld
Additional data points can be added to the openvz datasource. All you need to do is name the data point according to the naming convention described here, and the OpenVZ ZenPack will populate the data point with RRD data.
The name of the Data Point should be of the following format:
- [resource]
- [resource].maxheld
- [resource].barrier
- [resource].limit
- [resource].failcnt
Any resource name that is visible in /proc/user_beancounters can be used. These Data Points should typically be created as type of GAUGE with the appropriate name. The monitoring template will correlate the beancounter name with the metric name and populate it with data.
Note: OpenVZ allows individual resource limits to be disabled by setting the barrier and/or limit value to LONG_MAX, typically 9223372036854775807 on 64-bit systems. The OpenVZ monitoring template will detect LONG_MAX when it is set and will *not* write this data out to RRD, as it indicates "Unlimited" rather than a measured numerical value. This will result in NaN data for "Unlimited" barrier and limit values.
In addition, the OpenVZ ZenPack implements a number of enhanced capabilities regarding Data Points:
- For every data point ending in "pages", there is a corresponding Data Point ending in "bytes" that has been normalized from memory pages to bytes. This is used for the datapoint openvz.oomguarbytes to get a byte-normalized value of oomguarpages from /proc/user_beancounters, for example.
- There is an additional .failrate suffix that can be created as a DERIVED RRD Type with a minimum value of 0 and used for firing events when the value increments.
IO Accounting
This ZenPacks also collects various container-specific IO metrics:
- ioacct.readbytes
- ioacct.writebytes
- ioacct.dirtybytes
- ioacct.cancelbytes
- ioacct.missedbytes
- ioacct.syncs_total
- ioacct.fsyncs_total
- ioacct.fdatasyncs_total
- ioacct.range_syncs_total
- ioacct.io_pbs
- ioacct.fuse_requests
- ioacct.fuse_bytes
The above metrics are incrementing counts.
- ioacct.syncs_active
- ioacct.fsyncs_active
- ioacct.fdatasyncs_active
- ioacct.range_syncs_active
The above metrics are currently-active sync statistics that will go back to zero when there is no disk activity.
Host Metrics and Graphs
Note: These settings can be viewed by navigating to Advanced, Monitoring Templates, OpenVZHost, /Server in the UI.
The OpenVZHost monitoring template has two data sources: openvz and openvz_util. openvz is used for collecting container status and firing events on container status change. It is not intended to be changed.
The openvz_util data source is used for monitoring host utilization and can be modified by the user. It works similarly to the Container's openvz Data Source in that a sampling of data points have been added by default, but more can be added by the end user for metrics of interest. The data point names that are recognized are:
- containers.[resource]
- host.[resource]
- utilization.ram
- utilization.ramswap
- utilization.allocated
containers.[resource] and host.[resource] data points can be created, where [resource] is any resource name listed in /proc/user_beancounters. Any resource name beginning with containers.will contain the total current value of that resource for all containers on the system. For example, containers.oomguarpages will contain the sum of all oomguarpages for all containers on the host. The host.[resource] prefix can be used to extract the current value of the corresponding resource for the host, that is, VEID 0.
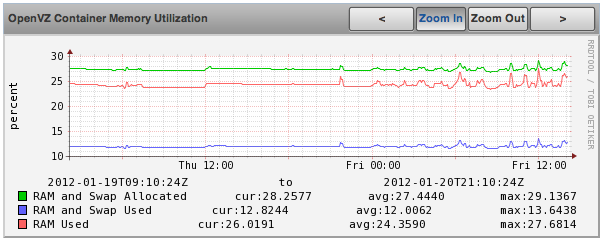
Container Memory Utilization Graph
A very useful graph has been defined for the OpenVZ host, called "OpenVZ Container Memory Utilization." Using data from /proc/user_beancounters, a number of key metrics related to the memory utilization of all containers on the host are calculated and presented in percentage form, based on the formulas described here: http://wiki.openvz.org/UBC_systemwide_configuration.
- RAM and Swap Allocated - how much RAM and Swap has been allocated (but may not yet be used). This value can exceed 1.0 (100% in the graph.)
- RAM and Swap Used - how much RAM and Swap has actually been used. Thresholds are defined for high values.
- RAM Used - how much RAM has been used. Values from 0.8 to 1.0 (80% to 100% in the graph) are acceptable.
This graph can be used to optimize the capacity of your OpenVZ hosts. In general, you want to maximize memory utilization without hitting too high a value for "RAM and Swap Used".
Note: OpenVZ also has commitment level formulas. These have not yet been integrated into the OpenVZ ZenPack at this time, but will be in the future. For commitment levels to work correctly, all containers on the host must have active memory resource limits. However, the metrics described above are available for all OpenVZ hosts, whether memory resource limits are active or not.
Changes
- Unreleased
- Adding screenshots to RST documentation.
- 1.1 January 19, 2012
- Addition of /proc/vz/vestat monitoring for containers.
- Successful testing with Zenoss 3.2.1.
- 1.0.2 January 10, 2012
- Documentation revision to reflect recent auto-configuration changes.
- The zenoss.cmd.linux.OpenVZ modeler plugin will now automatically bind the OpenVZHost monitoring template to a device if a device is found to be an OpenVZ host. This eliminates a manual configuration step.
- The ZenPack installer will now automatically add the zenoss.cmd.linux.OpenVZmodeler plugin to the /Server/Linux and /Server/SSH/Linux device classes if they exist. This eliminates a manual configuration step.
- 1.0.1 January 9, 2012
- Initial code from Chet to auto-bind OpenVZHost Monitoring Template from the Modeling Plugin. Not yet working. Very close.
- Two new event transforms to force a remodel of the OpenVZ host when an openvz_container_created or openvz_container_destroyed event is fired. This will keep the OpenVZ Containers components list up-to-date within a few minutes.
- New Config Error Event when the host utilization command parser cannot retrieve all necessary metrics from /proc/user_beancounters to calculate OpenVZ Memory Utilization metrics.
- Removed left-over example code.
- 1.0.0 Release
- Initial Release.
TODO
Future plans for development of this ZenPack include:
- OpenVZ Host: Integrate Commitment Level Formulas
- OpenVZ Containers: collect quota information
- OpenVZ Containers: convert CPU cycles to seconds
- OpenVZ Host: provide cumulative failcnt and failrate Data Points for host-wide failcnt eventing
- Container detection could be a bit more sophisticated. a stray vzctl command with a non-existent VEID will create a config file, yet it does not exist, and vzlist does not display it. Yet we list it.
- Add tests!
To submit new feature requests, bug reports, and submit improvements, visit the OpenVZ ZenPack on GitHub: https://github.com/zenoss/ZenPacks.zenoss.OpenVZ