DMTF Redfish
ZenPacks.zenoss.Redfish
The DMTF Redfish ZenPack allows you to monitor servers that provide support for Redfish API.
This ZenPack provides support for monitoring servers implementing Redfish API. For example SuperMicro X10/X11 servers, Dell PowerEdge 13G/14G servers, and HP Proliant servers with iLO5
The Redfish Scalable Platforms Management API is a standard from DMTF that uses RESTful interface semantics to access data defined in model format to perform systems management. It is suitable for a wide range of servers, from stand-alone servers to rack mount and bladed environments but scales equally well for large-scale cloud environments.
The features added by this ZenPack can be summarized as follows. Each of them is described below.
- Initial discovery and continual synchronization of relevant components.
- Performance monitoring.
- Event monitoring.
- Service Impact and root cause analysis.
Commercial
This ZenPack is developed and supported by Zenoss Inc. Commercial ZenPacks are available to Zenoss commercial customers only. Contact Zenoss to request more information regarding this or any other ZenPacks. Click here to view all available Zenoss Commercial ZenPacks.
Releases
Version 1.0.3 - Download
- Released on 2026/05/11
- Requires PythonCollector ZenPack, ZenPackLib ZenPack (>=2.1.0)
- Compatible with Virtana Service Observability (formerly Zenoss Cloud), Virtana Resource Manager 6.9.0, Service Impact 5.7.2
Version 1.0.2 - Download
- Release on 2024/11/12
- Requires PythonCollector ZenPack, ZenPackLib ZenPack (>=2.1.0)
- Compatible with Zenoss 6.7 and Zenoss Cloud
Version 1.0.1 - Download
- Release on 2022/03/17
- Requires PythonCollector ZenPack, ZenPackLib ZenPack (>=2.1.0)
- Compatible with Zenoss 6.7 and Zenoss Cloud
Discovery
The following components will be automatically discovered through the Redfish API hostname you provide. The properties and relationships will be continually maintained.
Redfish Endpoints
- Relationships: Chassis, Computer Systems, Managers
Chassis
- Attributes: Asset Tag, Chassis Type, Depth, Environmental Class, Height, Location, Manufacturer, Model, Part Number, Physical Security, Power State, UUID, SKU, Serial Number, Status / State, Weight, Width, Health Status
- Relationships: Computer Systems, Managers, Chassis, Temperature Sensors, Fans, Power Supplies, Power Controls
Computer Systems
- Attributes: Asset Tag, Bios Version, Boot Order, Host Name, Host Watchdog Timer / Function Enabled, Hosting Roles, Manufacturer, Memory Summary, Model, Part Number, Power Restore Policy, Power State, UUID, SKU, Serial Number, Status / State, Sub Model, System Type, Health Status
- Relationships: Chassis, Managers, Processors, Memory, Ethernet Interfaces, Storages
Managers
- Attributes: Auto DST Enabled, Connect Types Supported, Firmware Version, Manager Type, Model, Power State, UUID, Remote Redfish Service Uri, Service Entry Point UUID, Status / State, Available Logs, Health Status
- Relationships: Computer Systems, Chassis
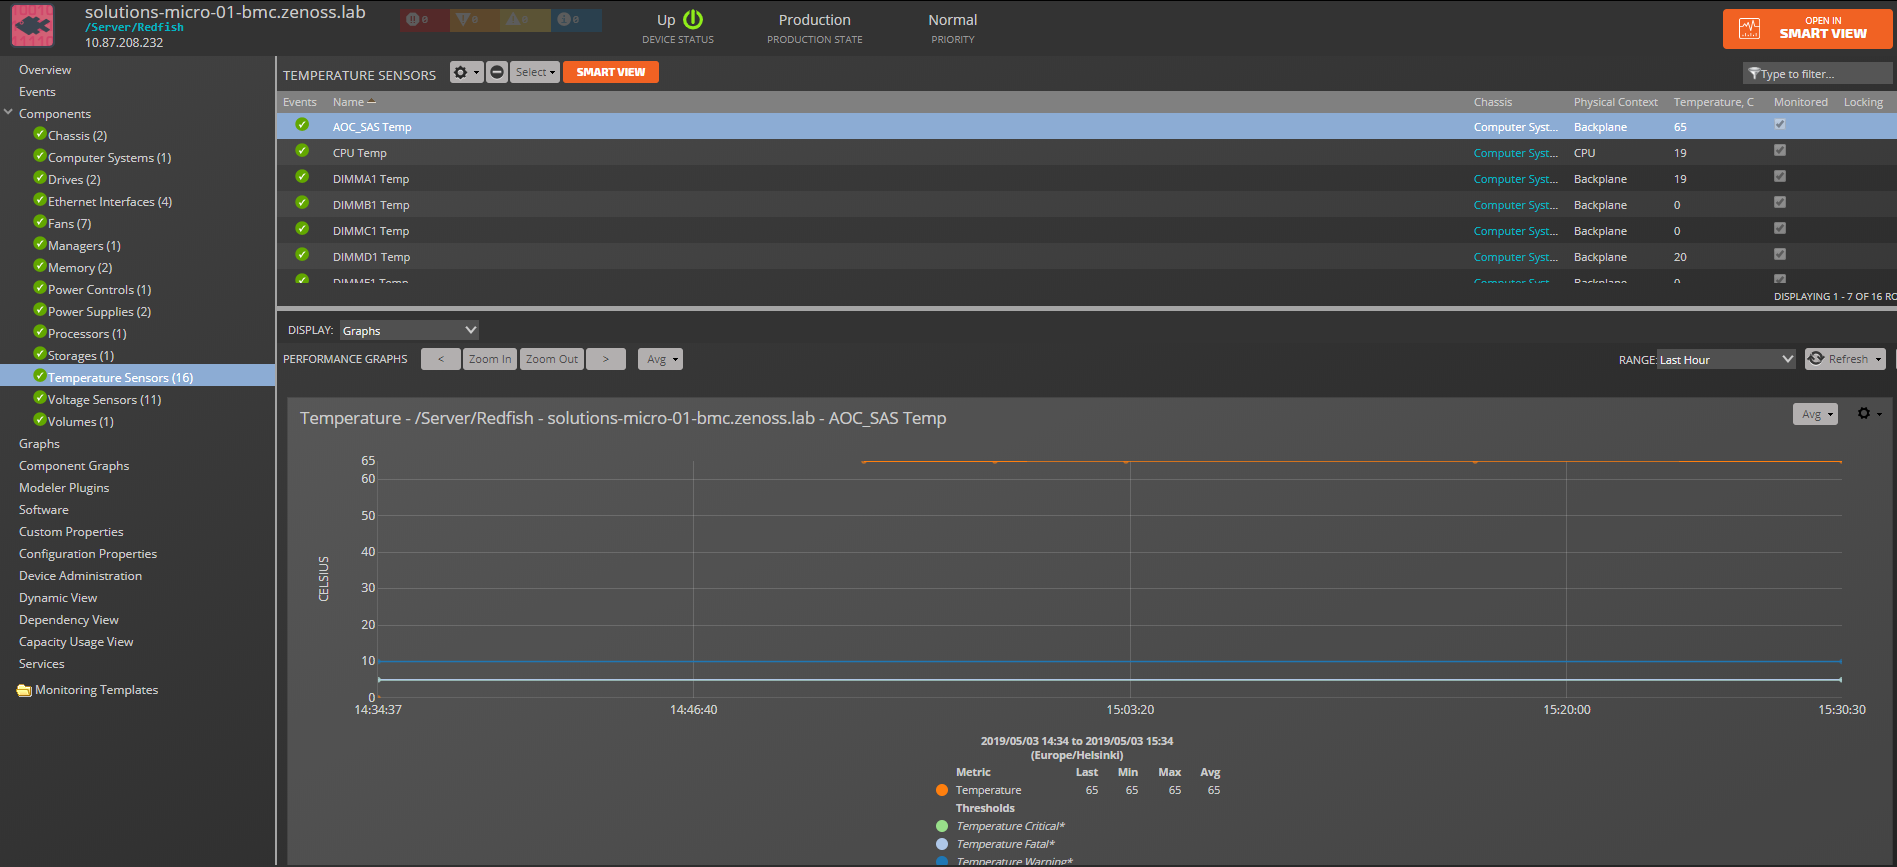
Temperature Sensors
- Attributes: Lower Threshold Critical, Lower Threshold Fatal, Lower Threshold Non Critical, Max Allowable Operating Value, Min Allowable Operating Value, Physical Context, Temperature Celsius, Sensor Number, Status / State, Upper Threshold Critical, Upper Threshold Fatal, Upper Threshold Non Critical, Health Status
- Relationships: Chassis
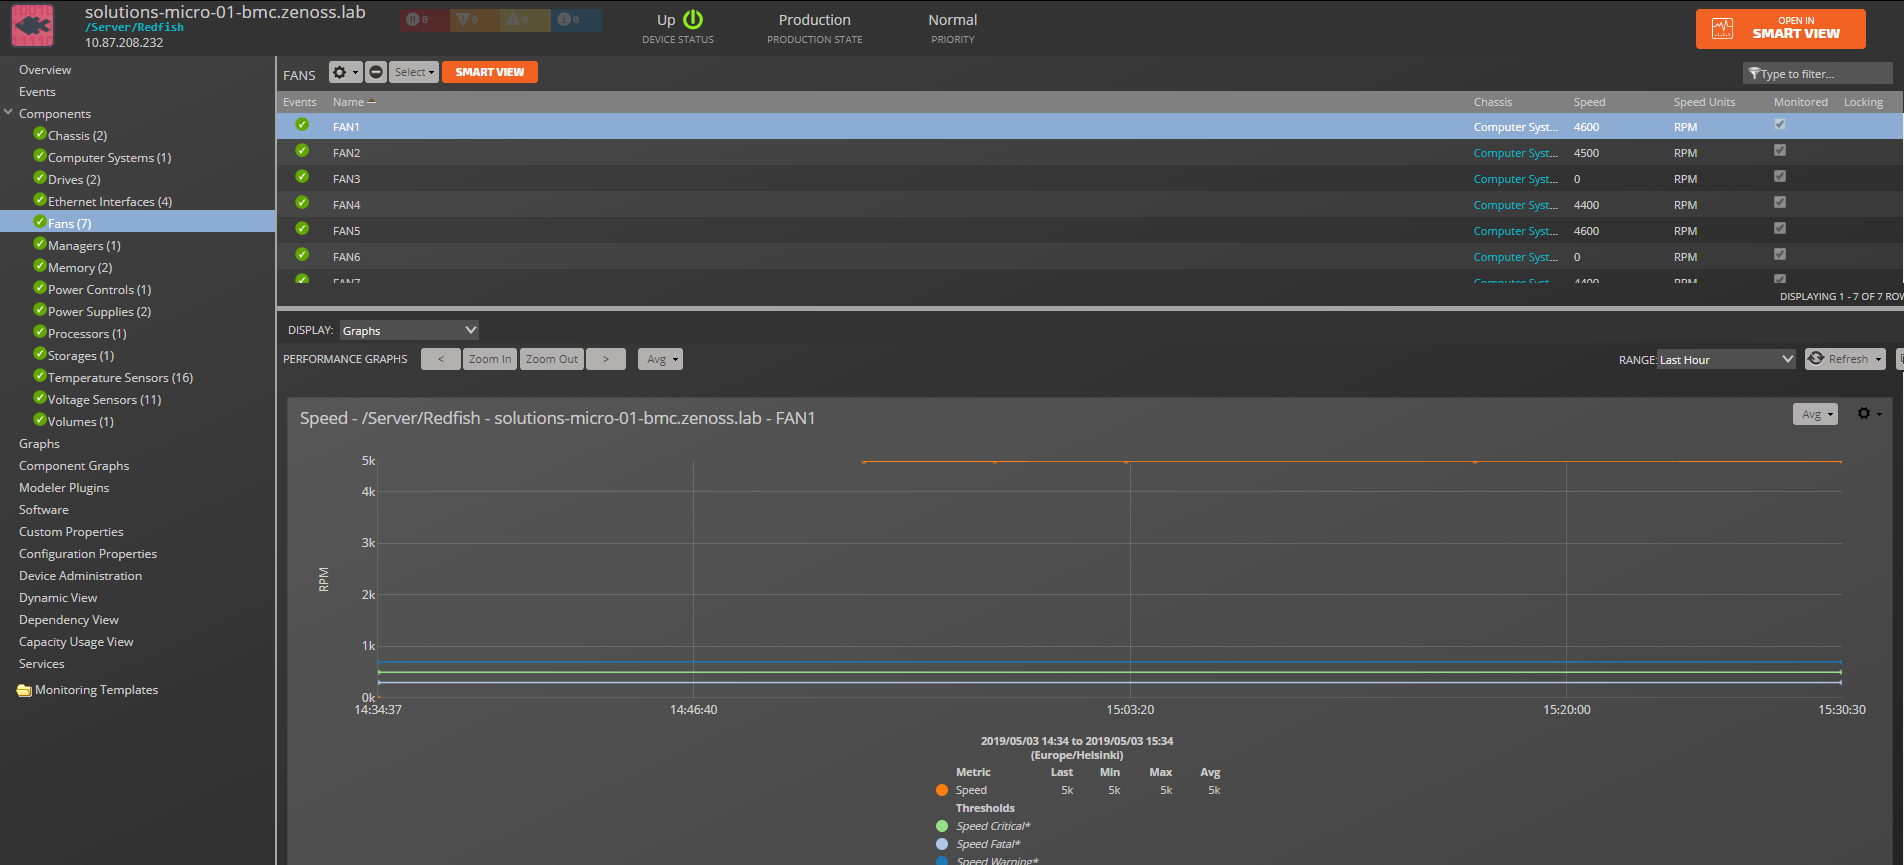
Fans
- Attributes: Fan Name, Hot Pluggable, Location, Lower Threshold Critical, Lower Threshold Fatal, Lower Threshold Non Critical, Manufacturer, Model, Part Number, Physical Context, Speed, Speed Units, Sensor Number, Serial Number, Spare Part Number, Status / State, Upper Threshold Critical, Upper Threshold Fatal, Upper Threshold Non Critical, Health Status
- Relationships: Chassis
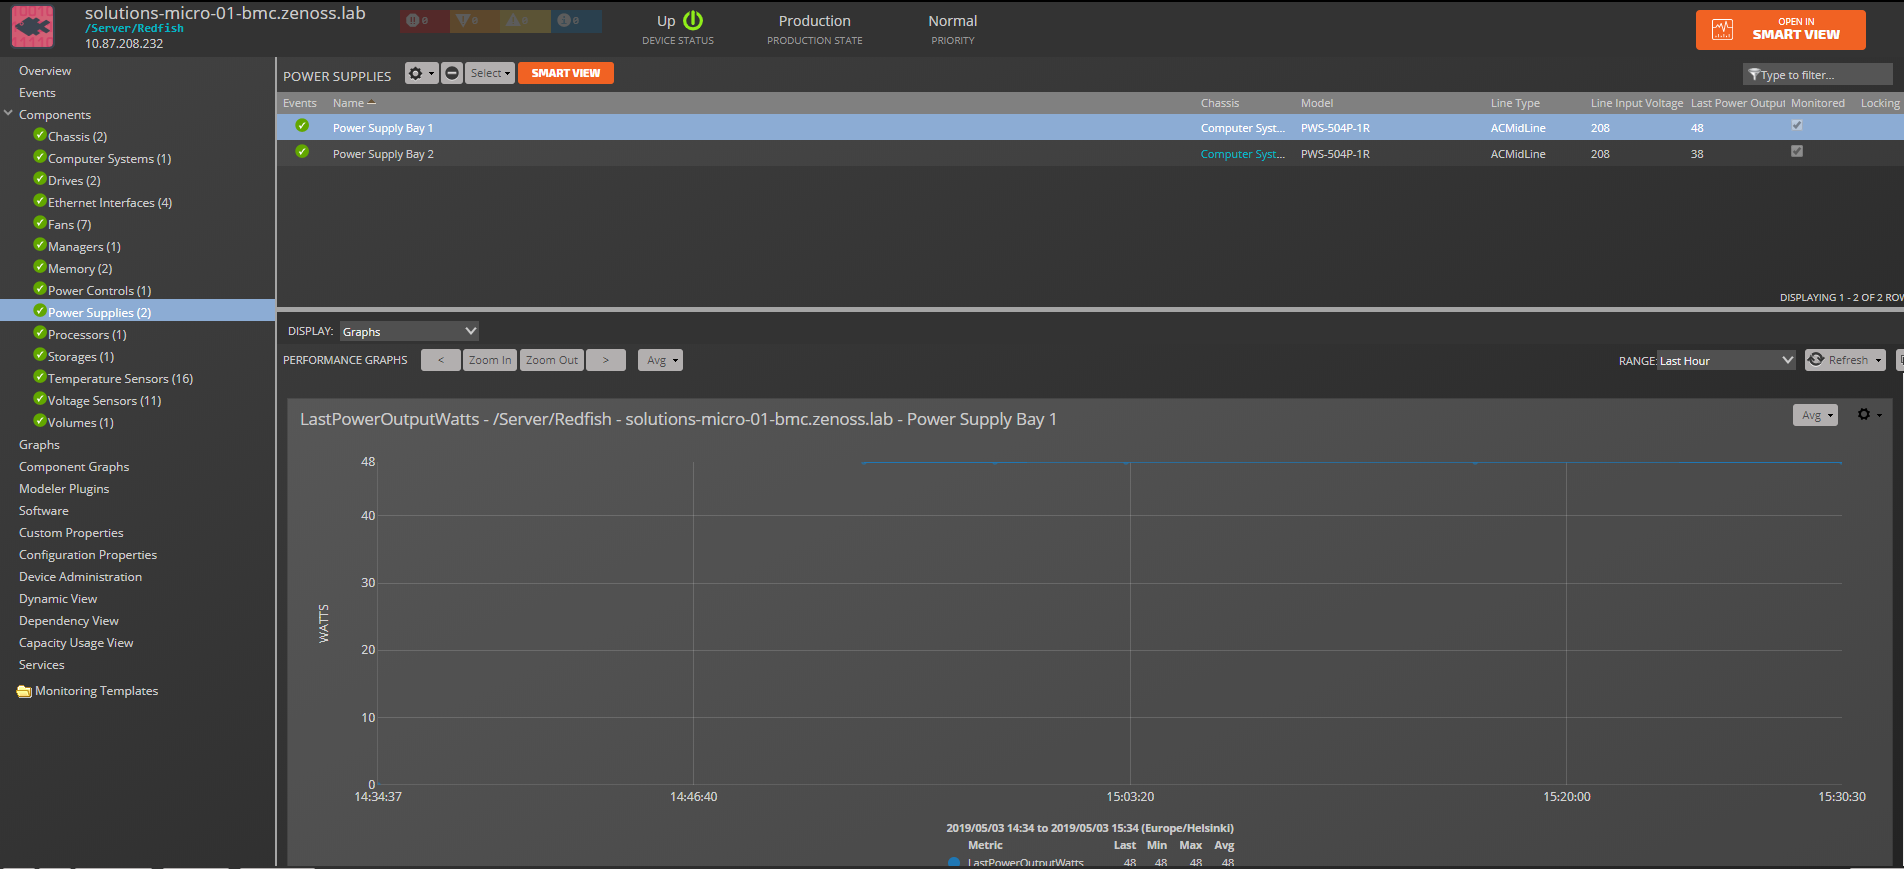
Power Supplies
- Attributes: Firmware Version, Hot Pluggable, Last Power Output Watts, Line Input Voltage, Line Type, Location, Manufacturer, Model, Part Number, Power Capacity Watts, Power Input Watts, Power Output Watts, Type, Serial Number, Spare Part Number, Status / State, Health Status
- Relationships: Chassis
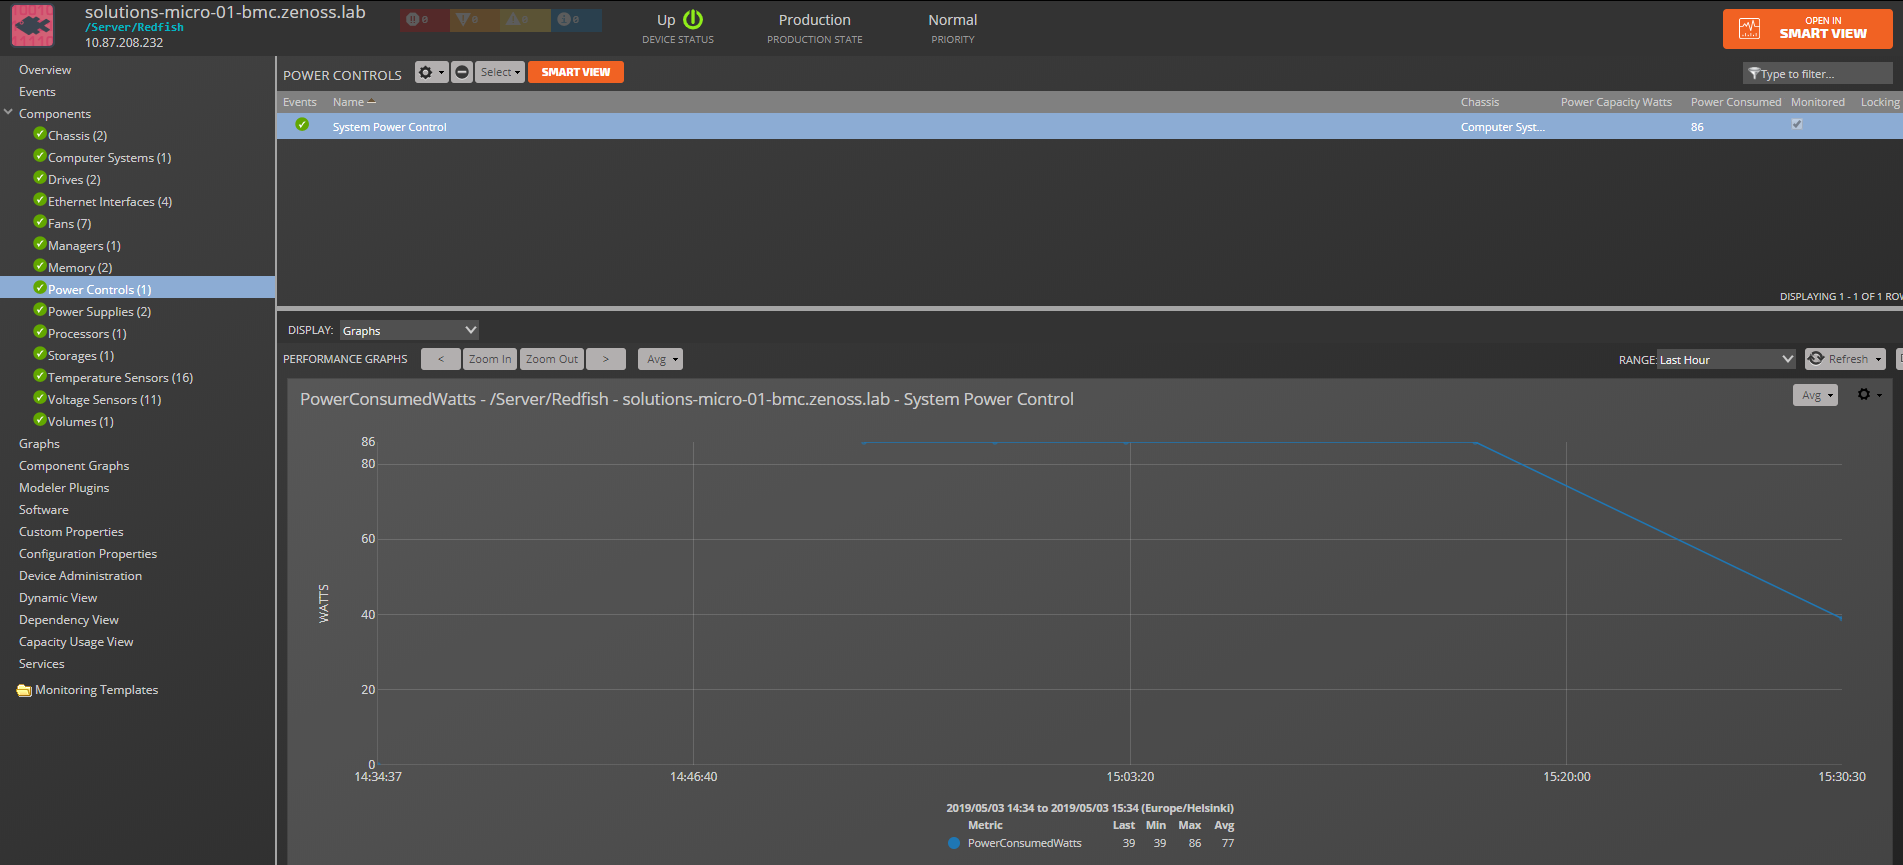
Power Controls
- Attributes: Physical Context, Power Capacity Watts, Power Consumed Watts, Power Limit, Status / State, Health Status
- Relationships: Chassis:
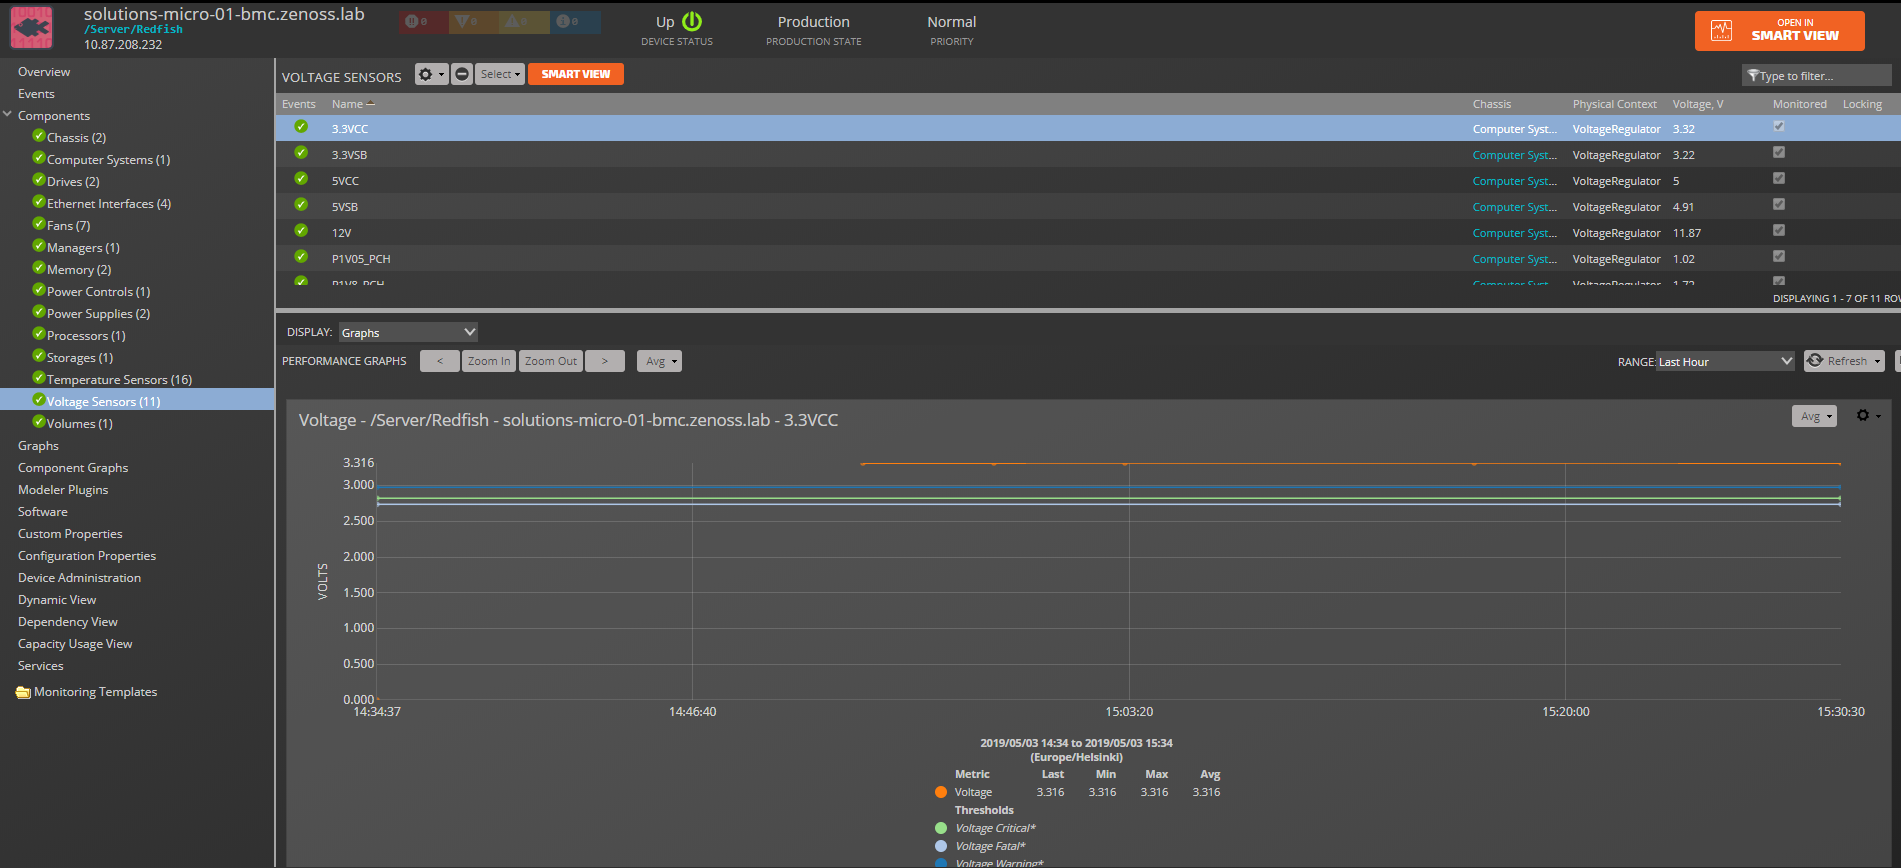
Voltage Sensors
- Attributes: Lower Threshold Critical, Lower Threshold Fatal, Lower Threshold Non Critical, Physical Context, Voltage Volts, Sensor Number, Status / State, Upper Threshold Critical, Upper Threshold Fatal, Upper Threshold Non Critical, Health Status
- Relationships: Chassis
Memory
- Attributes: Allocation Alignment, Allocation Increment, Allowed Speeds, Base Module Type, Bus Width Bits, Cache Size, Capacity, Configuration Locked, Data Width Bits, Device ID, Device Locator, Error Correction, Firmware Api Version, Firmware Revision, Function Classes, Is Rank Spare Enabled, Is Spare Device Enabled, Location, Logical Size, Manufacturer, Max TDPMilli, Memory Type, Memory Location, Memory Subsystem Controller Manufacturer ID, Memory Subsystem Controller Product ID, Memory Type, Module Manufacturer ID, Module Product ID, Non Volatile Size, Operating Memory Modes, Speed, Part Number, Persistent Region Number Limit, Persistent Region Size Limit, Persistent Region Size Max, Power Management Policy, Rank Count, Regions, Security Capabilities, Security State, Serial Number, Spare Device Count, Status / State, Subsystem Device ID, Subsystem Vendor ID, Vendor ID, Volatile Region Number Limit, Volatile Region Size Limit, Volatile Region Size Max, Volatile Size, Health Status
- Relationships: Computer System
Processors
- Attributes: FPGA, Instruction Set, Location, Manufacturer, Max Speed, Max TDP, Model, Processor Architecture, Processor Id, Processor Memory, Processor Type, UUID, Socket, Status / State, TDPWatts, Cores, Threads, Health Status
- Relationships: Computer System
Storages
- Attributes: Status / State, Health Status
- Relationships: Drives, Volumes, Computer System
Drives
- Attributes: Asset Tag, Block Size, Capable Speed, Capacity, Encryption Ability, Encryption Status, Failure Predicted, Hotspare Replacement Mode, Hotspare Type, Identifiers, Indicator LED, Location, Manufacturer, Media Type, Model, Negotiated Speed, Operations, Part Number, Physical Location, Predicted Media Life Left Percent, Protocol, Revision, Rotation Speed, SKU, Serial Number, Status Indicator, Status / State, Health Status
- Relationships: Storage, Volume
Volumes
- Attributes: Block Size, Capacity, Encrypted, Encryption Types, Identifiers, Operations, Optimum IOSize, Status / State, Volume Type, Health Status
- Relationships: Drives, Storage
Ethernet Interfaces
- Attributes: Auto Neg, DHCPv4, DHCPv6, FQDN, Full Duplex, Host Name, IPv4 Addresses, IPv4 Static Addresses, IPv6 Address Policy Table, IPv6 Addresses, IPv6 Default Gateway, IPv6 Static Addresses, IPv6 Static Default Gateways, Interface Enabled, Link Status, MACAddress, MTUSize, Max IPv6 Static Addresses, Name Servers, Permanent MACAddress, Speed, Stateless Address Auto Config, Static Name Servers, Status / State, Uefi Device Path, VLAN, Health Status
- Relationships: Computer System
Management Interfaces
- Attributes: Auto Neg, DHCPv4, DHCPv6, FQDN, Full Duplex, Host Name, IPv4 Addresses, IPv4 Static Addresses, IPv6 Address Policy Table, IPv6 Addresses, IPv6 Default Gateway, IPv6 Static Addresses, IPv6 Static Default Gateways, Interface Enabled, Link Status, MACAddress, MTUSize, Max IPv6 Static Addresses, Name Servers, Permanent MACAddress, Speed, Stateless Address Auto Config, Static Name Servers, Status / State, Uefi Device Path, VLAN, Health Status
- Relationships: Manager
Status Monitoring
There is a RedfishStatus template bound to each component which checks
the component's status every 5 minutes and generates /Status/Redfish
events with severity:
| Zenoss Event Severity | Redfish Component Status |
|---|---|
| Error | Critical |
| Warning | Warning |
| Clear | OK |
Performance Monitoring
The following metrics are collected every 5 minutes by default. Any other Redfish metrics can also be collected by adding them to the appropriate monitoring template.
- Fan:
- Speed: Fan speed
- Temperature:
- Temperature: Temperature in Celsius
- PowerSupply:
- LastPowerOutputWatts: Power output in Watts: LineInputVoltage: Input voltage in Volts:
- PowerControl:
- PowerConsumedWatts: Power consumed in Watts
- Voltage:
- Voltage: Input voltage in Volts
- Drive:
- PredictedMediaLifeLeftPercent: Predicted drive's life left in percents
Event Management
Logs Monitoring
Redfish API provides access to logs that Redfish ZP may fetch and
convert to Zenoss events. There is a separate datasource plugin
(RedfishLogDataSource in Manager template) that performs such work.
As some logs might be a bit chatty (e.g. audit logs may record each
login to Redfish), there is a zRedfishSkipLogs zProperty, which sets a
list of Redfish's logs we don't want to fetch. A list of all available
logs is on each Manager components details page: "Available Logs"
property. We can also suppress unnecessary logs by creating transforms.
Redfish has the next record types: * Event * SEL * Oem
Depending on a record type Redfish ZP will use different strategies for
setting eventKey and severity fields in Zenoss events.
Published events will have the next standard fields: - component:
Redfish Manager component which provides logs - eventKey: unique value
based on a sensor number for SEL events, empty for all other events -
eventClassKey: equal to RedfishLog (mapped to /Redfish/Log event
class). - rcvtime: event creation time taken from Redfish. - summary:
description from the original event - severity: for Event and Oem
types are always Info, for SEL events: * Redfish Ok = Zenoss
Clear * Redfish Warning = Zenoss Warning * Redfish Critical =
Zenoss Error
The following additional fields will also be populated for each event: - redfish.log - redfish.log_id - redfish.entry_type - redfish.message_id - redfish.sensor_number - redfish.sensor_type - redfish.severity
Installed Items
Installing this ZenPack will add the following items to your Zenoss system.
Configuration Properties
zRedfishUserName- Username for remote Redfish service (default:
root) zRedfishPassword- Password for remote Redfish service
zRedfishPort- TCP port of remote Redfish service (default:
443) zRedfishUseSSL- Use SSL for remote Redfish service (default:
True) zRedfishSessionAuth- Use Redfish session login authentication (default:
True) zRedfishSkipLogs- List of logs ids to skip during events fetching
zRedfishCollectionMaxParallel- Number of concurrent connections per device (default:
2) zRedfishIgnoreUpperThresholdZeros- Ignore the 0 (Zero) value for the Upper MinMax threshold to avoid threshold-exceeded events (default:
False)
Device Classes
/Devices/Server/Redfish
Event Classes
/Status/Redfish: The event class covers the Redfish components statuses./Redfish/Log: Redfish Log Entries.
Event Mappings
RedfishStatus: Mapped to/Status/Redfishevent class.RedfishLog: Mapped to/Redfish/Logevent class.
Modeler Plugins
The following plugins will be used for modeling a Redfish device details:
Redfish.Base: The main plugin to retrieve all information.
Datasource Types
RedfishRedfish Log
Monitoring Templates
RedfishStatus(/Server/Redfish)Manager(/Server/Redfish)Fan(/Server/Redfish)Temperature(/Server/Redfish)PowerSupply(/Server/Redfish)PowerControl(/Server/Redfish)Voltage(/Server/Redfish)Drive(/Server/Redfish)
Service Impact and Root Cause Analysis
When combined with the Zenoss Service Dynamics product, this ZenPack adds a built-in service impact and root cause analysis capabilities for services running on Redfish-enabled devices. The service impact relationships shown in the diagram and described below are automatically added. These will be included in any services that contain one or more of the explicitly mentioned components.
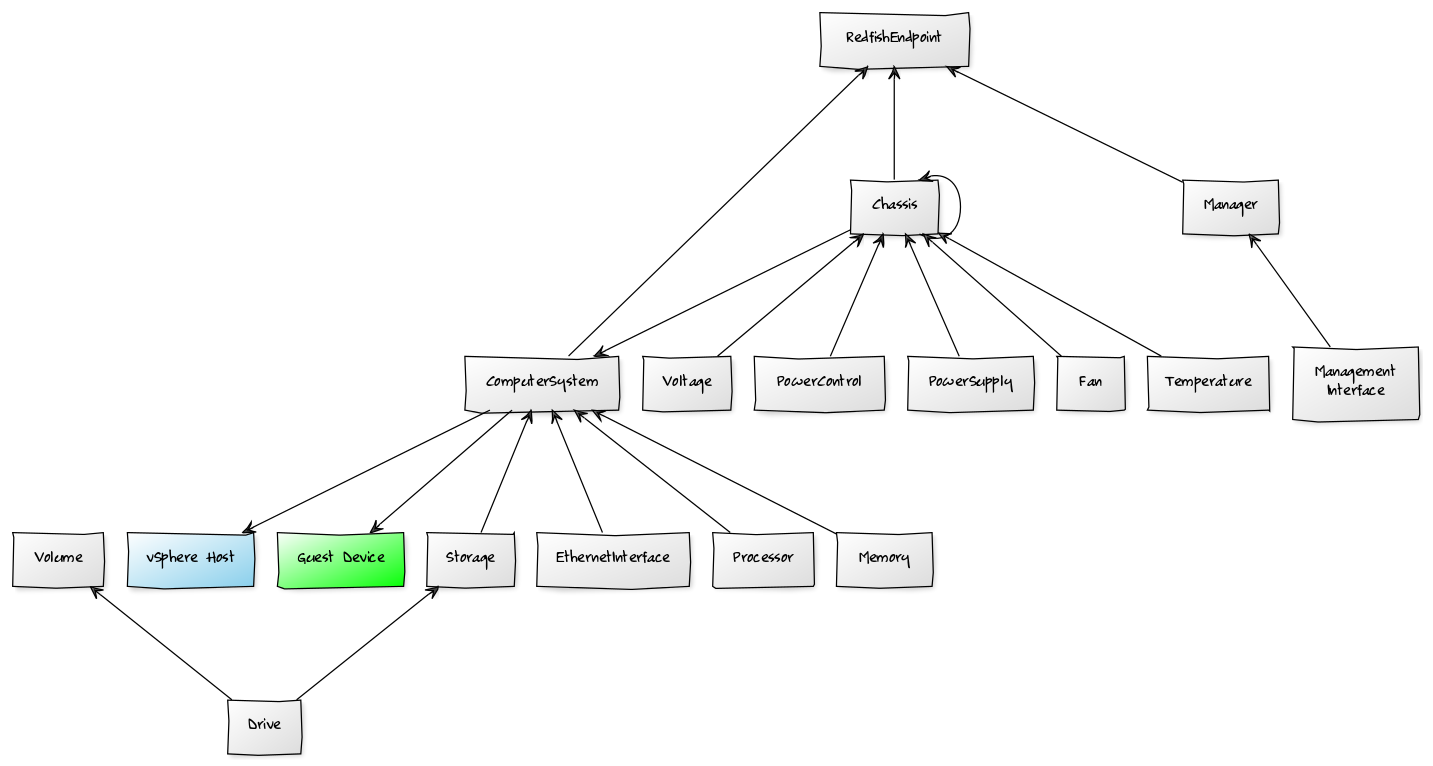
Internal Impact Relationships:
- Chassis, Computer System and Manager impacts Redfish device
- Power Control, Power Supply, Fan, Temperature and Voltage Sensor impacts Chassis
- Chassis impacts contained chassis
- Chassis impacts related Computer System
- Processor, Memory, Ethernet Interface and Storage impacts Computer System
- Drive impacts Storage and Volume
- Management Interface impacts Manager
External Impact Relationships:
- Computer System impacts Guest devices run on it
- Computer System impacts vSphere hosts run on it
Usage
Adding Redfish Endpoint
Use the following steps to start monitoring Redfish device using the Zenoss web interface:
- Navigate to the Infrastructure page.
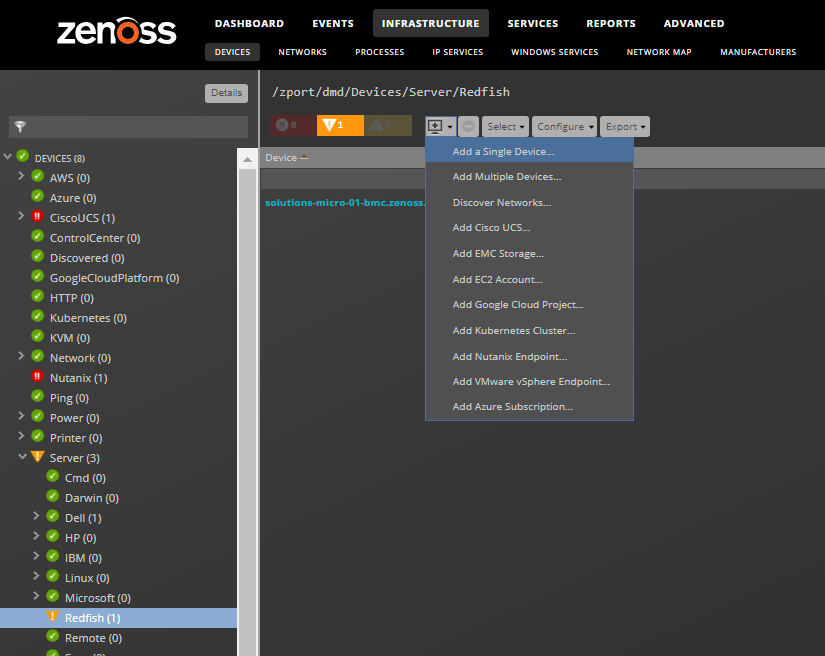
- Navigate to organizer
Devices/Server/Redfish. - Choose to Add a Single Device from the add button.
Fill out the form.
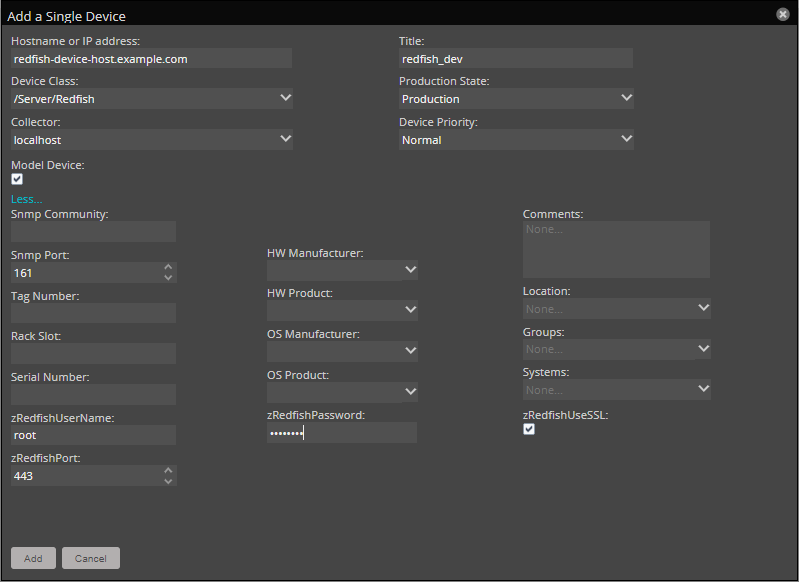
- Name can be anything you want.
- Hostname or IP hostname or IP address of Redfish API endpoint (as usual it is a host of server's BMC interface).
- Click More... and fill Redfish username, password, port, and SSL flag.
- Click ADD.
zenbatchload
Alternatively, you can use zenbatchload to add devices from the
command line. To do this, you must create a file with contents similar
to the following. Replace all values in angle brackets with your values
minus the brackets. Multiple devices can be added under the same
sections.
'/Devices/Server/Redfish' <device_host> zRedfishUserName='<username>', zRedfishPassword='<password>', zRedfishPort=443, zRedfishUseSSL='true'
Example:
'/Devices/Server/Redfish' supermicro-bmc.example.com zRedfishUserName='root', zRedfishPassword='$ecret'
You can then load the Devices using zenbatchload with the following
command:
zenbatchload <filename>
Configuring and Testing Redfish Datasource
Redfish datasource along with standard ones has two additional configuration fields:
- Component OpenData Id
- Metric Path
"Component OpenData Id" defines internal Redfish Id which is the same as
HTTP path in Redfish API. There is no needs to change this field as by
default value is taken from the monitored component property oid,
which is set during modeling.
"Metric path" specifies a path to the requested value, which is a list
of dict's keys separated by slashes. A zero-based index might be used to
point the list's item integer, also according to Redfish's
specifications all lists elements should have a MemberId value, which
might be used as a key instead of an index.
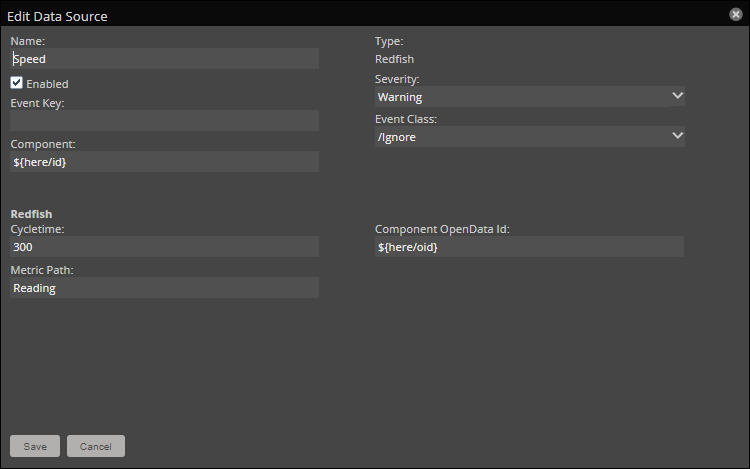
You may use the "Test" button to check whether provided parameters are
correct. Before testing datasource you need to set a valid device name
in Device Name input field. In the case of an empty "Metric path"
field, the test window will show a whole resource output in JSON format,
which might be useful if you need to find the correct value for this
field.
Limitations
Please consider the responsiveness of your target devices when the same system is monitored by different Zenoss instances and/or other tools. Multiple issues can be caused by monitoring some devices with several monitoring tools.
Also, be aware that some vendors can provide less data through Redfish API.
Changes
1.0.3
- Fixed incomplete log entries causing ambiguous events (ZPS-9078)
- Added EthernetInterface LinkStatus monitoring with events on link state changes (ZPS-9049)
- Tested with Virtana Service Observability (formerly Zenoss Cloud), Virtana Resource Manager 6.9.0, Service Impact 5.7.2
1.0.2
- Enhanced monitoring and modeling for absent Redfish zenpack components (ZPS-8975)
- Resolved temperature sensor voltage issues triggering warnings on non-zero values (ZPS-8233)
- Fixed Redfish device modeling Data follows error (ZPS-8157)
- Tested with Zenoss Cloud, Zenoss 6.7.0, and Service Impact 5.7.0
1.0.1
- Improved URI fragmentation for devices (ZPS-8019).
- Improved monitoring for Nokia AirFrame (ZPS-7604).
- Improved the drive mapping (ZPS-7984).
- Tested with Zenoss Cloud, Zenoss 6.6.0, and Service Impact 5.5.5.
1.0.0
- Initial release.
- Tested with Zenoss Resource Manager 6.3.2, Zenoss Cloud and Service Impact 5.3.4.