Solaris
ZenPacks.zenoss.SolarisMonitor
The SolarisMonitor ZenPack enables Resource Manager to use either Secure Shell (SSH) or the Simple Network Management Protocol (SNMP) to monitor Solaris hosts. Resource Manager models and monitors devices placed in the /Server/Solaris or /Server/SSH/Solaris device classes. Data collection is performed on the Resource Manager server (if using a local collector) or on a distributed collector. The account used to monitor the device does not require root access or special privileges.
This ZenPack enables Resource Manager to model and monitor the following Solaris features:
- File system and process monitoring
- Network interfaces and route modeling
- CPU utilization information
- Hardware information (memory, number of CPUs, and model numbers)
- OS information (OS-level, command-style information)
- Pkginfo information (such as installed software)
- Sun Solaris LDOM servers discovery and monitoring.
- Solaris Zones discovery and monitoring.
- Oracle Solaris Cluster environment information and monitoring.
Applications Monitored: Solaris (9, 10, 11), OpenSolaris (5.11)
Commercial
This ZenPack is developed and supported by Zenoss Inc. Commercial ZenPacks are available to Zenoss commercial customers only. Contact Zenoss to request more information regarding this or any other ZenPacks. Click here to view all available Zenoss Commercial ZenPacks.
Support
This ZenPack is included with commercial versions of Zenoss and enterprise support for this ZenPack is provided to Zenoss customers with an active subscription.
Releases
Version 2.5.2 - Download
- Summary of changes: Improved support for Solaris 10 and 11
- Released on 2018/11/16
- Tested with Zenoss Cloud, Zenoss Resource Manager 6.2.1 and 5.3.3
Version 2.5.1 - Download
- Summary of changes: Fix performance issue with Zenoss Analytics.
- Released on 2017/10/31
- Compatible with Zenoss Resource Manager 4.2.x, Zenoss Resource Manager 5.x.x
Version 2.4.2 - Download
- Summary of changes: Added support for updating zone status during monitoring.
- Released on 2016/09/06
- Compatible with Zenoss Resource Manager 4.2.x, Zenoss Resource Manager 5.x.x
Version 2.3.1 - Download
- Summary of changes: Adds support for Solaris Cluster.
- Released on 2015/04/07
- Compatible with Zenoss Resource Manager 4.2.x, Zenoss Resource Manager 5.x.x
Version 2.2.0 - Download
- Summary of changes: Adds support for zones.
- Released on 2014/01/27
- Compatible with Zenoss Resource Manager 4.2.x
Discovery
This ZenPack will attempt to discover the following entities. The attributes and collections will be updated on Zenoss' normal remodeling interval which defaults to every 12 hours.
Processors
- Attributes
- Manufacturer
- Model
- Socket
- Clock Speed
- Ext Speed
- Voltage
- L1
- L2
File System
- Attributes
- Mount Point
- Status
- Storage Device
- Type
- Block Size
- Total Bytes
- Used Bytes
- Available Bytes
- Capacity Bytes
- Total Files
- Available Files
- Capacity Files
- Maximum Name Length
Interfaces
- Attributes
- Name
- Description
- Administrative Status
- Operational Status
- IP Addresses (Primary)
- IP Addresses (All)
- MAC Address
- Type
- Speed
- Duplex Mode
- MTU
Network Routes
- Attributes
- Destination
- Next Hop
- Interface
- Protocol
- Type
Processor Pools
- Attributes
- System ID
- Name
- Comment
- Importance
- Is Active
- Is Default
IP Services
- Attributes
- Name
- Description
- Service Class
- Port
- Protocol
- IP Addresses
- Management IP Addresses
- Discovery Agent
- Fail Severity
- Send String
- Expect Regex
Hard Disks
- Attributes
- Name
- Status
Performance Monitoring
The following metrics will be collected every 5 minutes by default.
Device
- Load Average: 15 Minute, 5 Minute, 1 Minute (processes)
- CPU Utilization: System, User, Idle (percent)
- Memory Utilization: User, Swap Used (percent)
- IO: Writes, Reads (bytes/sec)
File Systems
- Utilization: Used Blocks (percent)
- Inode Utilization: Used Inodes (percent)
Interfaces
- Throughput: Inbound, Outbound (bits/sec)
- Packets: ifInPackets, ifOutPackets (packets/sec)
Processor Pools
- Pset Borders: Max, Min (count)
- Pset Load: CPUs (count)
- Pset Size: CPUs (count)
- Pset Usage: CPUs (count)
Hard Disks
- Reads per second (reads/sec)
- Writes per second (writes/sec)
- Kilobytes read per second (kB/sec)
- Kilobytes written per second (kB/sec)
- Avg Wait (transactions)
- Avg Transactions being serviced (transactions)
- Avg Service Time in Wait Queue (ms)
- Avg Service Time (ms)
- Time when Queue is Non-empty (percent)
- Time the Disk is Busy (percent)
Zone Features
Solaris Zones information is collected using Secure Shell (SSH) and will be displayed as components of the Zones host server.
It is required to have Solaris 11 or above in order to collect and monitor Zones information.
Discovery
The following entities will be discovered.
Zones
- Attributes
- Name
- Path
- Brand
- IP Type
- Zone Status
- Autoboot
- Host ID
- Capped CPU
- Capped Memory
- Relationships
- Zone File Systems
- Zone Network Adapters
- Zone Dedicated CPUs
Zone File Systems
- Attributes
- Name
- FS Type
- Special
- Raw
Zone Network Adapters
- Attributes
- Name
- IP Address
- Network Mask
- Physical NIC
- Default Router
Zone Dedicated CPUs
- Attributes
- Name
- Importance
Performance Monitoring
The following metrics will be collected every 5 minutes by default.
Zones
- CPU Utilization: Usage (percent)
- Memory Utilization: Usage (bytes)
- Swap Utilization: Usage (bytes)
Solaris 10 only:
- Light-Weight Process: lwps (count)
- Number of Processes: nproc (count)
- Zone File Systems
- File System Size: System Size (bytes)
- Zone Network Adapters
- Errors: Incoming packet errors, Outgoing packet errors (count)
- Packets: Packets incoming, Packets outgoing (count)
Non-global Zone only:
- Collisions: Collisions (count)
- Queue: Queue (count)
LDOM Features
LDOM information is collected using the Simple Network Management Protocol (SNMP). The discovered LDOM information will be displayed as components of the LDOM host server.
Discovery
The following entities will be discovered.
LDOM
- Attributes
- LDOM
- Guest Device
- Host ID
- MAC Address
- Memory
- VCPUs
- Oper State
LDOM Virtual CPUs
- Attributes
- LDOM
- VCPU ID
- Core ID
- CPU Bind
- CPU Bind Usage
- Percentage Utilized
- Oper Status
LDOM Virtual Disk Services
- Attributes
- LDOM
- Disk Service Name
- Available Volume
- Used Volume
Performance Monitoring
The following metrics will be collected every 5 minutes by default.
LDOM Virtual CPUs
- CPU Utilization: Utilized (percent)
LDOM Virtual Disk Services
- Volumes: Available, Volume (volumes)
LDOM Device Discovery
You can optionally configure each Solaris LDOM server to attempt to discover and monitor the guest operating systems running within each Solaris LDOM. This requires that your Zenoss system has the network and server access it needs to monitor the guest system.
Configure LDOM Device Discovery
- Navigate to the Configuration Properties panel.
- Checkmark zLDOMsAutodiscover to set it to true.
Cluster Features
Cluster information is collected using Secure Shell (SSH) and will be displayed as components of the Cluster server.
Discovery
The following entities will be discovered.
Cluster Nodes
- Attributes
- Name
- IP Address
- Node Status
- Relationships
- Cluster DIDs
- Cluster Resource Groups
ClusterDeviceGroup
- Attributes
- Name
- Device Group Status
Cluster DIDs
- Attributes
- Name
- Full Path
- Replication
- DID Status
ClusterIPMPGroup
- Attributes
- Name
- IPMP Group Status
ClusterNASDevice
- Attributes
- Name
- NAS Type
Cluster Resources
- Attributes
- Name
- Resource Group
- Status Message
- Resource State
Cluster Resource Groups
- Attributes
- Name
- Node Name
- Suspended
- Resource Group State
- Relationships
- Cluster Resources
Cluster Switches
- Attributes
- Name
- Type
- State
- Relationships
- Cluster Switch Ports
Cluster Switch Ports
- Attributes
- Name
- Port State
Cluster Transport Paths
- Attributes
- Endpoint #1
- Endpoint #2
- Transport Path Status
Performance Monitoring
The following metrics will be collected every 5 minutes by default.
Cluster (Device)
- Nodes: Offline Nodes, Online Nodes, Total Nodes (count)
- Quorum: Votes Needed, Votes Possible, Votes Present (count)
Cluster Node Device Discovery
You can optionally configure each Solaris Cluster server to attempt to discover and monitor the guest operating systems running within each Solaris Cluster node. This requires that your Zenoss system has the network and server access it needs to monitor the guest system.
Configure Cluster Node Device Discovery
- Navigate to the Configuration Properties panel.
- Checkmark zNodesAutodiscover to set it to true.
Service Impact
When combined with the Zenoss Service Dynamics product, this ZenPack adds built-in service impact capability for Solaris. The following service impact relationships are automatically added. These will be included in any services that contain one or more of the explicitly mentioned entities.
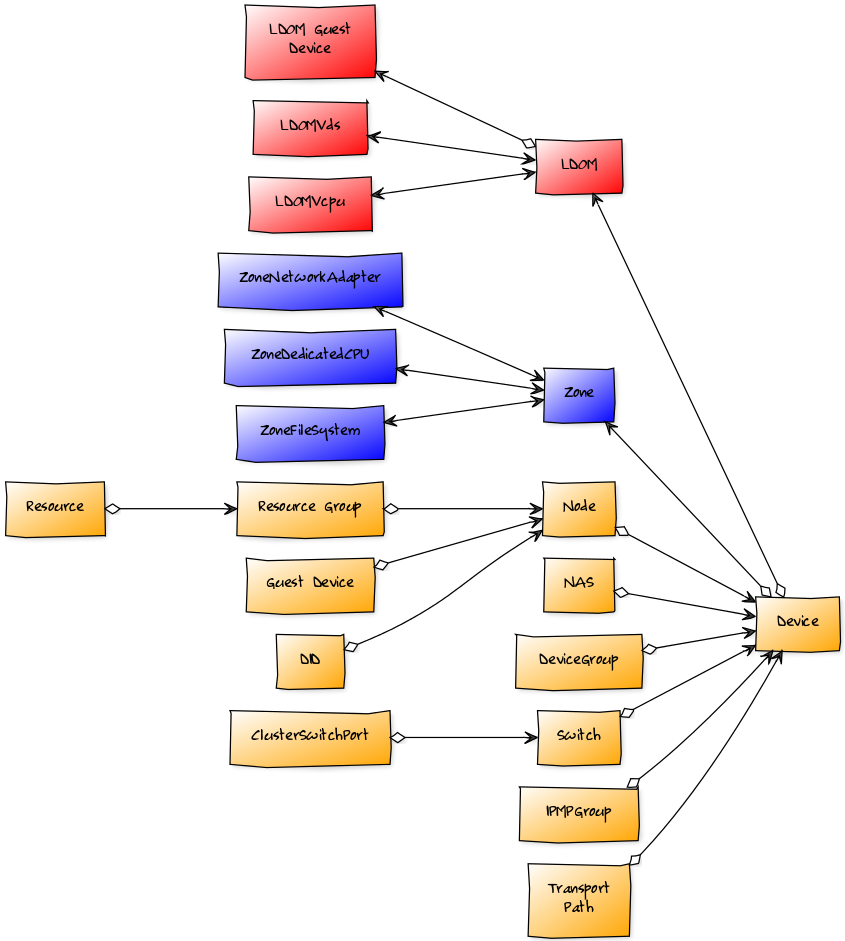
Impact Relationship Diagram
Solaris Impact Relationships
- Zone or LDOM failure affects related device.
- Zone File System, Zone Network Adapter or Zone Dedicated CPU failure affects related Zone.
- LDOM Virtual CPUs, LDOM Virtual Disk Services failure affects related LDOM.
Cluster Impact Relationships
- Node, NAS Device, Device Group, Switch, IPMP Group of Transport Path failure affects related device.
- Resource Group or DID failure affects related Node.
- Resource failure affects related Resource Group.
- Switch Port failure affects related Switch.
- Node is affected by the associated device failure.
Usage
Depending on the version of Solaris you may be able to monitor the server using either SSH or SNMP. For OpenSolaris and Solaris 10, you can choose to use either SSH or SNMP monitoring. For Solaris 9, only SSH monitoring is supported.
Configure SSH Monitoring
Use the following steps to configure Zenoss to monitor your Solaris server(s) using SSH.
- Navigate to the /Server/SSH/Solaris device class' configuration properties.
- Verify that the zCommandUsername and zCommandPassword are set to valid login credentials.
- Add your Solaris server(s) to the /Server/SSH/Solaris device class.
Note: For Solaris 10 add your Solaris server(s) to the /Server/SSH/Solaris/Solaris10 device class.
Configure SNMP Monitoring
Use the following steps to configure Zenoss to monitor your Solaris server(s) using SNMP.
- Verify that the snmpd process is running on your Solaris server(s).
- Navigate to the /Server/Solaris device class' configuration properties.
- Verify that your Solaris server(s) SNMP community strings are listed in the zSnmpCommunities property.
- Add your Solaris server(s) to the /Server/Solaris device class.
Configure LDOM Monitoring
For OpenSolaris and Solaris 10 servers you will also get support for monitoring LDOMs if they're used on the server. However, this monitoring is always performed using SNMP. If you're already monitoring your Solaris server using SNMP there is no additional configuration required to monitor its LDOMs. If you configured Zenoss to monitor your Solaris server using SSH you should take the following steps to monitor LDOMs.
- Verify that the snmpd process is running on your Solaris server(s).
- Navigate to the /Server/SSH/Solaris device class' configuration properties.
- Verify that your Solaris server(s) SNMP community strings are listed in the zSnmpCommunities property.
- Navigate to the Modeler Plugins panel and enable zenoss.snmp.solaris.ldommap plugin.
- Remodel your Solaris server(s) if they're already in the system. Otherwise add them to the /Server/SSH/Solaris device class.
Configure Cluster Monitoring
This ZenPack also provides support for monitoring Solaris Cluster, however, this monitoring is always performed using SSH. Use the following steps to configure Zenoss to monitor your Solaris Cluster server(s).
- Add your Solaris Cluster server(s) to the /Server/SSH/Solaris/Cluster device class.
- Verify that the zCommandUsername and zCommandPassword are set to valid login credentials.
- Verify that zenoss.cmd.solaris.cluster is selected on the Modeler Plugins panel.
By default zenoss.cmd.solaris.cluster_did modeler plugin is unselected. To enable Cluster DIDs collection move it to selected plugins box. To monitor DIDs statuses enable didstatuses data source in Cluster monitoring template. It is disable dy default by performance reasons.
Note: For Solaris 10 Cluster add your Solaris server(s) to the /Server/SSH/Solaris/Solaris10/Cluster device class.
Troubleshooting
Please refer to the Zenoss Service Dynamics documentation if you run into any of the following problems:
- ZenPack will not install
- Adding a device fails
- Don't understand how to add a device
- Don't understand how to model a device
If you cannot find the answer in the documentation, then Resource Manager (Service Dynamics) users should contact Zenoss Customer Support. Core users can use the #zenoss IRC channel or the community.zenoss.org forums.
Resolving CHANNEL_OPEN_FAILURE Issues
The zencommand daemon's log file ($ZENHOME/collector/zencommand.log) may
show messages stating:
ERROR zen.SshClient CHANNEL_OPEN_FAILURE: Authentication failure
WARNING:zen.SshClient:Open of command failed (error code 1): open failed
If the sshd daemon's log file on the remote device is examined, it may
report that the MAX_SESSIONS number of connections has been exceeded and
that it is denying the connection request. In the OpenSSH daemons, this
MAX_SESSIONS number is a compile-time option and cannot be reset in a
configuration file.
To work around this sshd daemon limitation, use the configuration property zSshConcurrentSessions to control the number of connections created by zencommand to the remote device:
- Navigate to the device or device class in the Resource Manager
interface.
- If applying changes to a device class:
- Select the class in the devices hierarchy.
- Click Details.
- Select Configuration Properties.
- If applying changes to a device:
- Click the device in the device list.
- Select Configuration Properties.
- If applying changes to a device class:
- Set the zSshConcurrentSessions property. Try 10 first, and 2 if that doesn't resolve the problem.
Resolving Command Timeout Issues
The zencommand daemon's log file ($ZENHOME/collector/zencommand.log) may
show messages stating:
WARNING:zen.zencommand:Command timed out on device device_name: command
If this occurs, it usually indicates that the remote device has taken too long to return results from the commands. To increase the amount of time to allow devices to return results, change the configuration property zCommandCommandTimeout to a larger value.
- Navigate to the device or device class in the Resource Manager
interface.
- If applying changes to a device class:
- Select the class in the devices hierarchy.
- Click Details.
- Select Configuration Properties.
- If applying changes to a device:
- Click the device in the device list.
- Select Configuration Properties.
- If applying changes to a device class:
- Increase the zCommandCommandTimeout property incrementally to a maximum of 240 until the timeout is resolved.
Blank Fields in Analytics View
Having blank fields when creating Ad Hoc Views in Analytics server may mean that your device have been monitored before Analytics support was implemented for this ZenPack. To resolve this, you have to delete the dimension tables for Solaris components in the reporting database on the analytics server and restart the ZenETL daemons.
Known issues
This zenpack uses df utility to monitor filesystems capacity, and this
utility could give misleading results for ZFS. When there are more then
one filesystems in the same disk pool, the used plus free space for them
will be less than total space, because some of it will be used for other
filesystem. See: Oracle Solaris ZFS and Traditional File System Differences.
Zenoss Analytics
This ZenPack provides additional support for Zenoss Analytics. Perform the following steps to install extra reporting resources into Zenoss Analytics after installing the ZenPack.
- Copy analytics-bundle.zip from $ZENHOME/ZenPacks/ZenPacks.zenoss.SolarisMonitor*/ZenPacks/zenoss/SolarisMonitor/analytics/ on your Zenoss server.
- Navigate to Zenoss Analytics in your browser.
- Login as superuser.
- Remove any existing SolarisMonitor ZenPack folder.
- Choose Repository from the View menu at the top of the page.
- Expand Public in the list of folders.
- Right-click on SolarisMonitor ZenPack folder and choose Delete.
- Confirm deletion by clicking OK.
- Add the new SolarisMonitor ZenPack folder.
- Choose Server Settings from the Manage' menu at the top of the page.
- Choose Import in the left page.
- Remove checks from all check boxes.
- Click Choose File to import a data file.
- Choose the analytics-bundle.zip file copied from your Zenoss server.
- Click Import.
You can now navigate back to the SolarisMonitor ZenPack folder in the repository to see the following resources added by the bundle.
Domains
- SolarisMonitor Domain
- SolarisMonitor Zone Domain
- SolarisMonitor Cluster Domain
Domains can be used to create Ad Hoc views using the following steps.
- Choose Ad Hoc View from the Create menu.
- Click Domains at the top of the data chooser dialog.
- Expand Public then SolarisMonitor ZenPack.
- Choose the SolarisMonitor Domain domain
Installed Items
Installing this ZenPack will add the following items to your Zenoss system.
Configuration Properties
- zLDOMsAutodiscover
- zNodesAutodiscover
Device Classes
- /Server/Solaris
- /Server/SSH/Solaris
- /Server/SSH/Solaris/Solaris10
- /Server/SSH/Solaris/Cluster
- /Server/SSH/Solaris/Solaris10/Cluster
Modeler Plugins
- zenoss.cmd.solaris.cluster
- zenoss.cmd.solaris.cluster_did
- zenoss.cmd.solaris.cpu
- zenoss.cmd.solaris.df_ag
- zenoss.cmd.solaris.ifconfig
- zenoss.cmd.solaris.iostat
- zenoss.cmd.solaris.kstat
- zenoss.cmd.solaris.memory
- zenoss.cmd.solaris.netstat_an
- zenoss.cmd.solaris.netstat_r_vn
- zenoss.cmd.solaris.solaris_uname_a
- zenoss.cmd.solaris.pkginfo
- zenoss.cmd.solaris.process
- zenoss.cmd.solaris.prpool
- zenoss.cmd.solaris.uname_a
- zenoss.cmd.solaris.zone
- zenoss.snmp.CpuMap
- zenoss.snmp.DeviceMap
- zenoss.snmp.IpServiceMap
- zenoss.snmp.HRFileSystemMap
- zenoss.snmp.HRSWInstalledMap
- zenoss.snmp.HRSWRunMap
- zenoss.snmp.InterfaceMap
- zenoss.snmp.NewDeviceMap
- zenoss.snmp.RouteMap
- zenoss.snmp.solaris.hostid
- zenoss.snmp.solaris.ldommap
Monitoring Templates
- ClusterDevice (in /Server/SSH/Solaris/Cluster)
- ClusterDevice (in /Server/SSH/Solaris/Solaris10/Cluster)
- ClusterDID (in /Server/SSH/Solaris/Cluster)
- ClusterDID (in /Server/SSH/Solaris/Solaris10/Cluster)
- ClusterIPMPGroup (in /Server/SSH/Solaris/Cluster)
- ClusterIPMPGroup (in /Server/SSH/Solaris/Solaris10/Cluster)
- ClusterNode (in /Server/SSH/Solaris/Cluster)
- ClusterNode (in /Server/SSH/Solaris/Solaris10/Cluster)
- ClusterResource (in /Server/SSH/Solaris/Cluster)
- ClusterResource (in /Server/SSH/Solaris/Solaris10/Cluster)
- ClusterResourceGroup (in /Server/SSH/Solaris/Cluster)
- ClusterResourceGroup (in /Server/SSH/Solaris/Solaris10/Cluster)
- ClusterSwitch (in /Server/SSH/Solaris/Cluster)
- ClusterSwitch (in /Server/SSH/Solaris/Solaris10/Cluster)
- ClusterSwitchPort (in /Server/SSH/Solaris/Cluster)
- ClusterSwitchPort (in /Server/SSH/Solaris/Solaris10/Cluster)
- ClusterTransportPath (in /Server/SSH/Solaris/Cluster)
- ClusterTransportPath (in /Server/SSH/Solaris/Solaris10/Cluster)
- ZoneContainer (in /Server/SSH/Solaris)
- ZoneFileSystem (in /Server/SSH/Solaris)
- ZoneNetworkAdapter (in /Server/SSH/Solaris)
- Solaris10GlobalZoneNetworkAdapter (in /Server/SSH/Solaris/Solaris10)
- Solaris10ZoneNetworkAdapter (in /Server/SSH/Solaris/Solaris10)
- Device (/Server/SSH/Solaris)
- FileSystem (/Server/SSH/Solaris)
- OSProcess (/Server/SSH/Solaris)
- ethernetCsmacd (/Server/SSH/Solaris)
- ProcessorPool (in /Server)
- LDOM (in /Server)
- LDOMVcpu (in /Server)
- LDOMVds (in /Server)
Component Types
- ZoneContainer (on related device)
- ZoneFileSystem (on ZoneContainer)
- ZoneNetworkAdapter (on ZoneContainer)
- ZoneDedicatedCPU (on ZoneContainer)
- LDOM (on related device)
- LDOMVcpu (on LDOM)
- LDOMVds (on LDOM)
- ProcessorPool (on related device)
- ClusterIPMPGroup (on related device)
- ClusterNASDevice (on related device)
- ClusterDeviceGroup (on related device)
- ClusterTransportPath (on related device)
- ClusterSwitch (on related device)
- ClusterSwitchPort (on ClusterSwitch)
- ClusterNode (on related device)
- ClusterDID (on ClusterNode)
- ClusterResourceGroup (on ClusterNode)
- ClusterResource (on ClusterResourceGroup)
Required Daemons
In addition to the core platform daemons the following optional daemons are required for this ZenPack to fully function.
- zenperfsnmp
- zencommand
Changes
2.5.2
- Add ability to parse floats delimited by commas (ZPS-3157)
- Fix IndexError: list index out of range in zone filesystem parser (ZPS-4413)
- Fix handling prtconf errors in stderr (ZPS-4350)
- Fix error with parsing insufficient ps output (ZPS-4640)
- Add possibility to exclude certain Network Interfaces from monitoring using zInterfaceMapIgnoreNames and zInterfaceMapIgnoreTypes. Set zInterfaceMapIgnoreTypes to 'Local' by default to disable modelling and monitoring for loopback network inte
- Tested with Zenoss Cloud, Zenoss Resource Manager 6.2.1 and 5.3.3
2.5.1
- Fix error when modelling non-global Solaris zone (ZPS-1941)
- Fix disk utilization threshold on Filesystem components (ZPS-1981)
- Fix IndexError: list index out of range in iostat modeler (ZPS-1726)
- Tested with Zenoss Resource Manager 5.3.2 and Zenoss Resource Manager 4.2.5 RPS 743
2.5.0
- Fix performance issue with Zenoss Analytics (ZEN-24573)
2.4.2
- Fix process monitoring event class and threshold (ZEN-21999)
- Fix for handling of empty zone status output
- Add common datapoint aliases (ZEN-24619)
2.4.1
- Fix for systems without Zenoss Analytics
2.4.0
- Added support for updating zone status during monitoring (ZEN-17912)
2.3.1
- Fix reporting of Solaris System Serial Numbers
2.3.0
- Add support for Solaris Cluster.
2.2.0
- Add support for zones.
2.0.0
- Add support for LDOMs.