HTTP Monitor
ZenPacks.zenoss.HttpMonitor
The ZenPacks.zenoss.HttpMonitor ZenPack monitors the response times of HTTP server connection requests, and determines whether specific content exists on a Web page.
HttpMonitor features include:
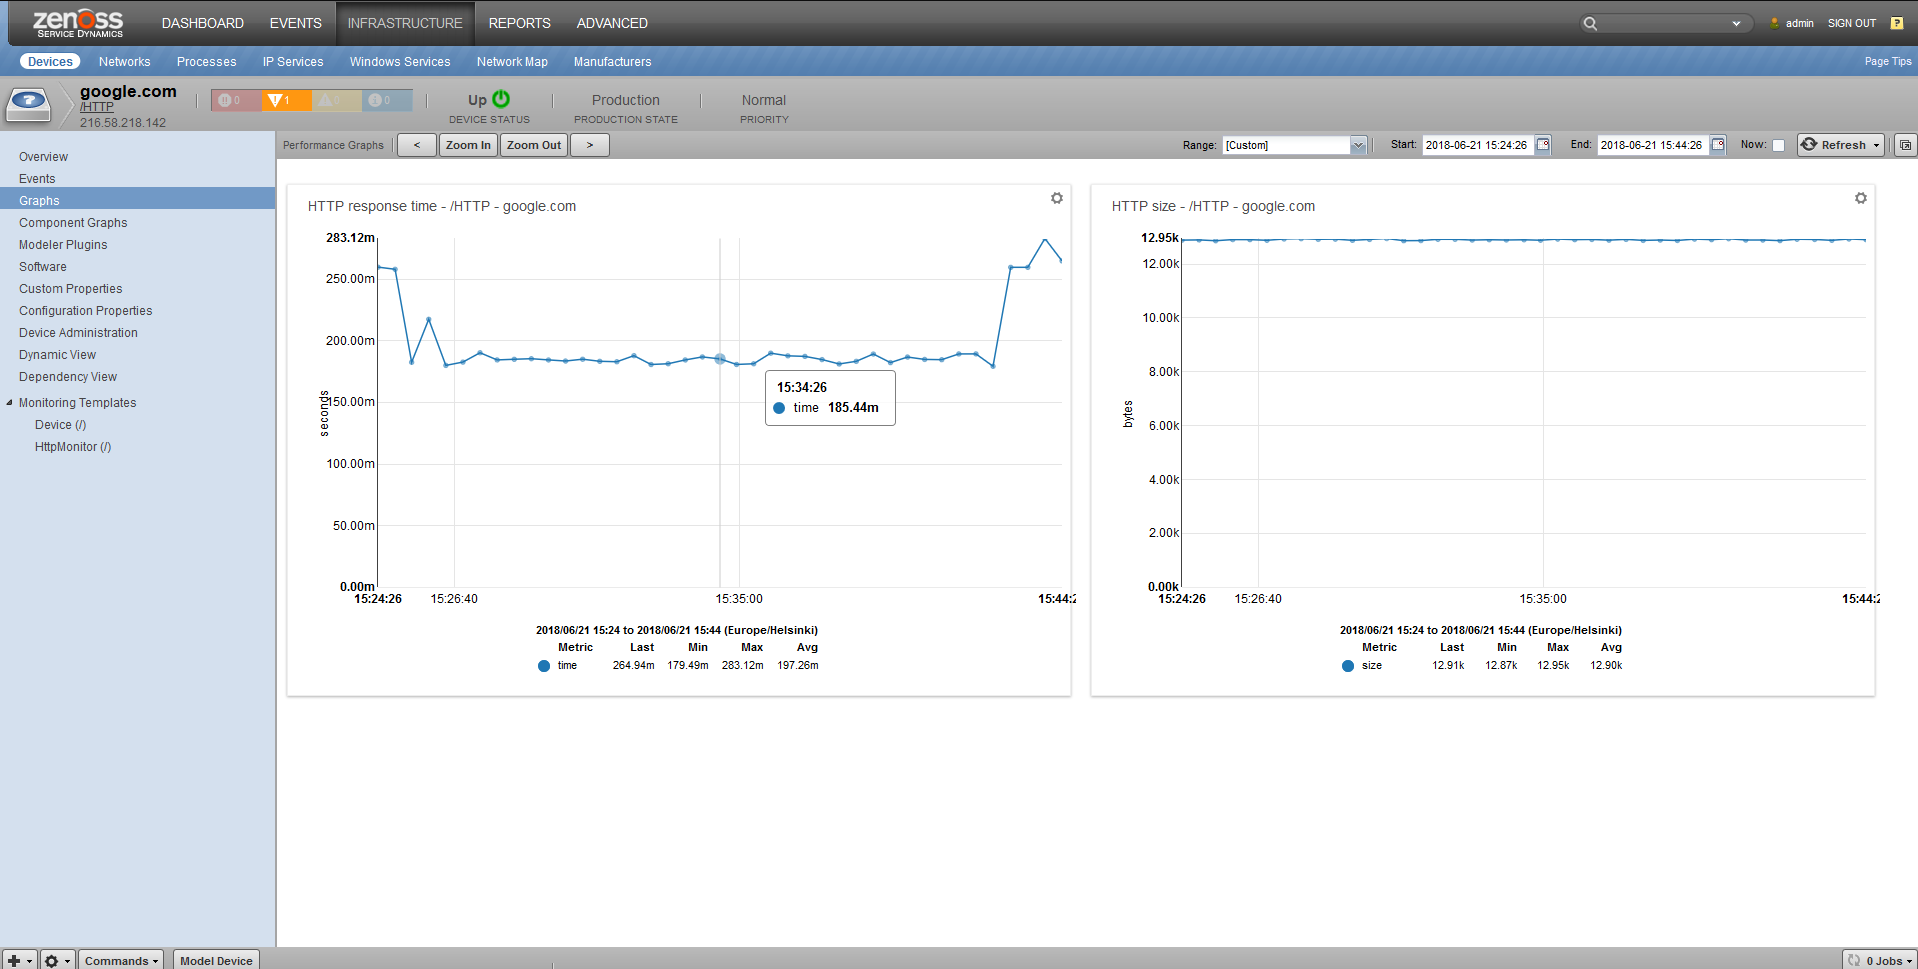
- Monitors HTTP response time
- Monitors HTTP page size
- Monitors HTTP response code
- Monitors HTTP through Proxy server
- Monitors HTTP with Basic access authentication
- Monitors HTTP specific content on the Web page
Open Source
This ZenPack is developed and supported by Zenoss Inc. Contact Zenoss to request more information regarding this or any other ZenPacks. Click here to view all available Zenoss Open Source ZenPacks.
Releases
Version 3.1.2-Download
- Released on 2022/06/20
- Requires PythonCollector ZenPack
- Compatible with Zenoss 6.x and Zenoss Cloud
Version 3.1.1-Download
- Released on 2022/05/05
- Requires PythonCollector ZenPack
- Compatible with Zenoss 6.x and Zenoss Cloud
Support
This ZenPack is part of Zenoss Core. Open Source users receive community support for this ZenPack via our online forums. Enterprise support for this ZenPack is provided to Zenoss customers with an active subscription.
Gallery
Enable Monitoring
Follow these steps to enable monitoring:
- Select Infrastructure from the navigation bar.
- Click the device name in the device list. The device overview page appears.
- Expand Monitoring Templates, and then select Device from the left panel.
- Select Bind Templates from the Action menu. The Bind Templates dialog appears.
- Add the HttpMonitor template to the list of selected templates, and then click Submit.
The HttpMonitor template is added to the list of monitoring templates. You can now begin collecting Web server metrics from the device.
Check for a Specific URL or Specify Security Settings
- Select Infrastructure from the navigation bar.
- Click the device name in the device list. The device overview page appears.
- Select the 'Gear' icon on the bottom panel and select the "Override Template Here" option.
- Choose "HttpMonitor (/)" template and select "Submit". This will create a local copy of the default HttpMonitor template for only this device.
- Select the newly created "HttpMonitor (Locally Defined)" template.
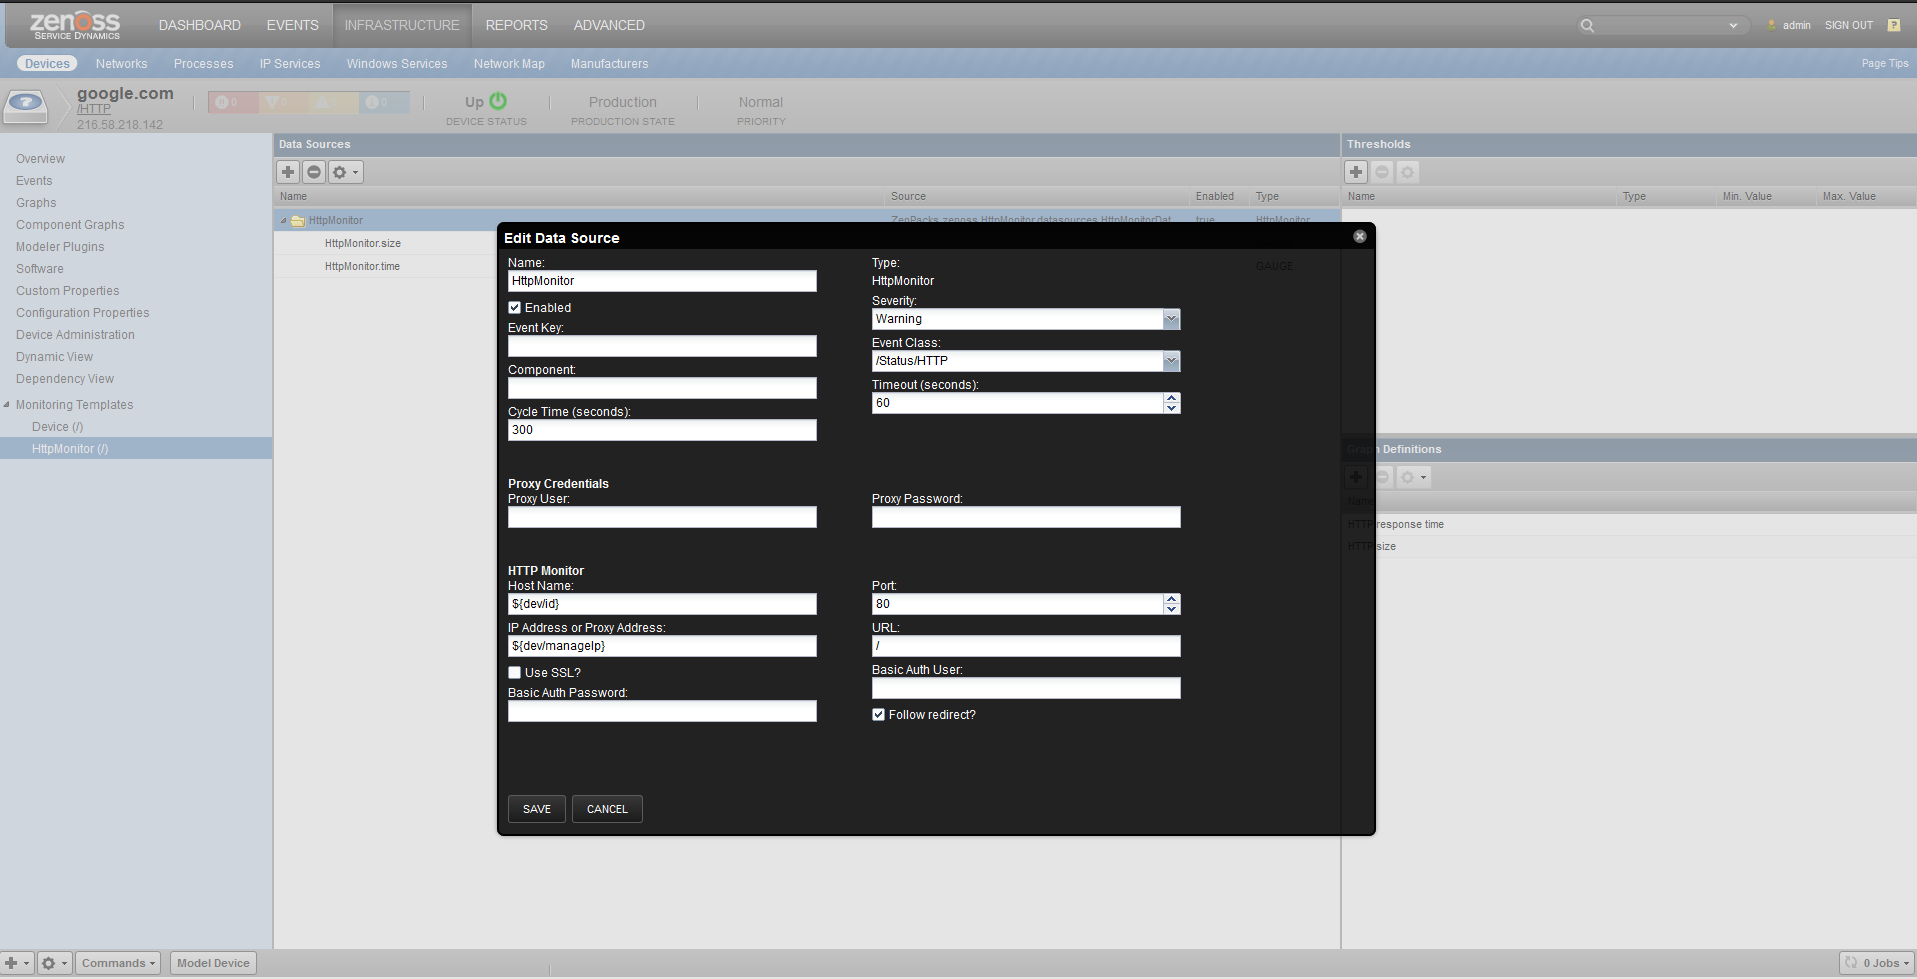
- Select the HttpMonitor data source, and then select View and Edit Details from the Action menu. The Edit Data Source dialog appears.
- Change data source options as needed, and then click Save.
HttpMonitor Content Checking Data Source Options
| Option | Description |
|---|---|
| Port | The port to connect to HTTP server (default 80). |
| Use SSL | Use SSL for the connection (default False). |
| URL | Address of the web page (default /). |
| Basic Auth User | If the website requires credentials, specify the username here (default None). |
| Basic Auth Password | Password for the user (default None). |
| Redirect Behavior | If the web site returns an HTTP redirect, should the probe follow the redirect or create an event? (default follow)ok - Do not follow the redirect and return a positive response fail - Do not follow the redirect and return a negative response follow - Follow redirection stickyhost - Use original hostname (or IP address) on redirect stickyhostport - Use original hostname and port on redirect |
| Event class | (default /Status/HTTP) |
Tuning for Site Responsiveness
- Select Infrastructure from the navigation bar.
- Click the device name in the device list. The device overview page appears.
- Select the 'Gear' icon on the bottom panel and select the "Override Template Here" option.
- Choose "HttpMonitor (/)" template and select "Submit". This will create a local copy of the default HttpMonitor template for only this device.
- Select the newly created "HttpMonitor (Locally Defined)" template.
- Select the HttpMonitor data source, and then select View and Edit Details from the Action menu. The Edit Data Source dialog appears.
- Change data source options as needed, and then click Save.
| Option | Description |
|---|---|
| Timeout (seconds) | Seconds before connection times out (default: 60) |
| Cycle Time (seconds) | Number of seconds between collection cycles (default: 300 or five minutes) |
Check for Specific Content on the Web Page
This procedure allows Zenoss platform to create an event if content at the web page does not match the expected output.
- Select Infrastructure from the navigation bar.
- Click the device name in the device list. The device overview page appears.
- Select the 'Gear' icon on the bottom panel and select the "Override Template Here" option.
- Choose "HttpMonitor (/)" template and select "Submit". This will create a local copy of the default HttpMonitor template for only this device.
- Select the newly created "HttpMonitor (Locally Defined)" template.
- Select the HttpMonitor data source, and then select View and Edit Details from the Action menu. The Edit Data Source dialog appears.
- Change data source options as needed, and then click Save.
HttpMonitor Content Checking Data Source Options
| Option | Description |
|---|---|
| Regular Expression | A Python regular expression to match text in the web page. |
| Case Sensitive | Is the regular expression case-sensitive or not? |
| Invert Expression | If you would like to test to see if the web page does not contain content matched by a regular expression, check this box. |
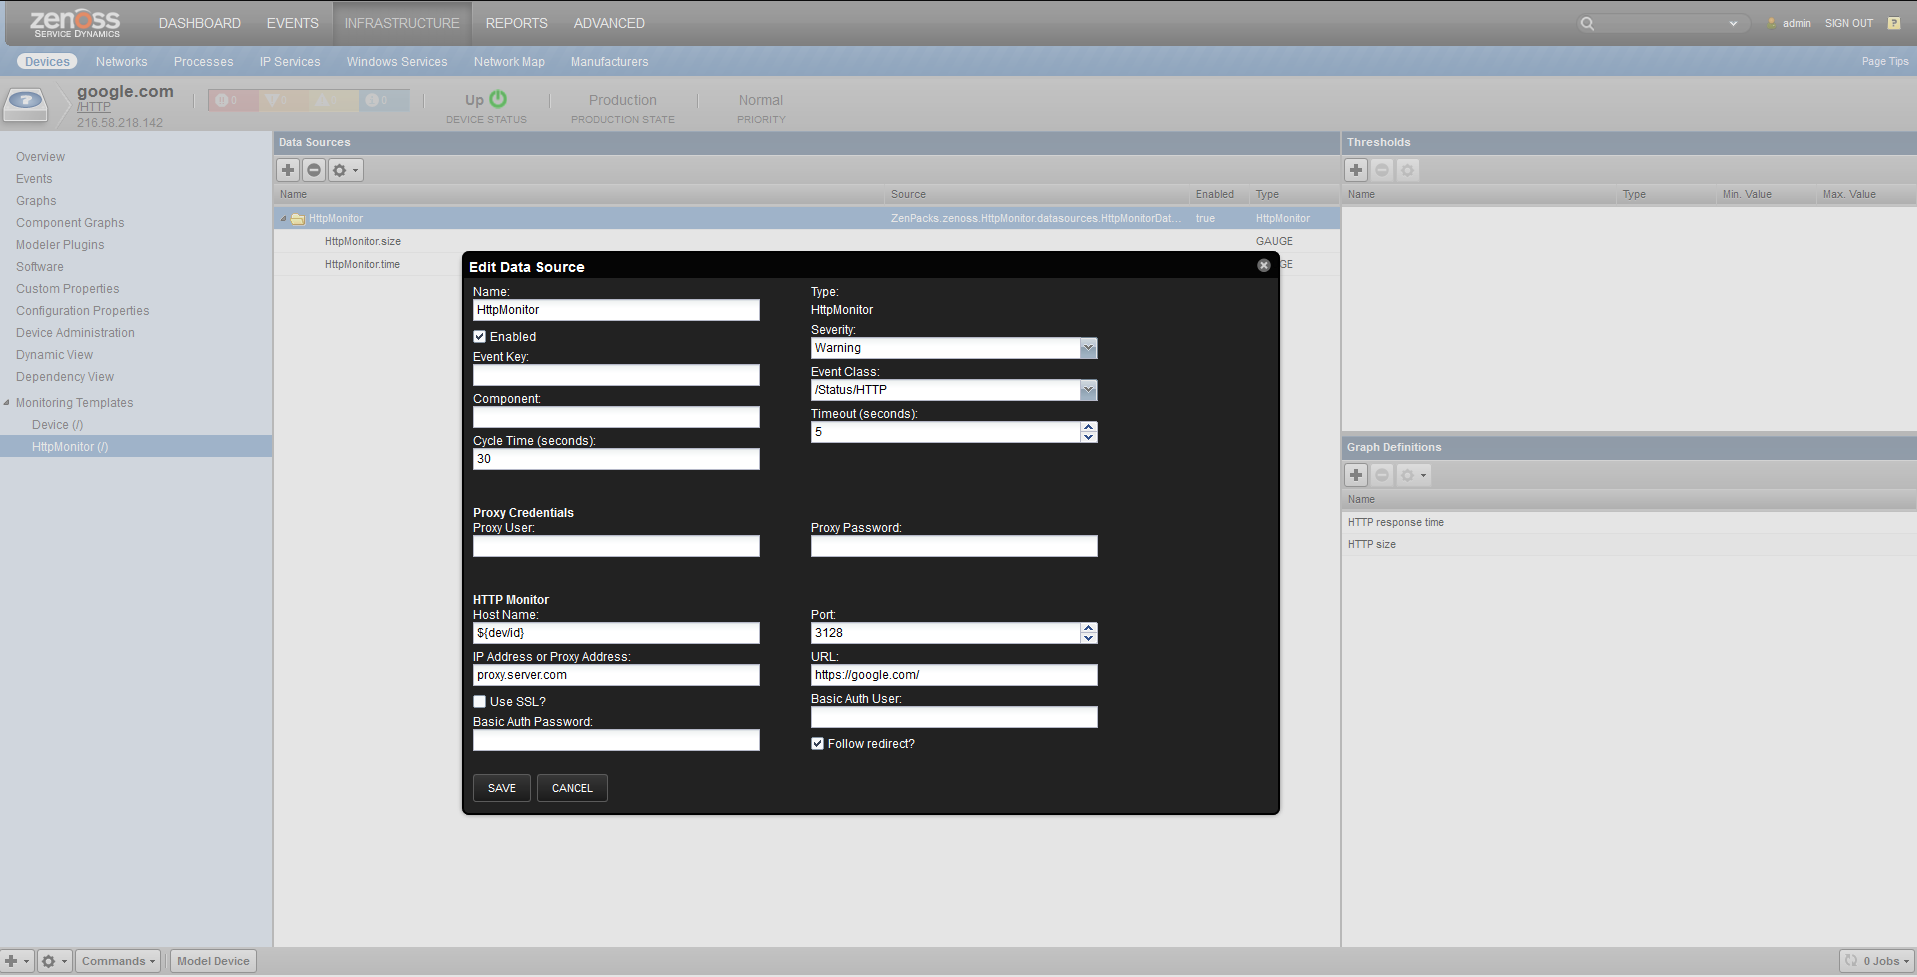
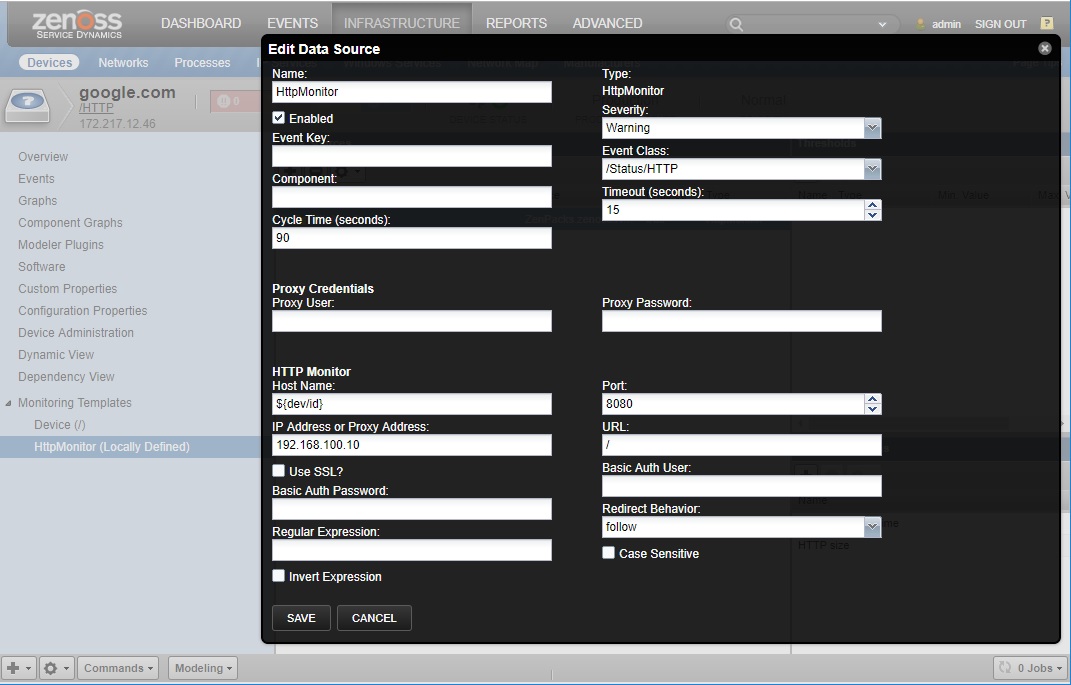
Configuration to Monitor HTTP Through a Proxy Server
Example configuration of HttpMonitor to check a website through a Proxy Server when you have a proxy server with an IP address: 192.168.100.10 on port: 8080 and you have a device on /Devices/HTTP with a name google.com
| Option | Example value |
|---|---|
| HostName | ${dev/id} |
| IP Address or Proxy Address | 192.168.100.10 |
| Port | 8080 |
| URL | / |
| Proxy User | (empty for if proxy anonymous) |
| Proxy Password | (empty for if proxy anonymous) |
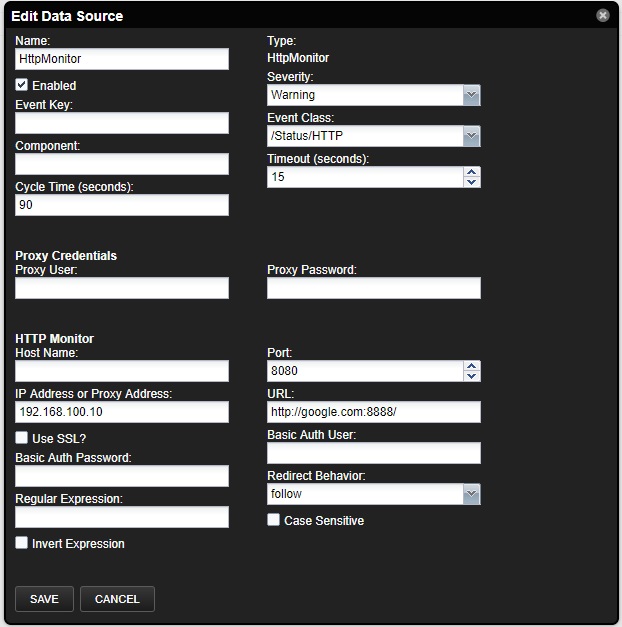
Example configuration of HttpMonitor to check a website through a Proxy Server when you have a proxy server with an IP address: 192.168.100.10 on port: 8080 and you have a device on /Devices/HTTP with a name google.com and HTTP port 8888
| Option | Example value |
|---|---|
| HostName | (empty) |
| IP Address or Proxy Address | 192.168.100.10 |
| Port | 8080 |
| URL | http://google.com:8888/ |
| Proxy User | (empty if proxy anonymous) |
| Proxy Password | (empty if proxy anonymous) |
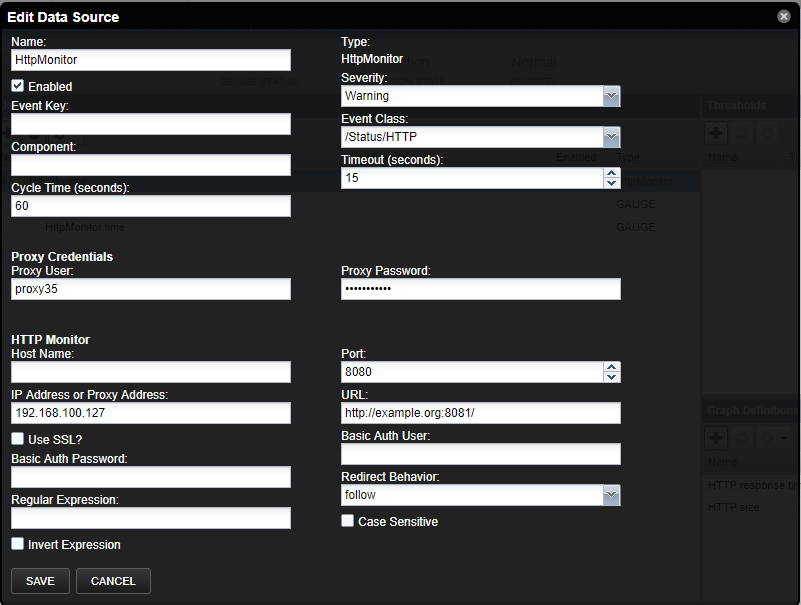
Example configuration of HttpMonitor to check a website through a Proxy Server when you have a proxy server with an IP address: 192.168.100.127 on port: 8080 and Username: proxy, Password: myproxypassword, and you have a device on /Devices/HTTP with a name example.org and HTTP port 8888
| Option | Example value |
|---|---|
| HostName | (empty) |
| IP Address or Proxy Address | 192.168.100.127 |
| Port | 8080 |
| URL | http://example.org:8081/ |
| Proxy User | proxy35 |
| Proxy Password | mypproxpassword |
Proxy usage logic
HttpMonitor uses the address in the IP Address or Proxy Address field
as a proxy server if the IP address for resolve in the field URL and
Host Name and IP Address or Proxy Address do not match
Daemons
| Type | Name |
|---|---|
| Performance Collector | zenpython |
Changes
3.1.2
- Improve compatibility with new Python libraries
- Tested with Zenoss Cloud, Zenoss 6.6.0, Zenoss 6.7.0
3.1.1
- Make use of value configured in Datasource "Component" field (ZPS-6133)
- Tested with Zenoss Cloud, Zenoss 6.6.0, Zenoss 6.7.0
3.1.0
- Fix infinity redirection in the case with not full URI path in header Location (ZPS-4904)
- Fix issue when HttpMonitor doesn't check response and doesn't handle either (ZPS-4998)
- Fix crashes of PythonCollector in the case with blank IP Address or Proxy Address fields (ZPS-4986)
- Fix collection of datapoints for component-level datasources (ZPS-5550)
- Provides details on Proxy usage with examples (ZPS-4912)
- Tested with 6.3.2 and Zenoss Cloud
3.0.4
- Fix issue with locally defined monitoring templates after upgrade (ZPS-3817)
- Fix handles bad proxy hostnames (ZPS-3819)
- Adds unittests for regular expression and redirect behavior
- Adds
Case sensitive/Invert Expression/Regular Expressionproperties into DataSource configuration (ZPS-3867) - Adds
Redirect Behavioroptionsok/fail/follow/sticky/stickyport(ZPS-3867) - Tested with Zenoss Resource Manager 6.2.0, Zenoss Resource Manager 5.3.3
3.0.0
- Removes
Case sensitive/Invert Expression/Regular ExpressionszProperties from DataSource configuration - Changes
Redirect Behaviorlist to checkbox - Removes dependency library
check_httpfrom Nagios Plugins - Adds unittests