Microsoft Azure
ZenPacks.zenoss.Microsoft.Azure
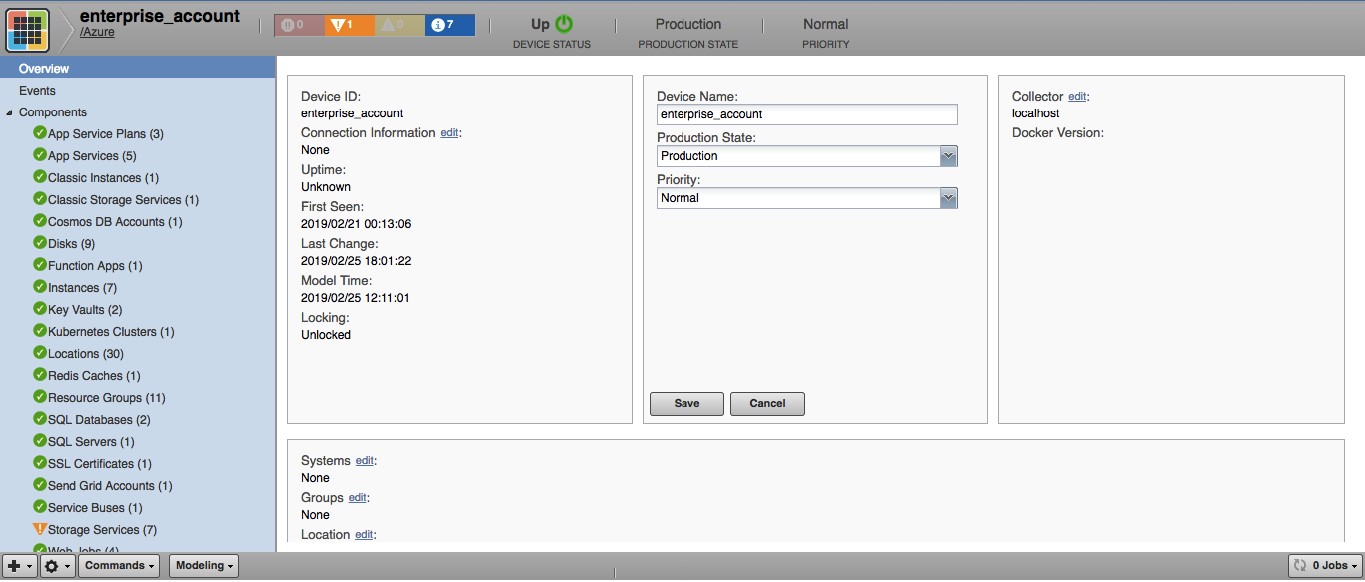
This ZenPack provides support for monitoring the Microsoft Azure Service. Monitoring for the Azure Subscription and entities is provided using the Microsoft Azure REST API.
This ZenPack is included with commercial versions of Zenoss and enterprise support for this ZenPack is provided to Zenoss customers with an active subscription.
Commercial
This ZenPack is developed and supported by Zenoss Inc. Commercial ZenPacks are available to Zenoss commercial customers only. Contact Zenoss to request more information regarding this or any other ZenPacks. Click here to view all available Zenoss Commercial ZenPacks.
Releases
Version 3.0.1 - Download
- Released on 2023/12/11
- Requires PythonCollector ZenPack (>=1.2), ZenPackLib ZenPack (>=2.1.1)
- Compatible with Zenoss Resource Manager 6.x and Zenoss Cloud
Version 3.0.0 - Download
- Released on 2022/12/23
- Requires PythonCollector ZenPack (>=1.2), ZenPackLib ZenPack (>=2.1.1)
- Compatible with Zenoss Resource Manager 6.x and Zenoss Cloud
Features
The features added by this ZenPack can be summarized as follows. They are each detailed further below.
- Discovery of Azure Subscription entities.
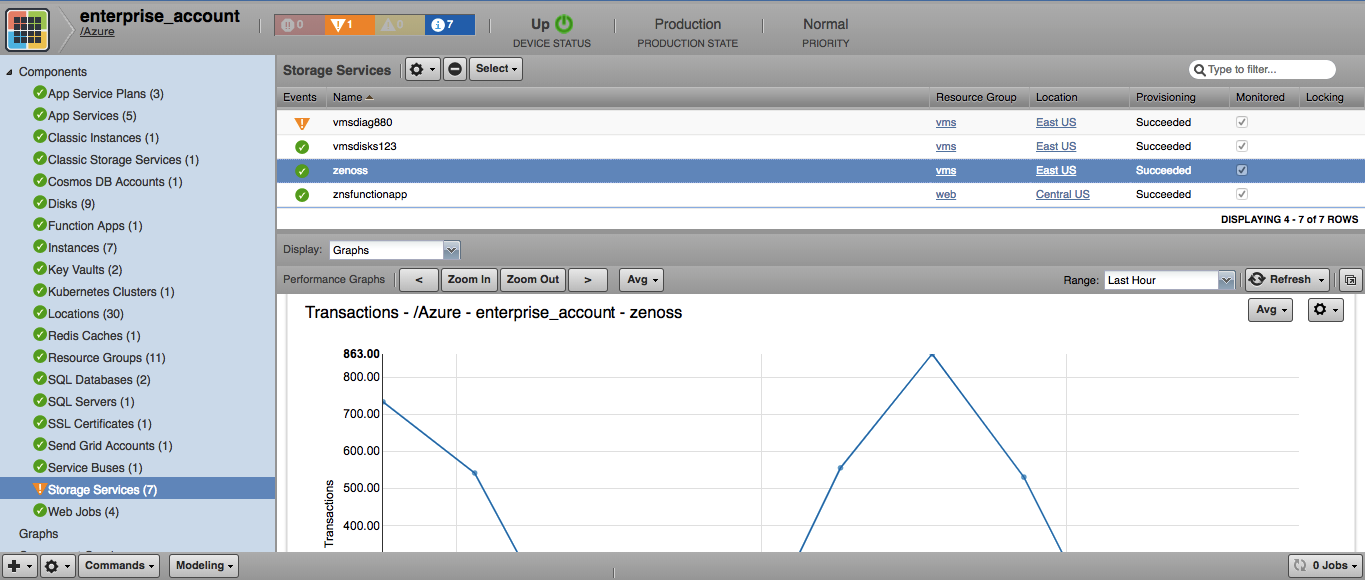
- Monitoring of Storage Service and App Service components.
- Event management and monitoring for certain Azure states.
- Optional service impact with the addition of Zenoss Service Dynamics product.
- Report displaying unattached VHDs
Discovery
The following entities will be automatically discovered through an account name, subscription ID, application ID, secret key, and tenant ID you provide. The attributes, tags, and collections will be updated on Zenoss' regular remodeling interval which defaults to every 12 hours.
Resource Groups
- Attributes: Location, Subscription, Provisioning State
Classic Instances (Classic Virtual Machines in Azure Management Portal)
- Attributes: Instance Status, Instance Size, IP Address, Power State, Instance Error Code, FQDN, Guest Device
Instances (Virtual Machines in Azure Management Portal)
- Attributes: Instance Size, IP Address, FQDN, Power state, Provisioning State, OS, Instance Error Code, Instance Status, Location, Mac Address, Guest Device, Kubernetes Node
Disks
- Attributes: Caching, Media Link, Size, Source Image Name
Note
Unattached disks will not be modeled.
Storage Services (Storage accounts in Azure Management Portal)
- Attributes: Service Status, Location, URL, Provisioning
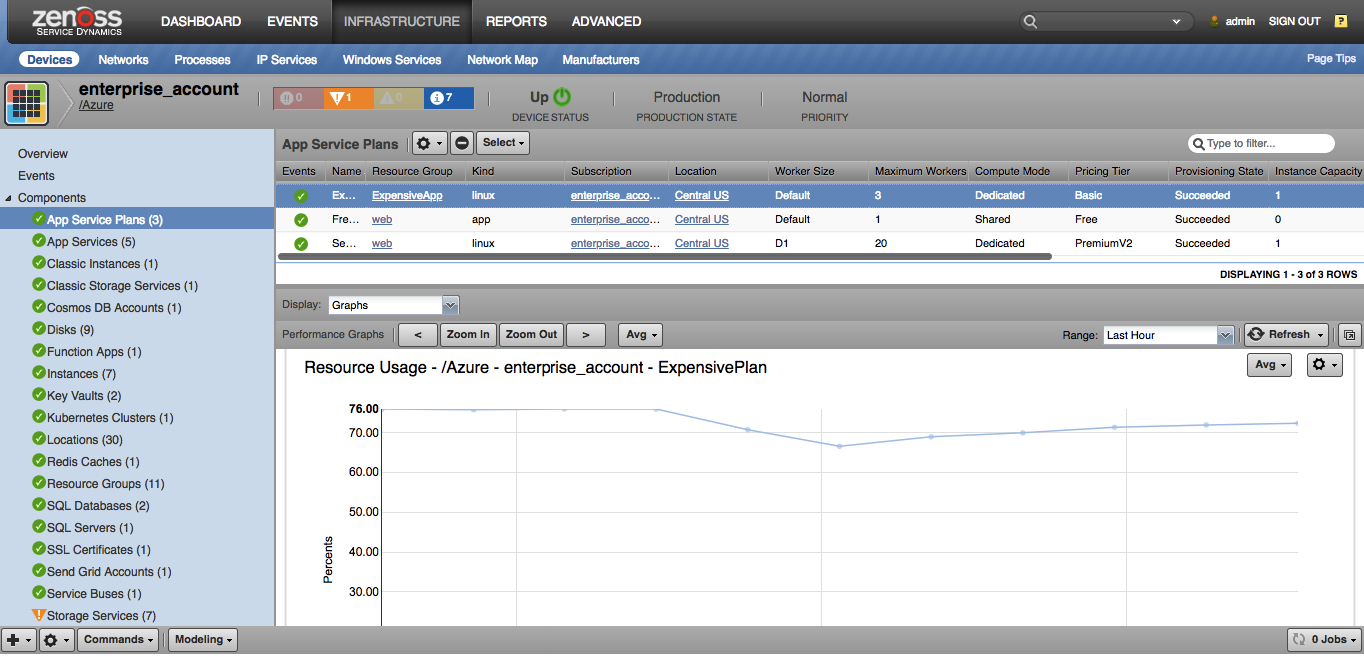
App Service Plans
- Attributes: Kind, Location, Worker Size, Maximum Workers, Compute Mode, Pricing Tier, Provisioning State, Instance Capacity
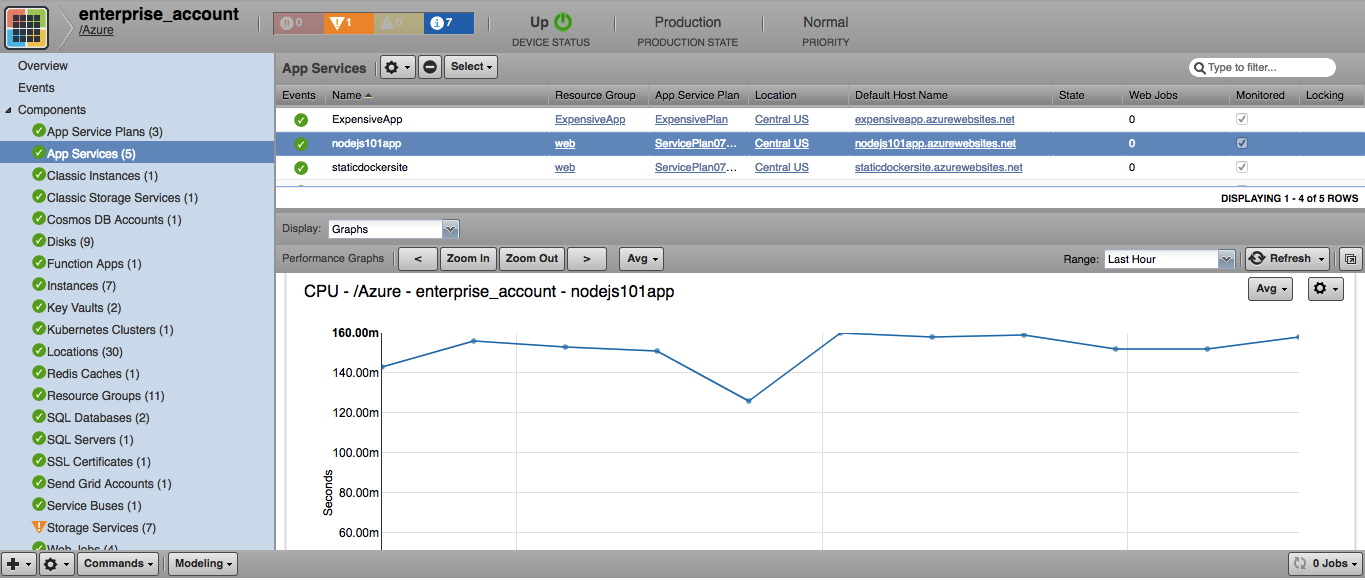
App Services
- Attributes: Name, State, Availability state, Default Host Name, Hostnames, Enabled Host Names, Locations
Cosmos DB Account
- Attributes: Location, Provisioning State, Kind, Database Account Offer Type, Write Locations, Read Locations
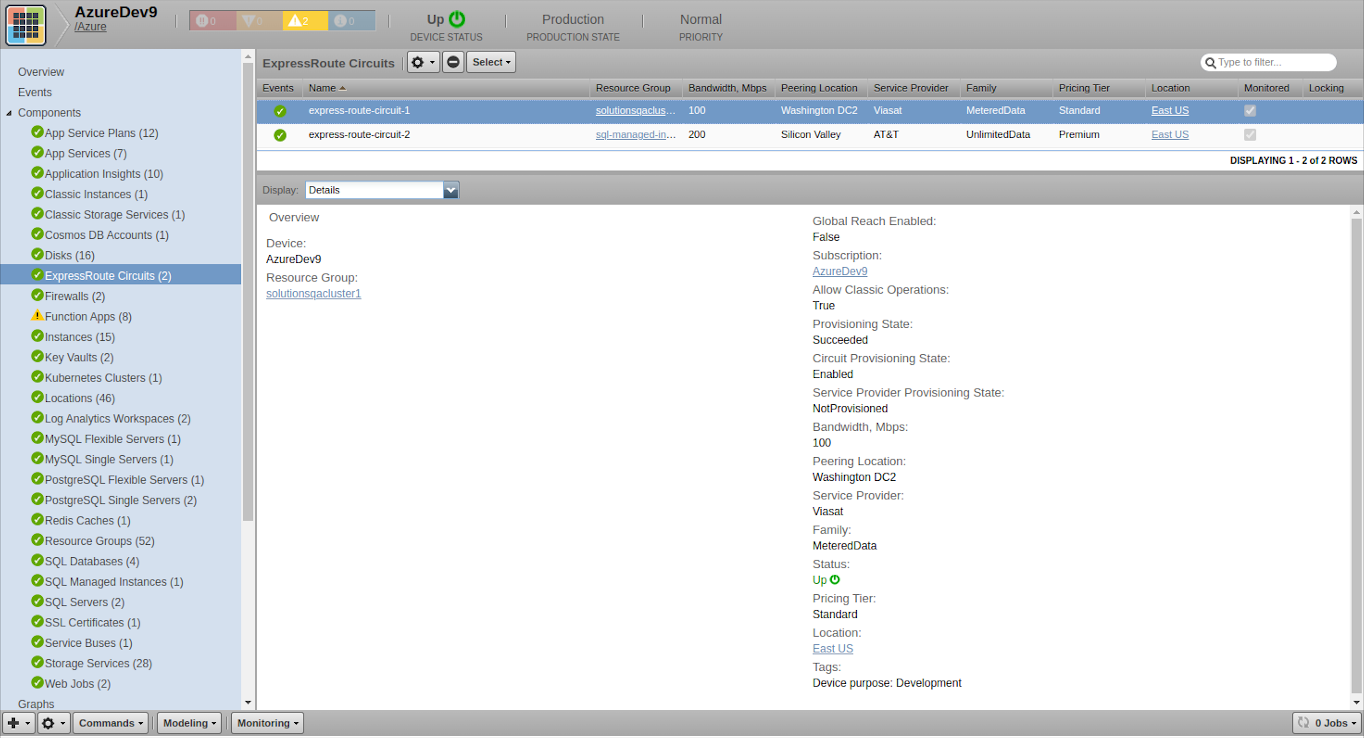
ExpressRoute Circuits
- Attributes: Name, Resource Group, Bandwidth (Mbps), Peering Location, Service Provider, Family, Pricing Tier, Location
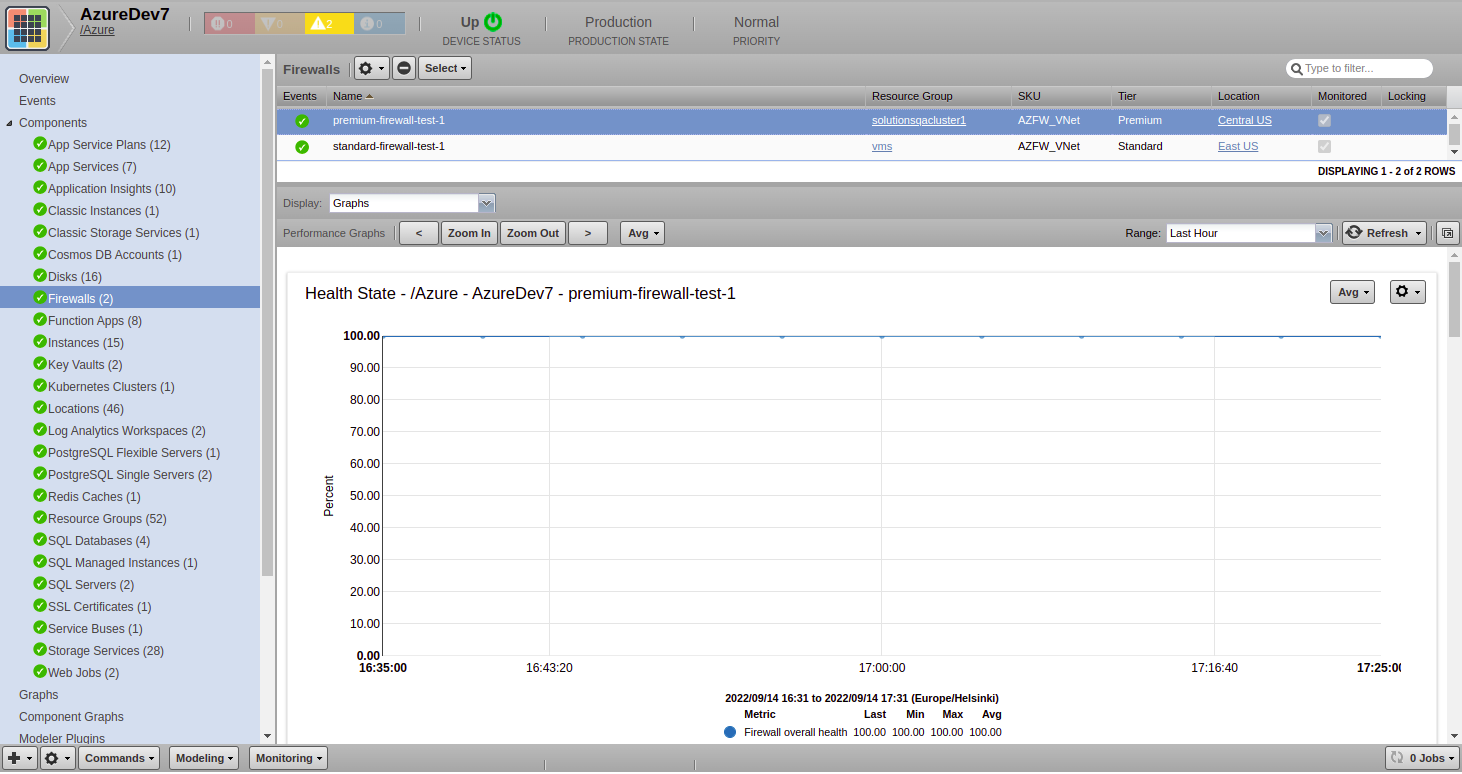
Firewalls
- Attributes: Name, Resource Group, SKU, Tier, Location
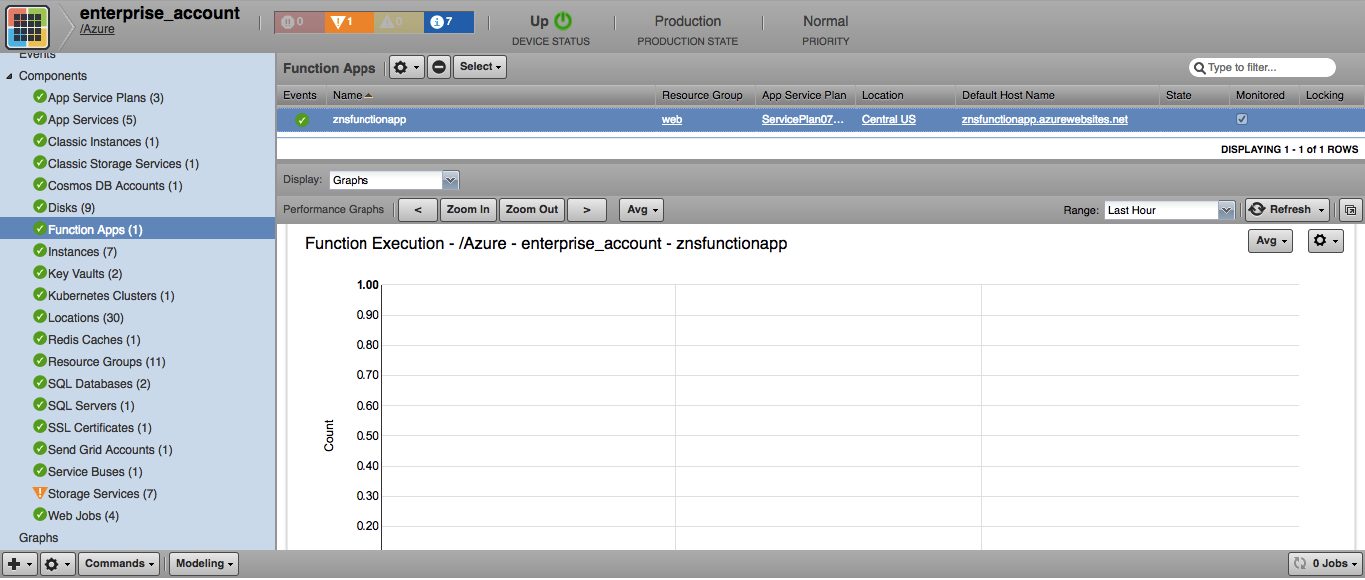
Function Apps
- Attributes: State, Availability State, Default Host Name, Host Names, Enabled Host Names, Location
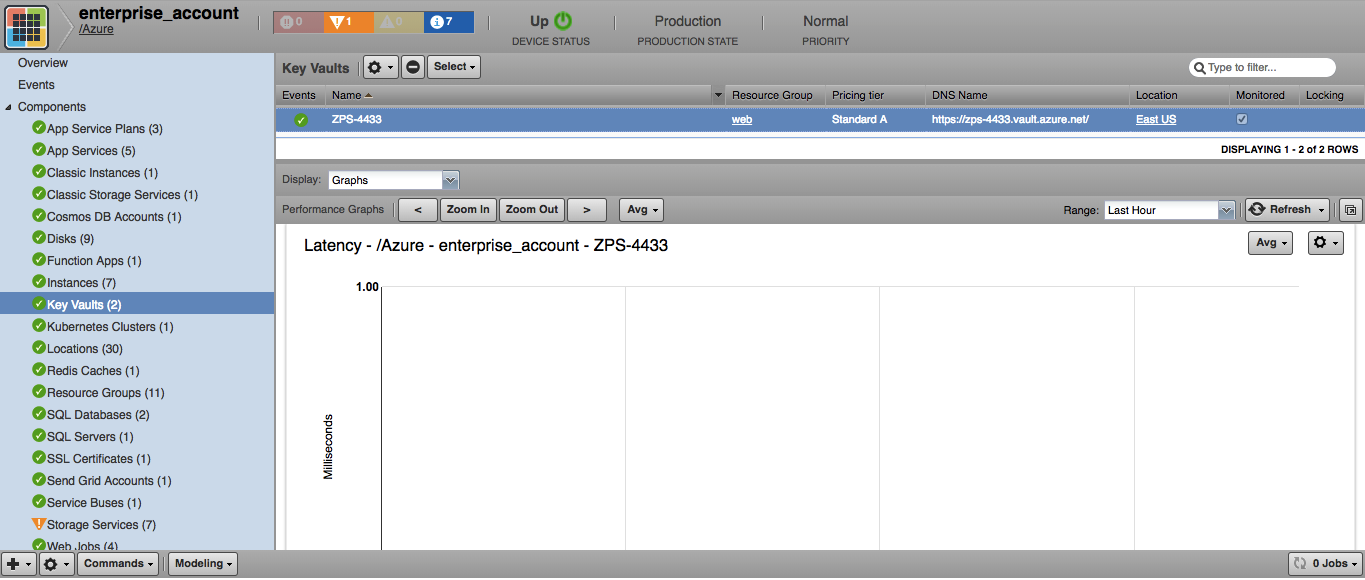
Key Vaults
- Attributes: Pricing tier, DNS Name, Location
Kubernetes
- Attributes: Version, Location, Provisioning State, Endpoint
Log Analytics Workspaces
- Attributes: Tier, Retention, Created Date, Modified Date, Location
MySQL Flexible Servers
- Attributes: FQDN, Storage Size (GB), Storage Type, Version, Availability Zone, Family, Pricing Tier, Location
MySQL Single Servers
- Attributes: FQDN, Storage Size (MB), Replica Capacity, Version, Family, Pricing Tier, Location
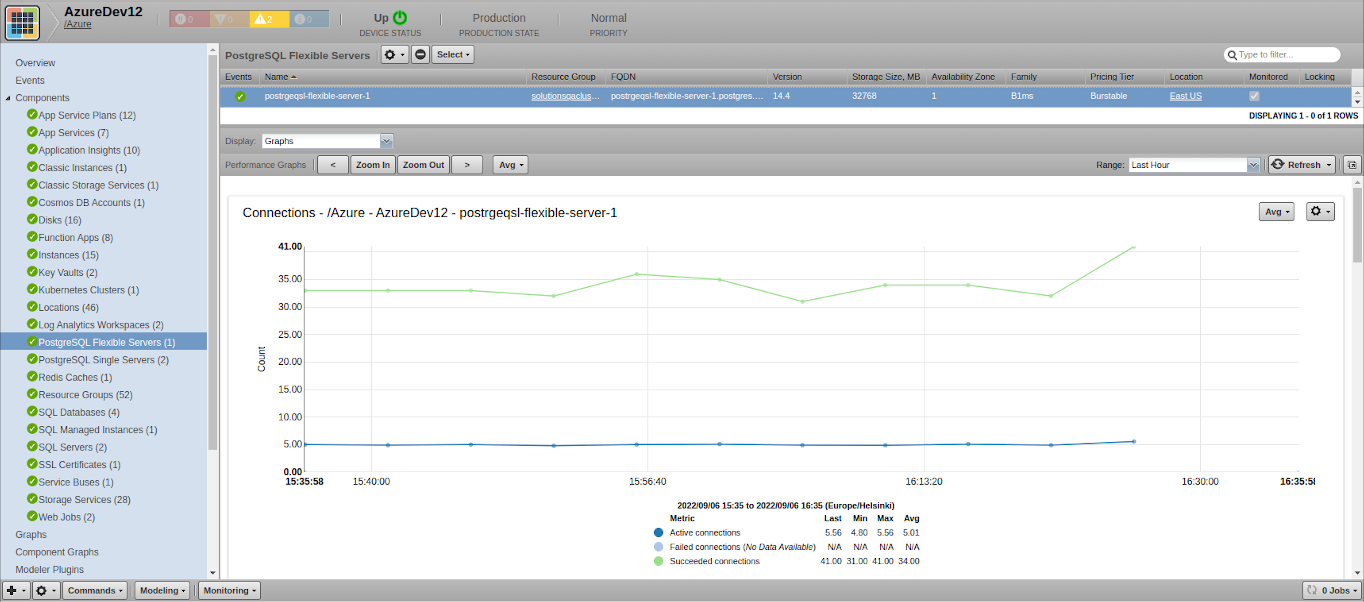
PostgreSQL Flexible Servers
- Attributes: FQDN, Storage Size (MB), Version, Availability Zone, Family, Pricing Tier, Location
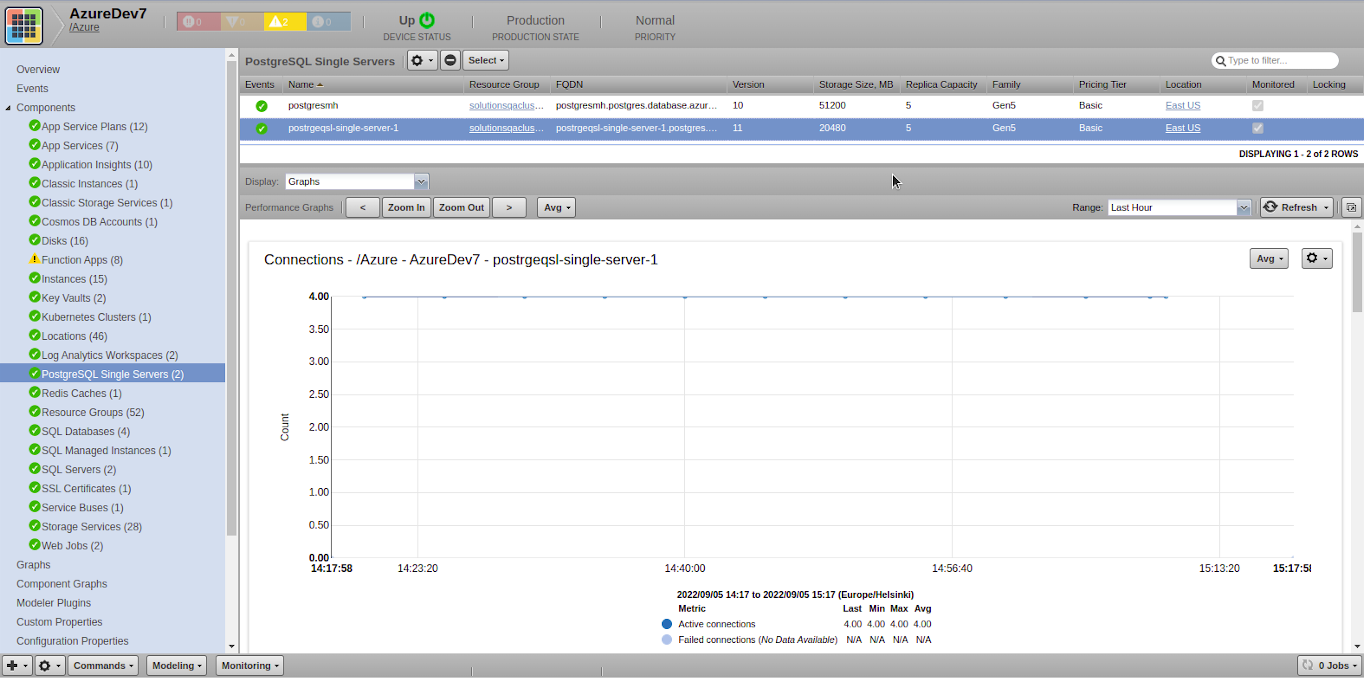
PostgreSQL Single Servers
- Attributes: Attributes: FQDN, Storage Size (MB), Replica Capacity, Version, Family, Pricing Tier, Location
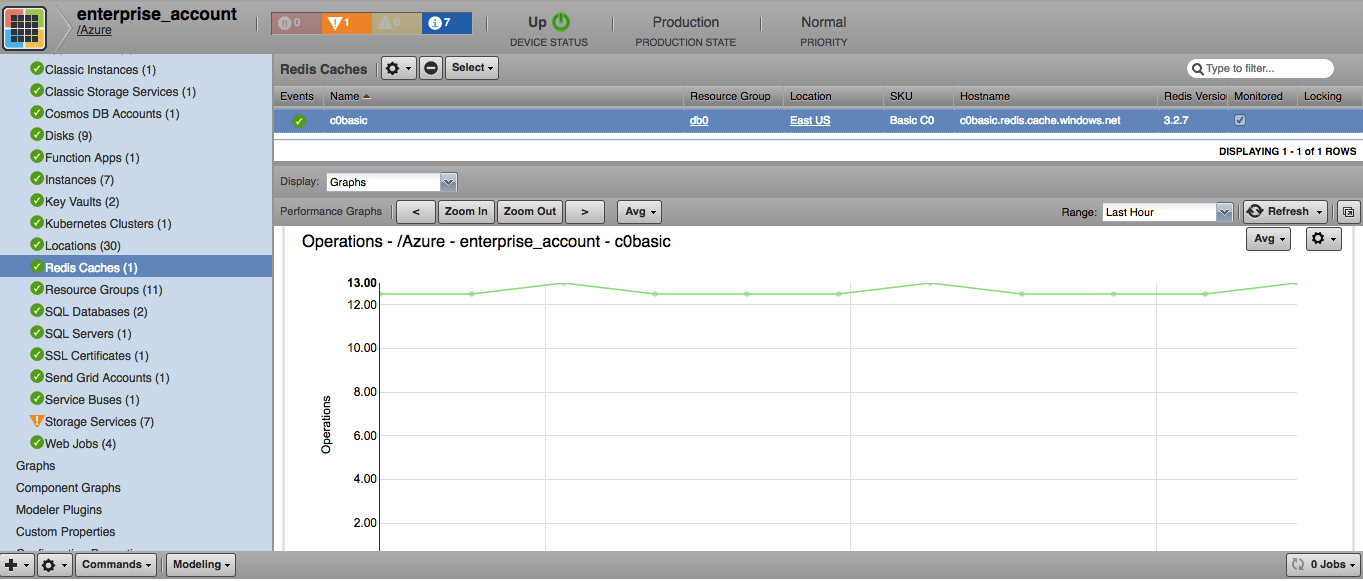
Redis Caches
- Attributes: Hostname, Redis Version, SKU, Port, SSL Port, Location
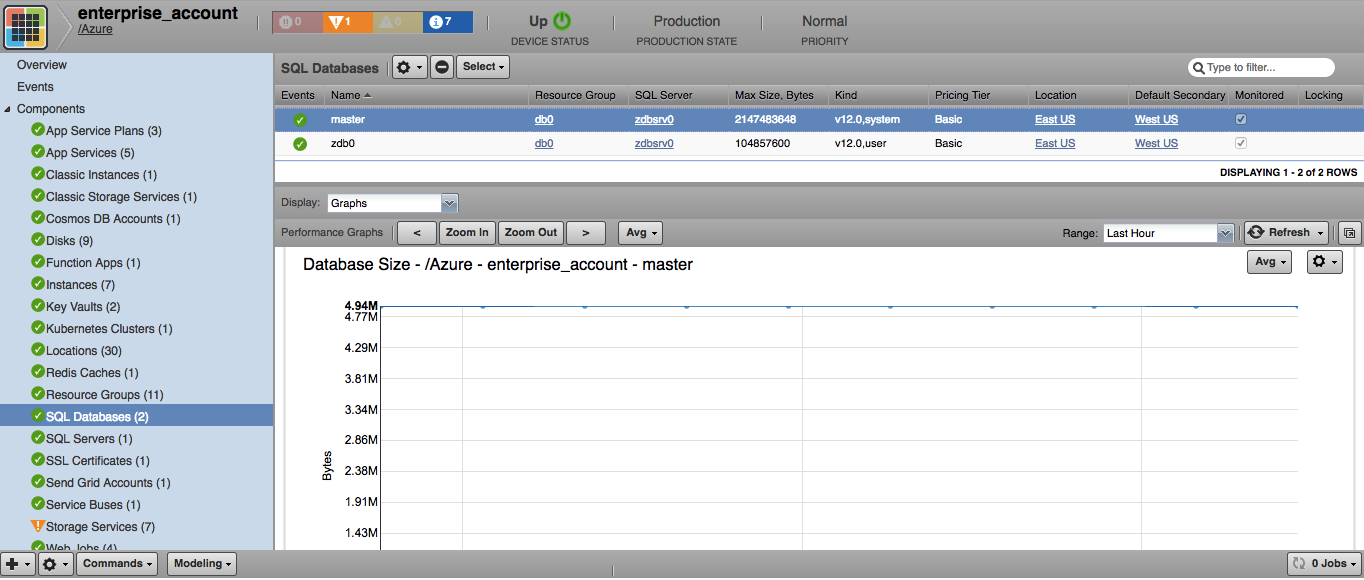
SQL Databases
- Attributes: Max Size, Bytes, Pricing Tier, Location, Default Secondary Location, Kind
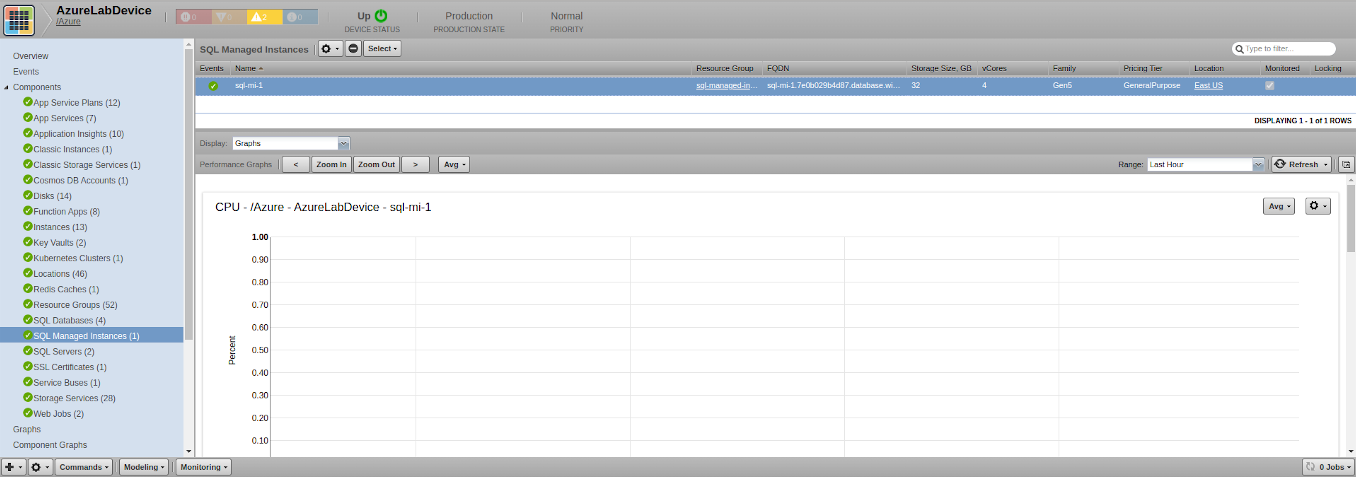
SQL Managed Instances
- Attributes: FQDN, Storage Size (GB), vCores, Family, Pricing Tier, Provisioning State, State, Timezone, Location
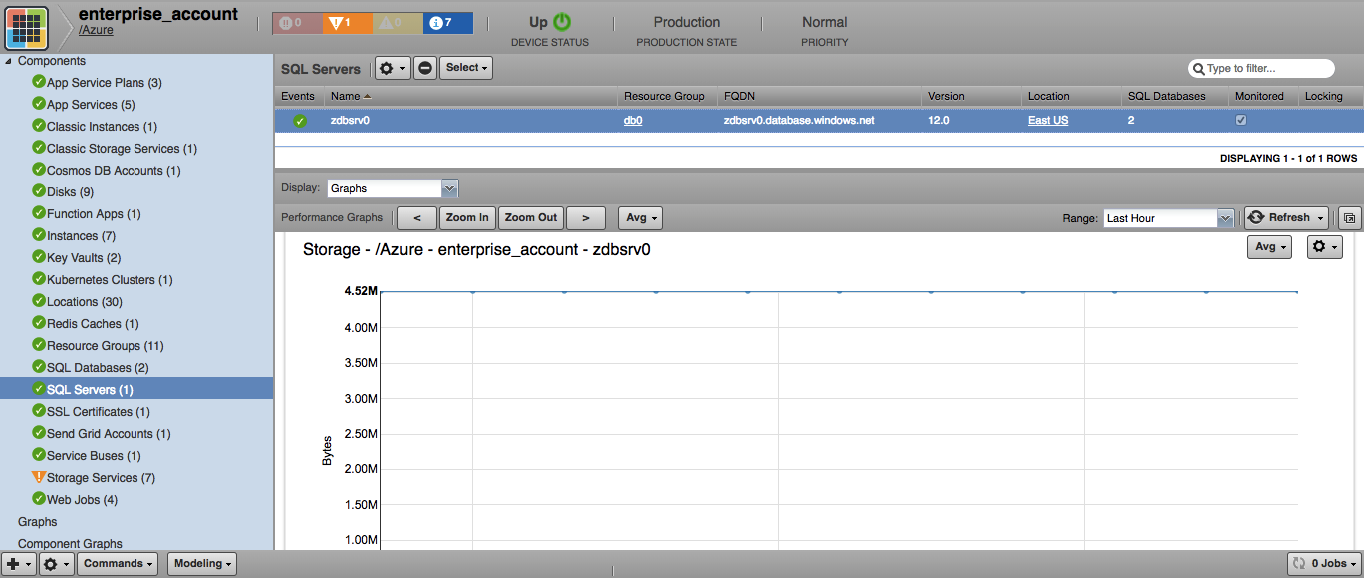
SQL Servers
- Attributes: FQDN, Version, Administrator Login, Location
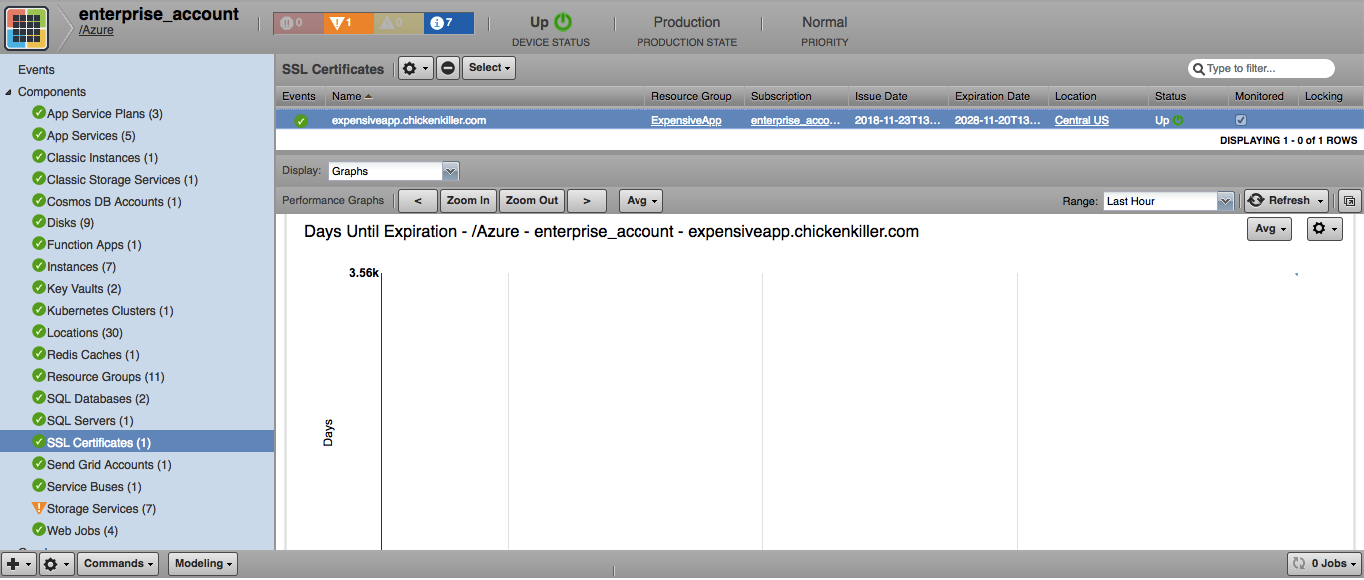
SSL Certificates
- Attributes: Hostnames, Issue Date, Expiration Date, Location
Send Grid Accounts
- Attributes: Email, SMTP Server, First Name, Last Name, Company, Website, Plan, Location
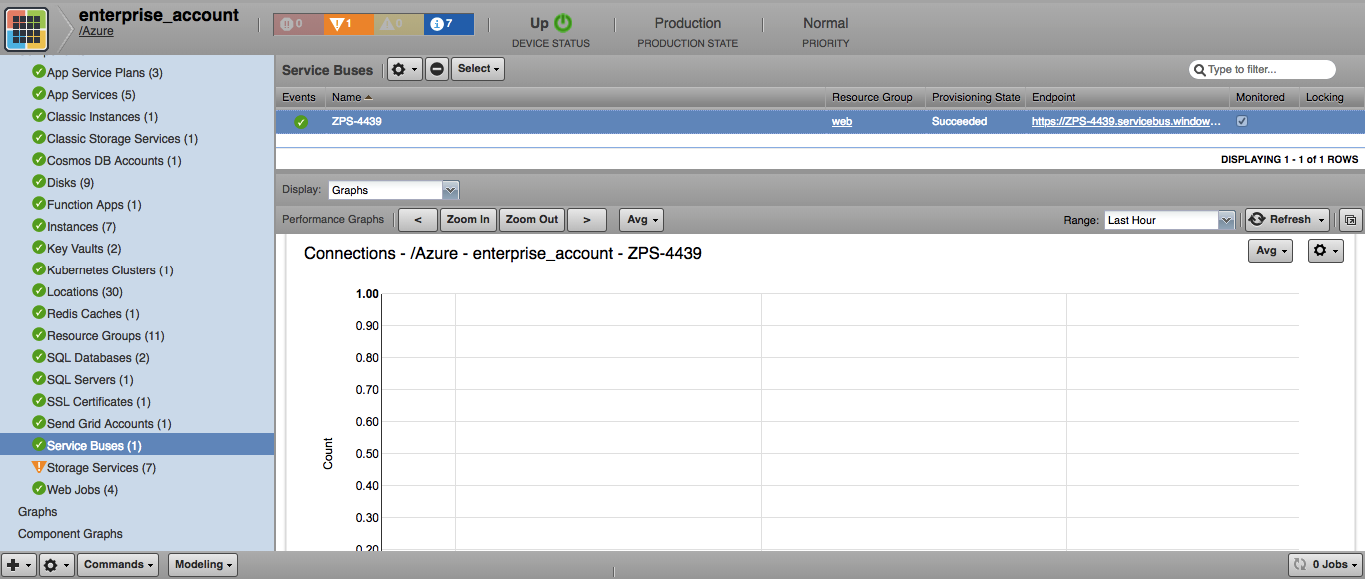
Service Buses
- Attributes: Metric ID, Provisioning State, Endpoint
Web Jobs
- Attributes: History URL, Logs URL, Extra Info URL, Command
Locations
- Attributes: Name
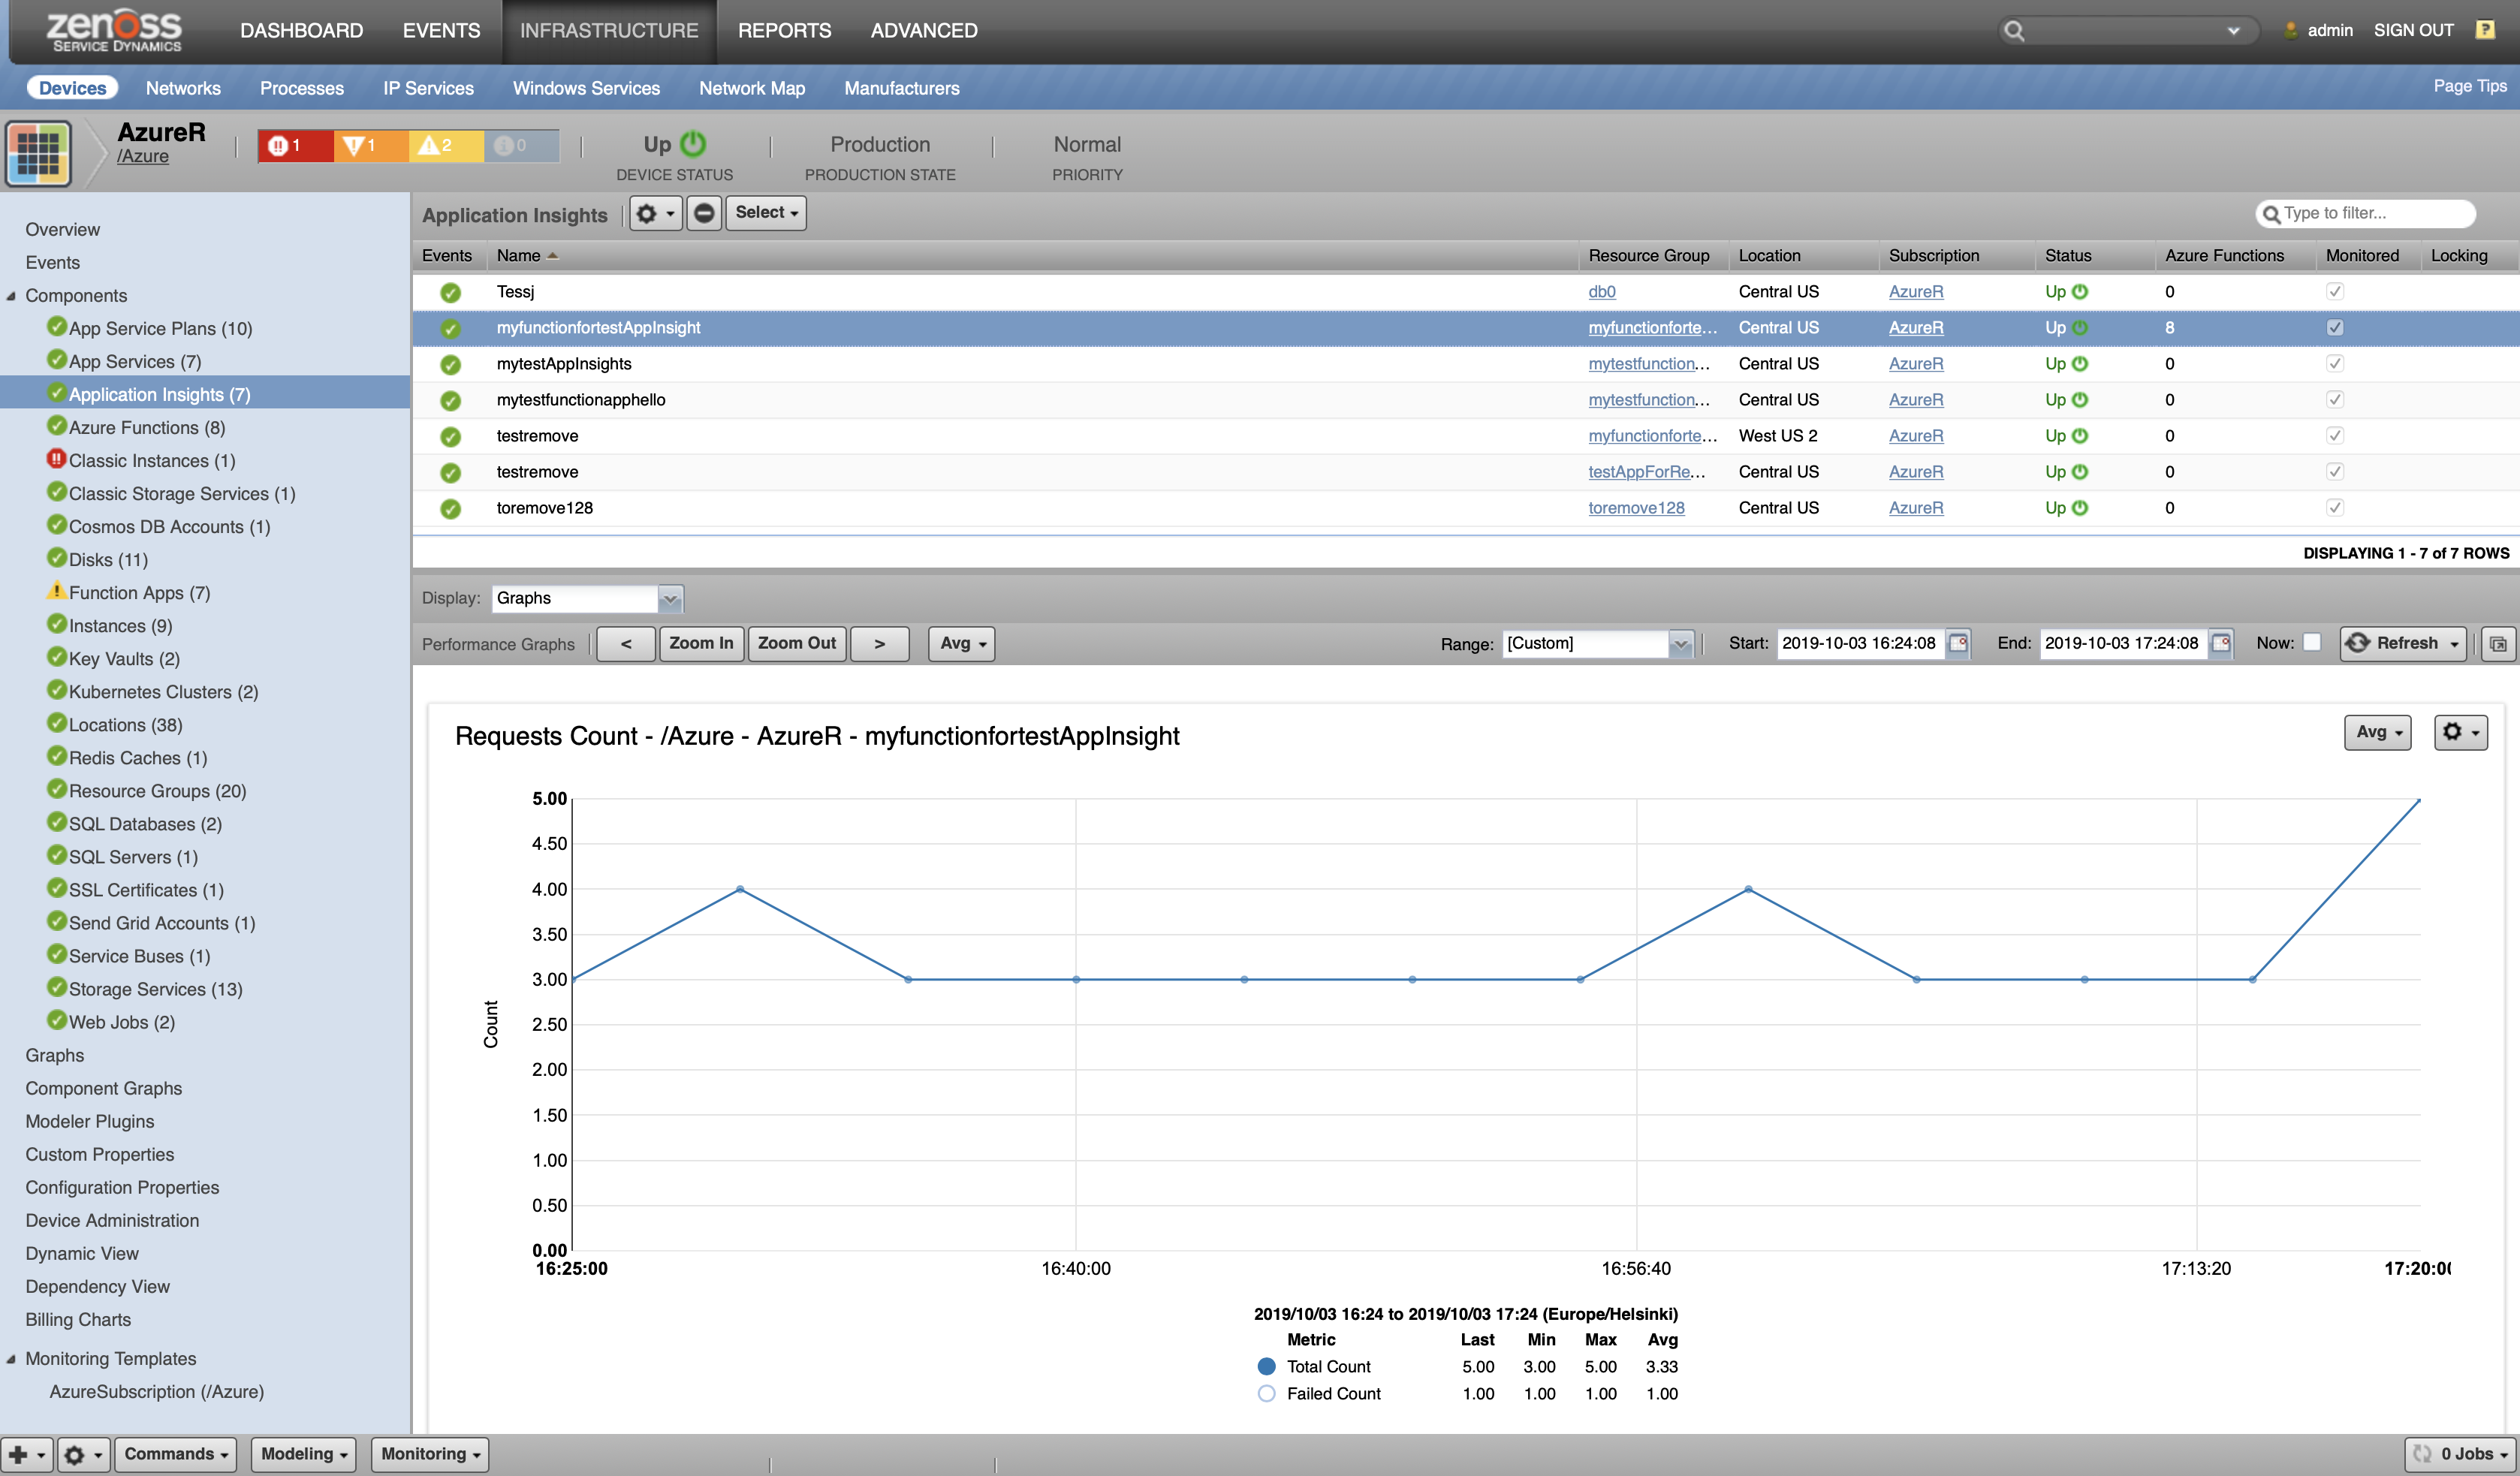
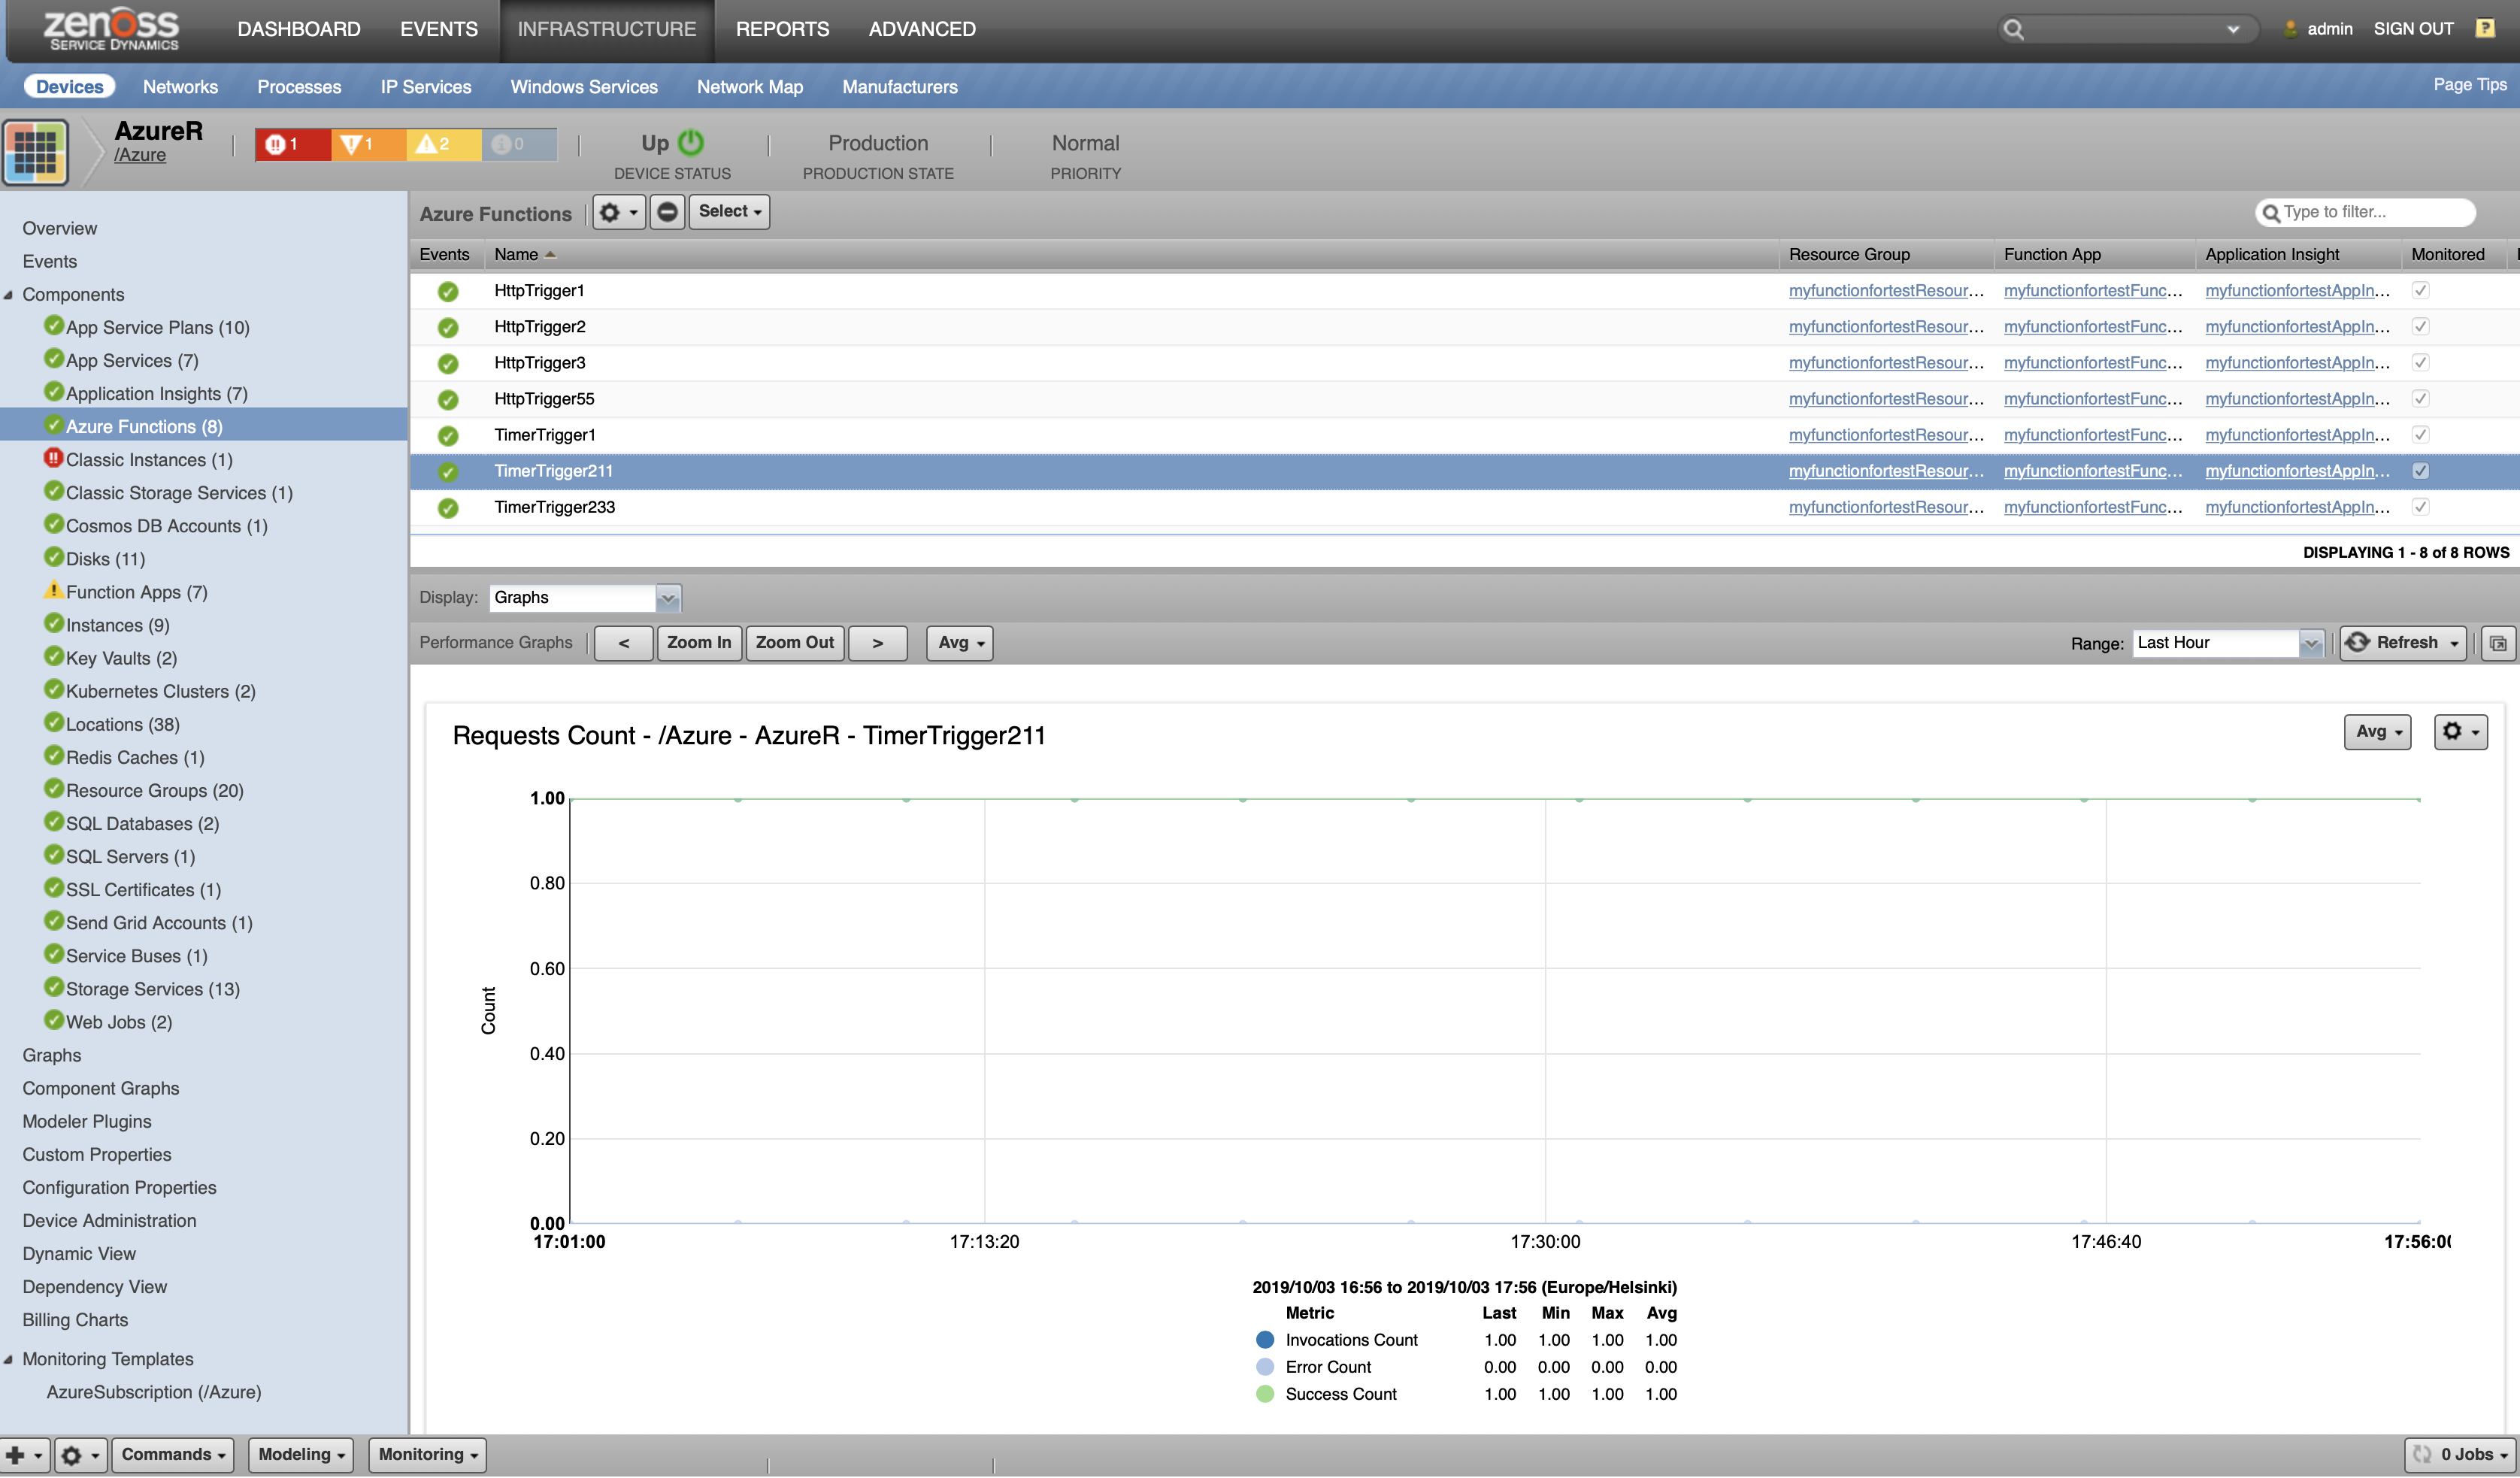
Azure Functions
- Attributes: Instrumentation Key, URL, SDK Version
Application Insights
- Attributes: Application Id, Application Insights API Key, Location
Note
Azure Function components will not be discovered automatically because the "Application Insights Secret Key" is required to be configured on application insights. The needed steps are described in the "Configuring Application Insights Components" section. Information about Azure Function components will be available after the next modeling, in case the "Application Insights Secret Key" is correctly configured. Modeling functions components occurs based on logs data from the Azure system for the last 5 days.
Monitoring
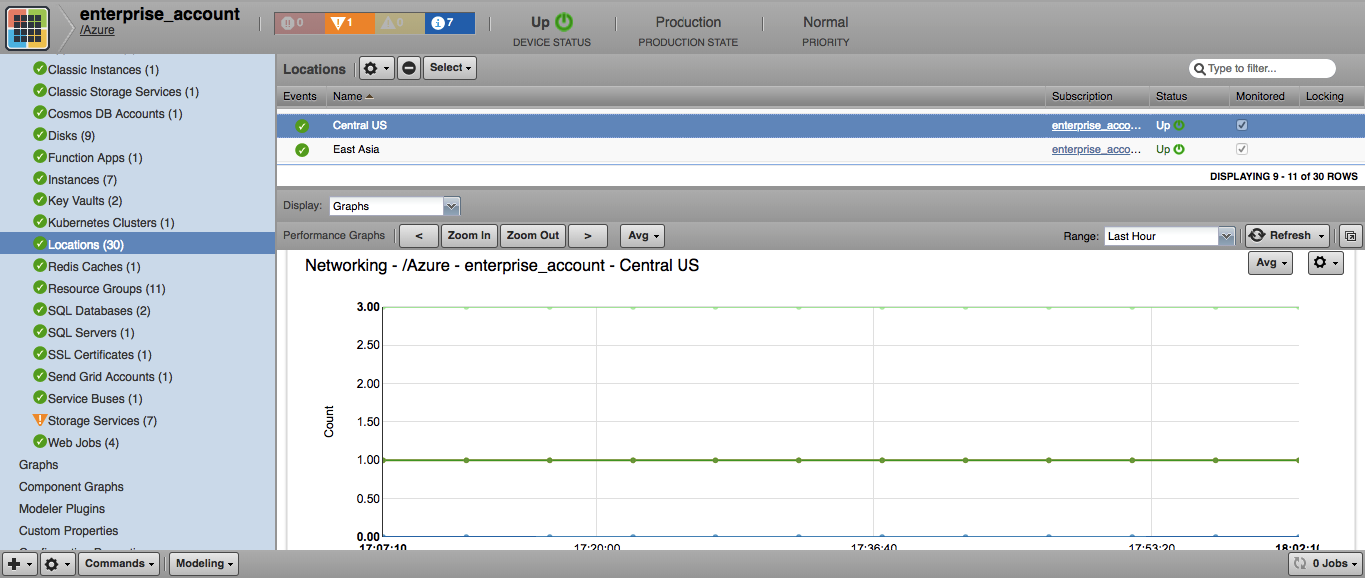
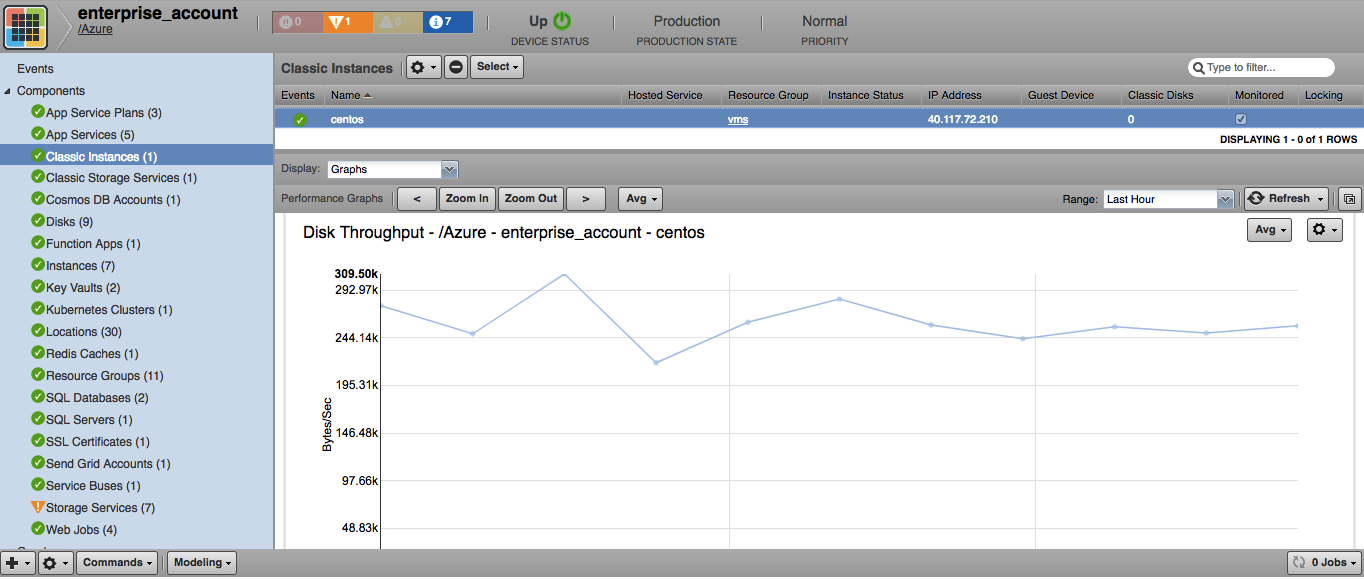
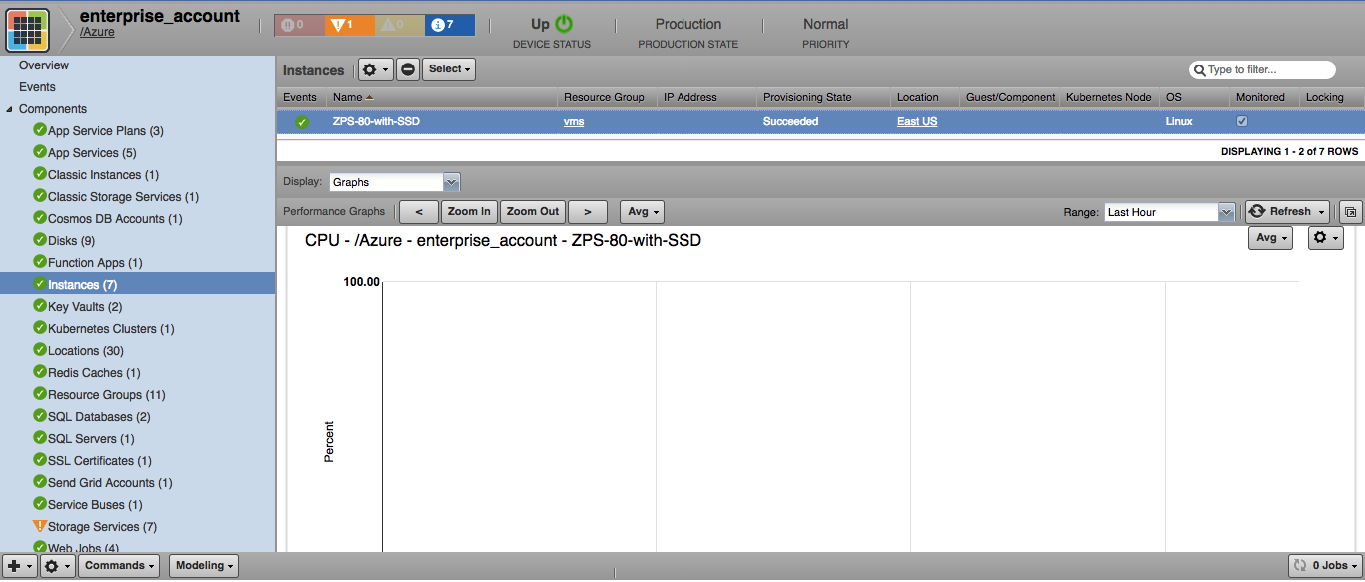
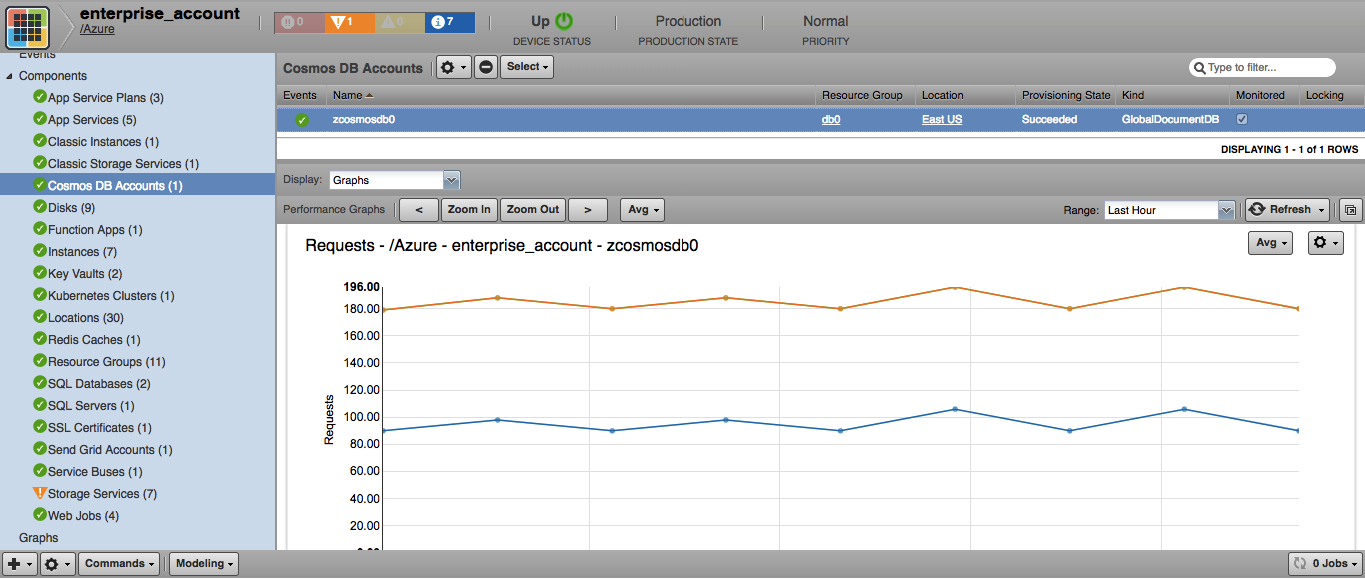
The following metrics will be collected every 5 minutes by default. The Average statistic is collected, and the graphed value is per second for anything that resembles a rate.
Storage Services
- Metrics
- Transactions
- Ingress
- Egress
- SuccessServerLatency
- SuccessE2ELatency
- Availability
- UsedCapacity
App Service Plans
- Metrics
- CpuPercentage
- MemoryPercentage
- DiskQueueLength
- HttpQueueLength
- BytesReceived
- BytesSent
App Services
Windows-based:
- Metrics
- CpuTime
- Requests
- BytesReceived
- BytesSent
- IoReadBytesPerSecond
- IoWriteBytesPerSecond
- AverageResponseTime
- AppConnections
- MemoryWorkingSet
- AverageMemoryWorkingSet
- Http5xx
- Aggregation Types
- Average
- Total
Linux-based:
- Metrics
- CpuTime
- Requests
- BytesReceived
- BytesSent
- IoReadBytesPerSecond
- IoWriteBytesPerSecond
- AverageResponseTime
- MemoryWorkingSet
- AverageMemoryWorkingSet
- Http5xx
- Aggregation Types
- Average
- Total
Locations
- Metrics
- UltraSSDDiskCount
- PremiumSnapshotCount
- PublicIPAddresses
- StandardSnapshotCount
- LoadBalancers
- StandardSSDDiskCount
- VirtualNetworks
- ApplicationGateways
- StandardDiskCount
- availabilitySets
- ZRSSnapshotCount
- PremiumDiskCount
- virtualMachines
- cores
- StaticPublicIPAddresses
- basicAFamily
- standardBSFamily
- virtualMachineScaleSets
- NetworkInterfaces
- standardA0_A7Family
- standardA8_A11Family
- standardDFamily
- standardDv2Family
- standardDSFamily
- standardDSv2Family
- standardGFamily
- standardGSFamily
- standardFFamily
- standardFSFamily
- standardNVFamily
- standardNCFamily
- standardHFamily
- standardAv2Family
- standardLSFamily
- standardDv2PromoFamily
- standardDSv2PromoFamily
- standardMSFamily
- standardDv3Family
- standardDSv3Family
- standardEv3Family
- standardESv3Family
- standardFSv2Family
- standardNDSFamily
- standardNCSv2Family
- standardNCSv3Family
- standardLSv2Family
- standardEIv3Family
- standardEISv3Family
- standardDCSFamily
- standardNVSv2Family
- standardHBSFamily
- standardHCSFamily
Note
List of locations that do not support the monitoring of Microsoft.Network and Microsoft.Compute resource metrics: 'australiacentral2', 'brazilsoutheast', 'brazilus', 'francesouth', 'germanynorth', 'jioindiacentral', 'norwaywest', 'southafricawest', 'switzerlandwest'.
Classic Instances
- Metrics
- Percentage CPU
- Network In
- Network Out
- Disk Read Bytes/Sec
- Disk Write Bytes/Sec
- Disk Read Operations/Sec
- Disk Write Operations/Sec
- Aggregation Types
- Average
- Total
Instances
- Metrics
- Percentage CPU
- Network In
- Network Out
- Disk Read Bytes/Sec
- Disk Write Bytes/Sec
- Disk Read Operations/Sec
- Disk Write Operations/Sec
- CPU Credits Remaining
- CPU Credits Consumed
- Aggregation Types
- Average
- Total
- State
- Current power state
Cosmos DB Accounts
- Metrics
- MetadataRequests
- TotalRequests
- TotalRequestUnits
- Aggregation Types
- Count
ExpressRoute Circuits
- Metrics
- ArpAvailability
- BgpAvailability
- BitsInPerSecond
- BitsOutPerSecond
- GlobalReachBitsInPerSecond
- GlobalReachBitsOutPerSecond
- QosDropBitsInPerSecond
- QosDropBitsOutPerSecond
- Aggregation Types
- Average
Firewalls
- Metrics
- FirewallHealth
- Throughput
- DataProcessed
- SNATPortUtilization
- ApplicationRuleHit
- NetworkRuleHit
- Aggregation Types
- Average
Function Apps
Windows-based:
- Metrics
- BytesReceived
- BytesSent
- Http5xx
- MemoryWorkingSet
- AverageMemoryWorkingSet
- FunctionExecutionUnits
- FunctionExecutionCount
- AppConnections
- Handles
- Threads
- IoReadBytesPerSecond
- IoWriteBytesPerSecond
- IoOtherBytesPerSecond
- IoReadOperationsPerSecond
- IoWriteOperationsPerSecond
- IoOtherOperationsPerSecond
- RequestsInApplicationQueue
- Gen0Collections
- Gen1Collections
- Gen2Collections
Linux-based:
- Metrics
- BytesReceived
- BytesSent
- Http5xx
- MemoryWorkingSet
- AverageMemoryWorkingSet
- FunctionExecutionUnits
- FunctionExecutionCount
- AppConnections
- Handles
- IoReadBytesPerSecond
- IoWriteBytesPerSecond
- IoOtherBytesPerSecond
- IoReadOperationsPerSecond
- IoWriteOperationsPerSecond
- IoOtherOperationsPerSecond
- RequestsInApplicationQueue
Key Vaults
- Metrics
- ServiceApiHit
- ServiceApiLatency
- ServiceApiResult
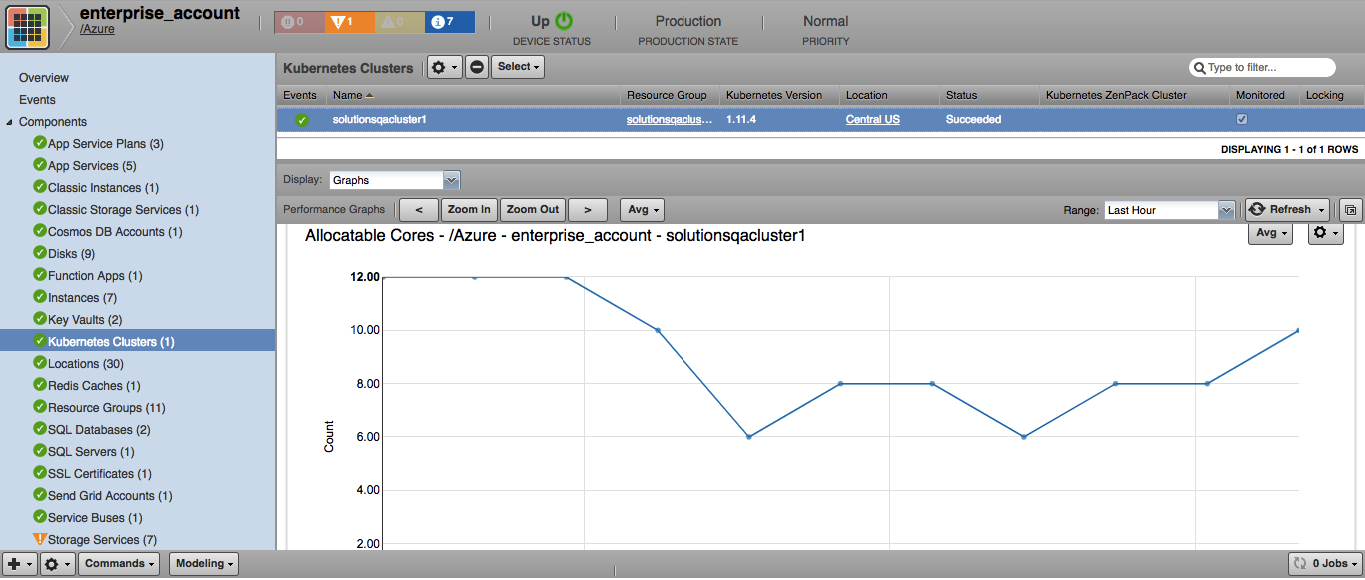
Kubernetes
- Metrics
- kube_node_status_allocatable_cpu_cores
- kube_node_status_allocatable_memory_bytes
- kube_pod_status_ready
- Aggregation Types
- Total
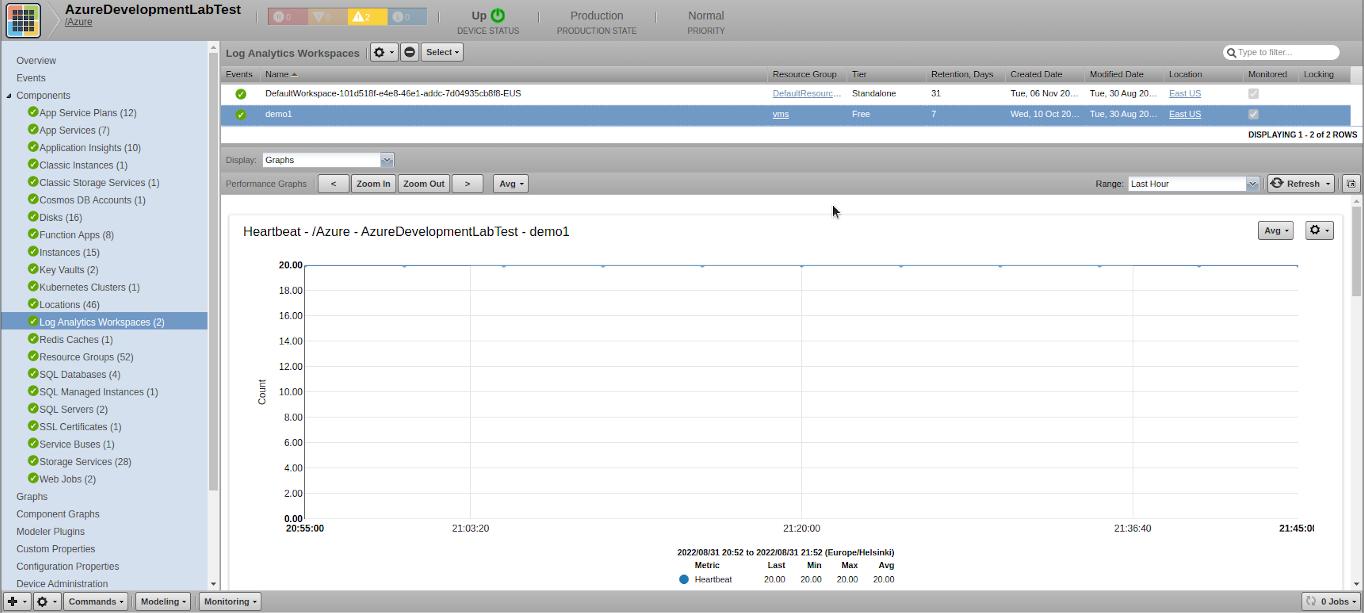
Log Analytics Workspaces
- Metrics
- heartbeat
- free_space
- disk_sec_read
- disk_sec_write
- disk_sec_transfer
- processes
- Aggregation Types
- Count
- Average
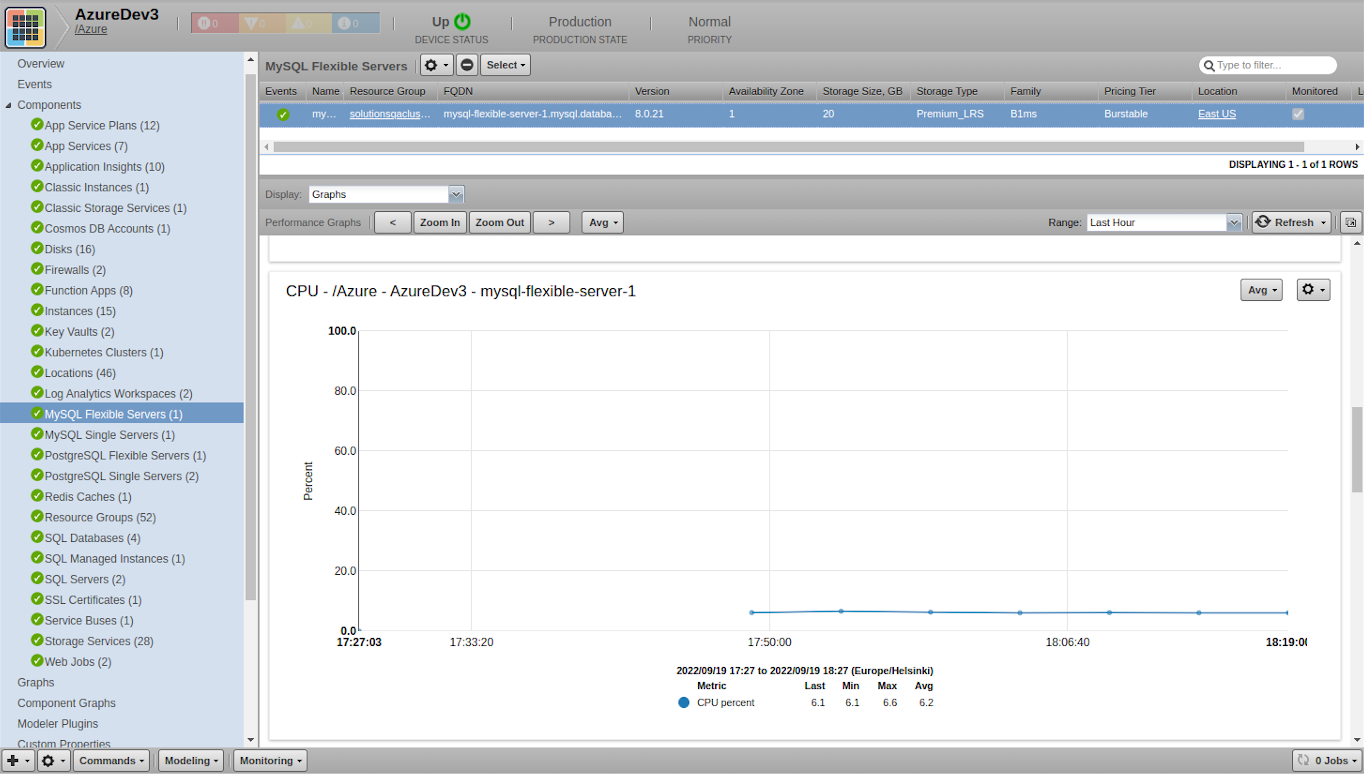
MySQL Flexible Servers
- Metrics
- aborted_connections
- active_connections
- total_connections
- queries
- cpu_percent
- cpu_credits_consumed
- cpu_credits_remaining
- memory_percent
- storage_limit
- storage_used
- Aggregation Types
- Average
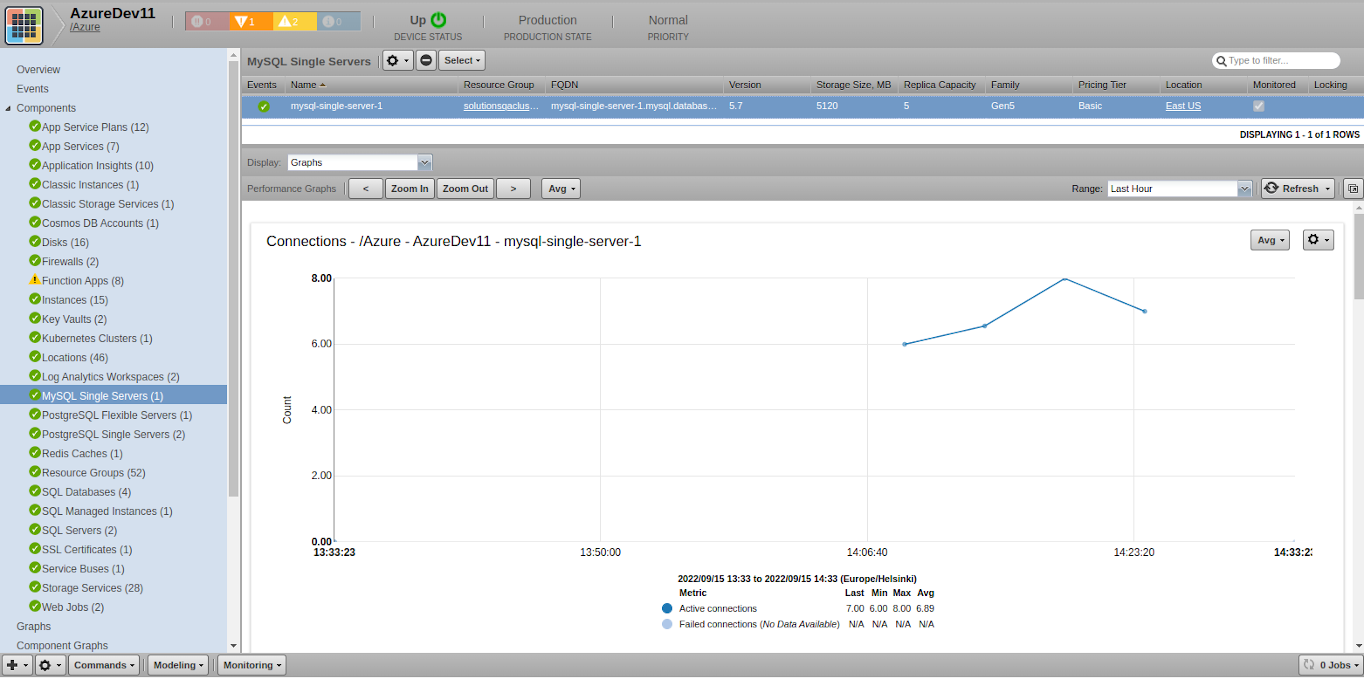
MySQL Single Servers
- Metrics
- active_connections
- connections_failed
- cpu_percent
- memory_percent
- storage_limit
- storage_used
- serverlog_storage_limit
- serverlog_storage_usage
- Aggregation Types
- Average
PostgreSQL Flexible Servers
- Metrics
- active_connections
- connections_failed
- connections_succeeded
- cpu_percent
- cpu_credits_consumed
- cpu_credits_remaining
- memory_percent
- storage_free
- storage_used
- Aggregation Types
- Count
- Average
PostgreSQL Single Servers
- Metrics
- active_connections
- connections_failed
- cpu_percent
- memory_percent
- storage_limit
- storage_used
- serverlog_storage_limit
- serverlog_storage_usage
- Aggregation Types
- Count
- Average
Redis Caches
- Metrics
- usedmemorypercentage
- cachehits
- cachemisses
- cacheWrite
- cacheRead
- totalcommandsprocessed
- getcommands
- setcommands
- evictedkeys
- totalkeys
- expiredkeys
- percentProcessorTime
SQL Databases
DTU-based:
- Metrics
- cpu_percent
- physical_data_read_percent
- log_write_percent
- dtu_consumption_percent
- sessions_percent
- workers_percent
- connection_failed
- blocked_by_firewall
- connection_successful
- deadlock
- xtp_storage_percent
- storage
- dtu_limit
- dtu_used
- storage_percent
- Aggregation Types
- Average
V-Core-based:
- Metrics
- cpu_percent
- physical_data_read_percent
- log_write_percentx
- sessions_percent
- workers_percent
- connection_failed
- blocked_by_firewall
- connection_successful
- deadlock
- xtp_storage_percent
- storage
- storage_percent
- Aggregation Types
- Average
SQL Managed Instances
- Metrics
- avg_cpu_percent
- storage_space_used_mb
- reserved_storage_mb
- virtual_core_count
- Aggregation Types
- Average
SQL Servers
- Metrics
- storage_used
- dtu_used
- dtu_consumption_percent
- Aggregation Types
- Average
Service Buses
- Metrics
- SuccessfulRequests
- ThrottledRequests
- IncomingRequests
- ServerErrors
- UserErrors
- IncomingMessages
- OutgoingMessages
- ActiveConnections
- Size
- Messages
- ActiveMessages
- DeadletteredMessages
- ScheduledMessages
SSL Certificates
- Metrics
- Days Remaining
Application Insights
- Metrics
- dependencies_count_cnt
- dependencies_failed_cnt
- requests_duration_avg
- requests_count_cnt
- requests_failed_cnt
Functions
- Metrics
- requests_invocations_count_cnt
- requests_invocations_error_cnt
- requests_success_rate
- requests_duration_avg
Note
ZenPack uses application insights API to monitor Azure functions components which can take additional costs. To get info about Azure pricing please visit the following link: https://azure.microsoft.com/en-us/pricing/details/monitor/
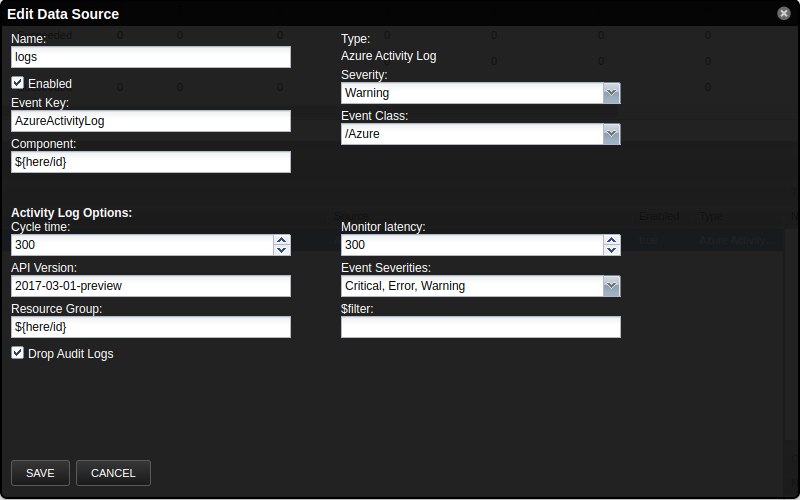
Activity Log Datasource
The Azure Activity Log datasource
can be configured to query the activity log of Azure resources. By
default, all resource groups are monitored for Critical, Error, and
Warning events. You can also create a custom filter according to
Microsoft Azure
specs.
Do not use the eventTimestamps in your filter. We will build that
according to your cycletime and add it to the filter.
Audit logs are dropped by default. To allow them, simply uncheck the Drop Audit Logs box on the datasource.
Supported Activity Log event types:
- Administrative
- Service Health
- Resource Health
- Alert
- Autoscale
- Recommendation
- Security
- Policy
You can find detailed information about Azure Activity Log event types and their specification in the Azure Activity Log event schema.
Note: In ZenPack version 3.0.0,
the event field category was removed from the section Event Details
and its value was moved to the field eventGroup in the section Event
Management.
Activity Log Monitoring
Azure Monitor which pushes events into Azure Activity Log does this with a latency connected with the time that data is created on the monitored system and the time that it comes available for analysis in Azure Monitor. Consequently, all events have appeared in the Azure Activity Log with some latency, however, the time stamp for each event is specified as a direct time of event occurrence within Azure. Detailed information about latency and its time estimation can be found in the Log data ingestion time in Azure Monitor. As the result, some events can be missed during the monitoring of the Azure Activity Log.
To resolve this issue you need empirically to compute and set the
monitor_latency property for the AzureActivityLog monitoring
template.
To estimate the monitor_latency for your Azure device, you can
generate some events (e.g. stop or start a virtual machine, server, or
service) and track the time of its appearance in the Azure Activity Log.
The recommended monitor_latency for the AzureActivityLog monitoring
template should be defined using the following formula
monitor_latency = AzureMonitorLatencyTime + AzureActivityLogMonitoringTime. Note that Azure Monitor latency is variable, it depends on the
configuration of your Azure device (e.g. number of components, consumed
resources, etc.). Therefore after some changes on your device (adding,
removal of some components, etc.), the monitor_latency value is
recommended to recalculate to avoid possible issues during the event
monitoring. There are two border cases:
- After changes on the device, the
AzureMonitorLatencyTimebecame lesser than it was previously. In this case,monitor_latencywill be greater than it really required, which will cause the monitoring timespans to overlap, as a result, some events from Azure Activity Log can be collected more than one time, and it will affect the counter of such events. - After changes on the device, the
AzureMonitorLatencyTimebecame greater than it was previously. In this case,monitor_latencywill be lesser than it really required, which will cause time gaps between the monitoring timespans, as a result, some events from Azure Activity Log will be missed during the monitoring.
The AzureActivityLogMonitoringTime also can be computed empirically by
running the monitoring of the device a number of times and then
computing the average time.
Metrics Datasource
The Azure Metrics datasource can be configured to query metrics for
specific components using the Azure Monitor REST API.
Options supported are the interval, metricnames, aggregation,
namespace, and $filter. The timespan will be calculated according to
the datasource cycle time.
The namespace is dependent on the type of resource. For example, for virtual machines, one would use "Microsoft.Compute/virtualMachines". We build a list of namespaces from the installed Azure modeler plugins from which you can choose, or you can enter your own.
The interval is the timegrain of the query and can be one of the following values:
- PT1M, PT5M, PT15M, PT30M, PT1H, PT6H, PT12H, P1D
Metric names are dependent on the type of resource being monitored. Available metrics and namespaces can be found here.
By clicking the down arrow in the Metric Names box, you can auto-discover available metrics for a given namespace. You will be shown a box that will allow you to select your subscription, a resource group, and a specific resource. You must choose a resource that belongs in the given namespace. For example, if you want to know available metrics for a virtual machine, you would enter 'Microsoft.Compute/virtualMachines' for the namespace and select a virtual machine for the resource. Some metrics may show as 'Deprecated' or 'Preview' and therefore will not contain data.
Aggregation types can be one or more of the following values:
- Average, Maximum, Minimum, Total, Count
You can type them in, or choose one or more from the drop-down list.
The $filter parameter can be used to reduce the amount of data returned. Typically, one would use this field to match certain metadata of the resource.
See the Metrics - List documentation for more detail on these options.
To choose the datapoints to store, click the trigger in the Data Points field. This will show a dialog to select the datapoints based on the metric name and aggregation type. We will create or remove datapoints automatically when you save the data source.
Zenoss recommends not creating them yourself, but, if you do manually create the datapoints, you must use the following format:
_lower_case_metric_
For example, if you have a datasource named "virtualMachine" that is querying the "Network In" metric for the Total aggregation, you would enter the following:
"virtualMachine_network_in_tot"
Use the common abbreviations for the aggregations:
- Average = avg
- Maximum = max
- Minimum = min
- Total = tot
- Count = cnt
Only use alphanumeric characters.
Testing the datasource
If you would like to test your settings to be sure everything is correct, press the Test Against Azure button. This will show a dialog to select your subscription, a resource group, and a resource. After selecting the resource, it will run a query with your current settings and display the results if all was successful. When you are satisfied with your settings, simply save the datasource.
Selective monitoring
If property zAzureMonitoringIgnore is filled with a proper Python expression that returns a boolean value, then this expression will be evaluated against each device component. And if a result of that expression is True then the component will not be monitored. The following variables are defined for each component and can be used inside user-defined expressions:
- cls - component's class name
- cmp - component object
For example, to exclude monitoring of all _Instance_ components, the value of the zAzureMonitoringIgnore property should be:
cls == 'ARMVirtualMachine'
If some particular component with the name foo needs to be excluded, the value should be:
cmp.name() == 'foo'
It is possible to use Python collections to be able to handle multiple components:
cmp.name() in ['foo', 'bar']
There is a possibility to combine statements. In addition to the previous example, this one also excludes all Kubernetes Cluster components:
cmp.name() in ['foo', 'bar'] or cls == 'AzureKubernetesCluster'
A list of component classes can be found under the "Component Types" subsection of the "Installed Items" section.
Service Impact
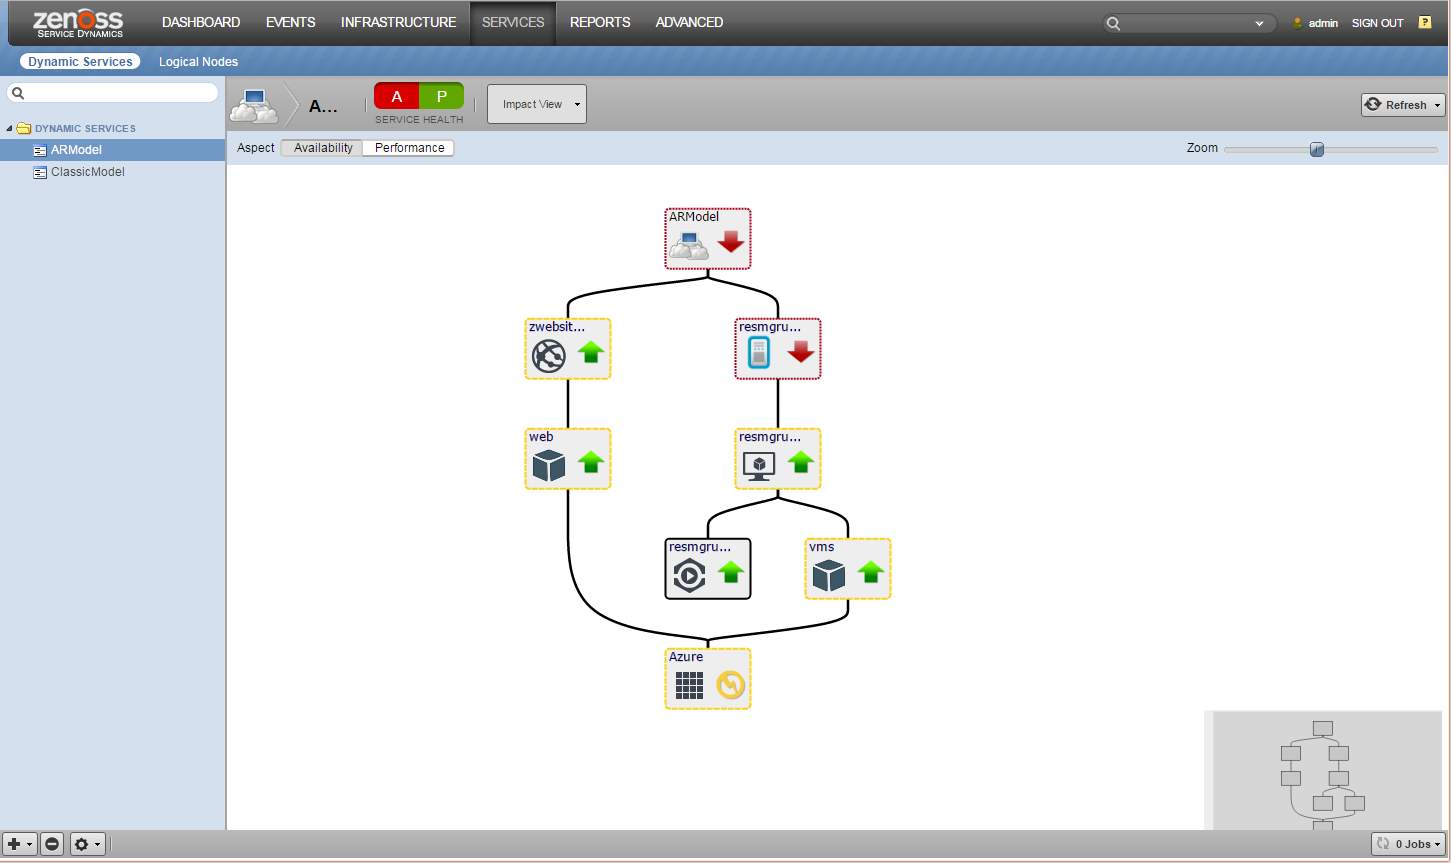
When combined with the Zenoss Service Dynamics product, this ZenPack adds built-in service impact capability for services running on Microsoft Azure Service. The following service impact relationships are automatically added. These will be included in any services that contain one or more of the explicitly mentioned entities.
Service Impact Relationships
-
Subscription failure affects resource groups and locations.
-
Resource Group failure affects storage services, Kubernetes clusters, instances, classic instances, SQL servers, app service plans, Redis caches, cosmos DB accounts, service buses, key vaults, send grids, certificates, virtual network sites, application insights, and storage accounts.
-
Instance failure affects related guest devices and Kubernetes nodes.
-
Disk failure affects Instance.
-
SQL Server failure affects databases.
-
App service plan failure affects azure app services and web functions.
-
App Service failure affects web jobs.
-
Web Job failure affects functions.
Note: Many classic components are no longer modeled or monitored, such as disks, subnets, queues, tables, and containers.
Billing Charts for Enterprise Azure Customers
If zProperties zAzureEAAccessKey (Azure Enterprise Account Access Key) and zAzureEAEnrollmentNumber (Azure Enterprise Account Enrollment Number) are filled with correct values and the AzureEABillingDataSourcePlugin data source plugin is attached to the device or the EstimatedCharges template is bound to a device, then billing charts will be available at:
- Device overview page
- Billing Charts page
Both Access Key and Enrollment Number are available for Enterprise Azure Customers at Azure Enterprise Portal. To generate or retrieve the key please navigate to "Reports" > "Download Usage" > "API Access Key".
Note: EstimatedCharges template is required to be bound to the device on Zenoss Cloud in order to see billing data on SmartView/DashBoard.
Device Overview Page
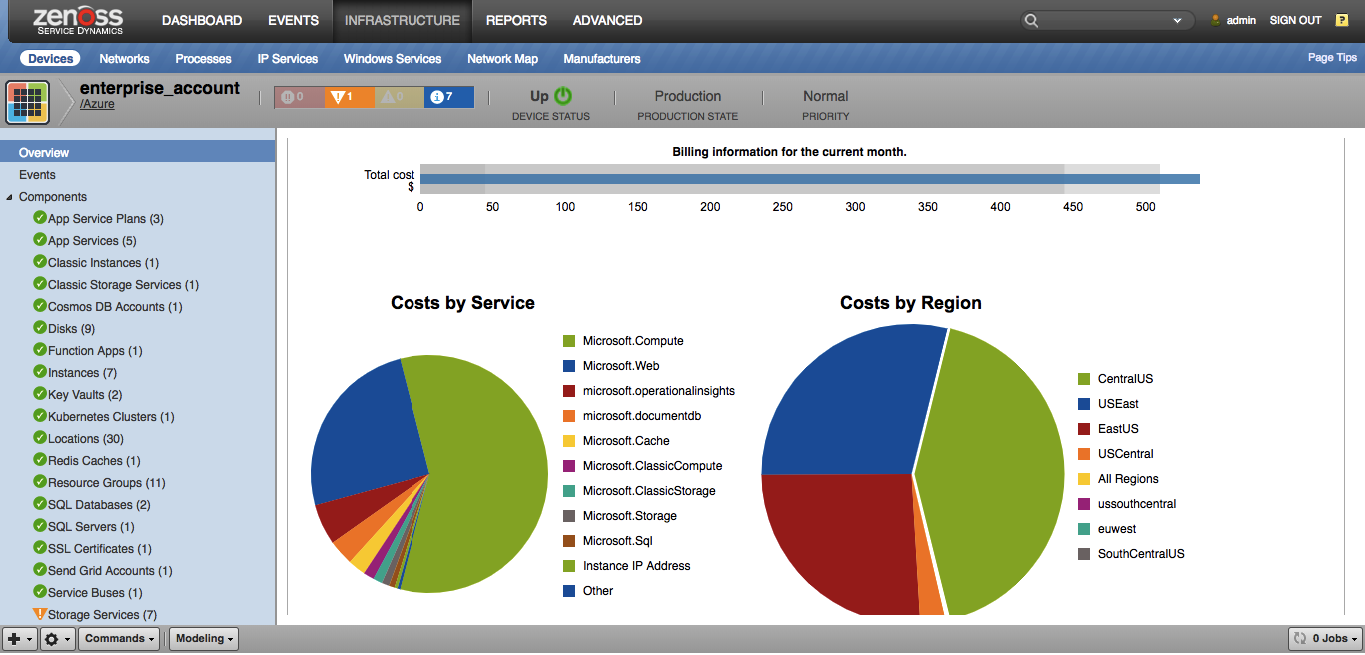
Five charts on the device overview page:
- Total cost bullet chart. It shows the total money spend in the current month, and also the minimum, maximum and average for all previous months
- Pie chart 'Costs by Service'. Shows distribution of money spends in the current month by services.
- Pie chart 'Costs by Region'. Shows distribution of money spends in the current month by region.
- 'Services by top Regions'. Shows the top 10 most expensive services in the current month by region.
- 'Regions by top Services'. Shows the top 10 most expensive regions in the current month by services.
Note: for the current day we update billing data every single hour, so you could be aware of your ongoing spending.
Billing Charts Page
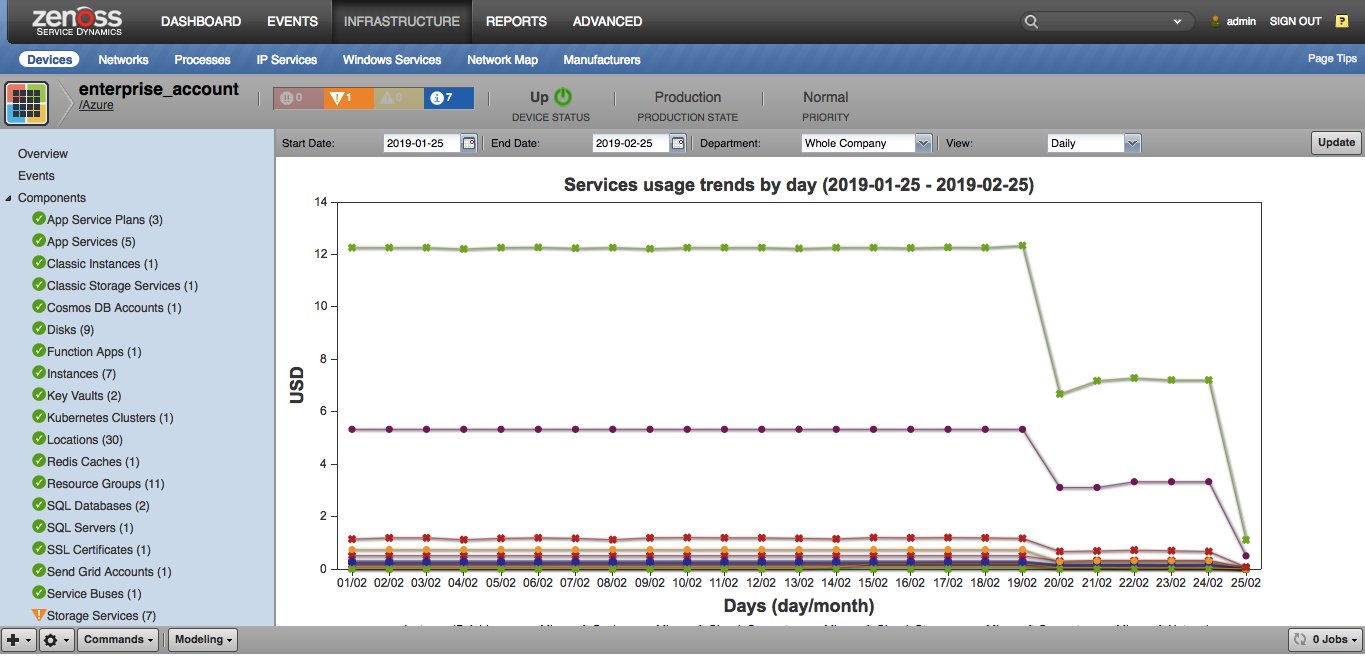
Two charts on the Billing Charts page
- Services usage trends.
- Regions usage trends
By default values are displayed on a daily basis for each Region and Service for a current month. After modeling the device for the first time, billing data (for a day) will start appearing every five minutes. The following options can be changed by controls on the top of the page:
- Start date - the date from data is displayed
- End date - the date till data on graphs are displayed
- Department - the department for which data are displayed
- View - on which basis (daily/monthly) data are displayed.
Reports
The Azure ZenPack provides a report displaying unattached VHDs. These are PageBlobs with a lease status of 'unlocked'. This report is generated by contacting Azure directly to build this list.
Note: The Blob component has been deprecated in v2.0.0 of the ZenPack. This is the reason we contact Azure directly to build this list. Because there could potentially be a very large number of Blobs, generating this list could take several minutes to complete.
Usage
Adding Azure Subscriptions
Use the following steps to start monitoring Azure Subscription using the Zenoss web interface.
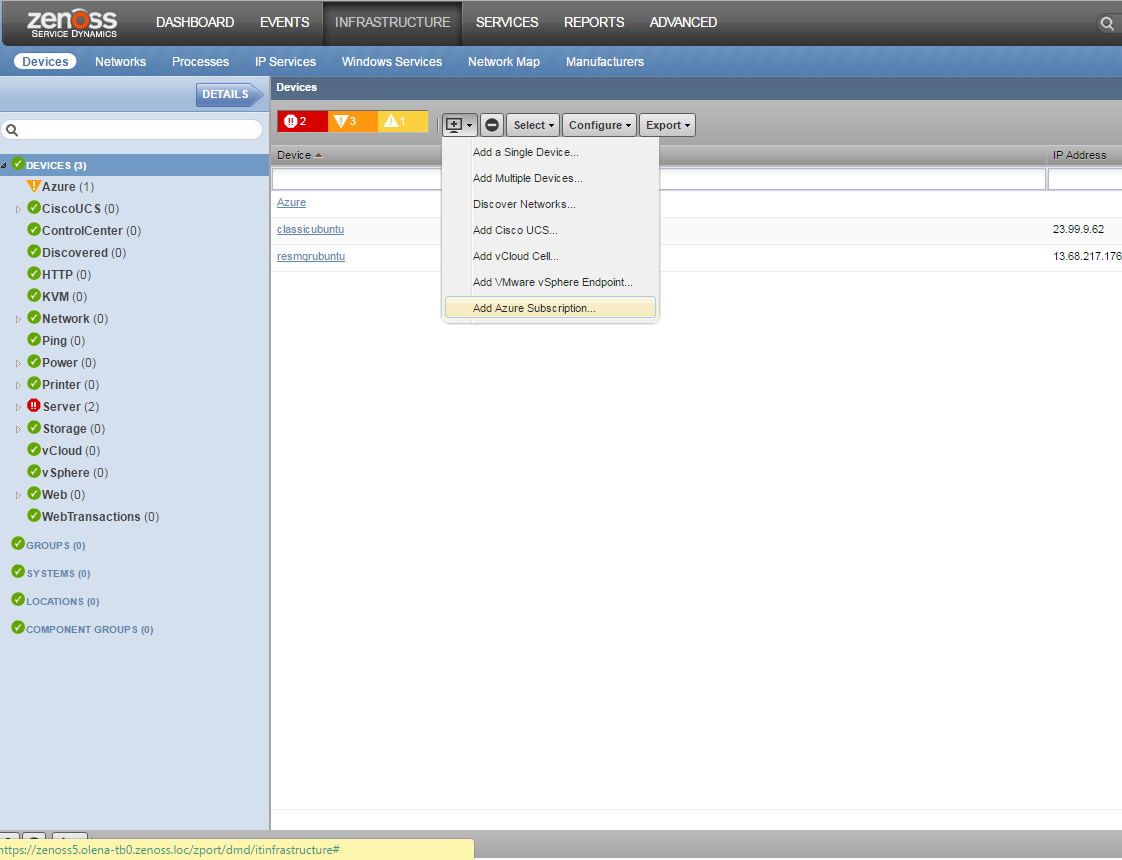
- Navigate to the Infrastructure page.
- Choose Add Azure Subscription from the add device button (Note: Azure subscriptions can't be added through 'Add Multiple Devices' or 'Add a Single Device' dialogs).
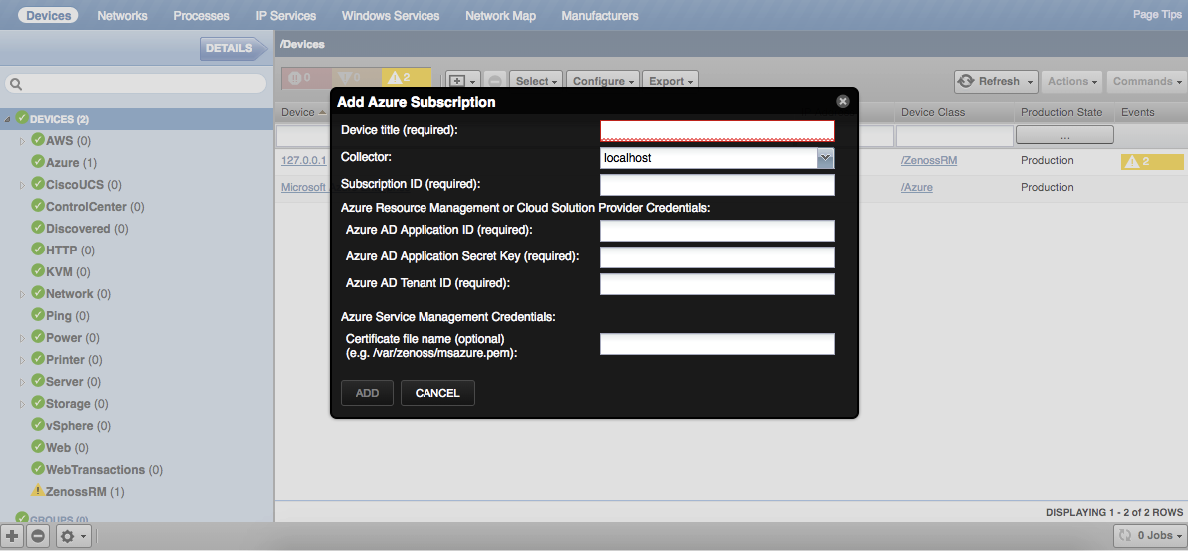
- Enter your Azure account name, Subscription ID, Application ID, Secret Key, and Tenant ID, and optionally choose a collector other than the default localhost (Note: Cert File is an optional parameter).
- Now please choose which type of Azure resources should be modeled and monitored. There are two types of resources that Azure zenpack is able to collect: Azure Resource Management (ARM) using Service Principal and Azure Service Management (ASM) using certificate file. It is possible to collect only ARM resources or both of them.
Please refer yourself to the following sections to set up an ARM and/or ASM account:
Collecting Resources Created in Azure Resource Manager Deployment Model (ARM) or Azure Cloud Solution Provider (CSP)
Modeling and monitoring of resources created in the ARM deployment model require the account to be available to authenticate requests using Azure service principal, see (Use portal to create Active Directory application and service principal that can access resources) for details.
Please follow the Microsoft instructions above to create an Azure Active Directory application and service principal, and fill in all fields in 'Azure Resource Management or Cloud Solution Provider Credentials'.
The values are stored in the following zProperties and they are available for modification later:
- zAzureApplicationID for Azure Active Directory Application ID
- zAzureSecretKey for Azure Active Directory Application Secret Key
- zAzureTenantID for ID of Azure Active Directory instance (Active Directory tenant ID)
- zAzureSubscriptionID for Azure Subscription ID
Enabling billing data collection for Enterprise Accounts
This requires an Access Key and Enrollment Number that can be obtained at Azure Enterprise Portal (http://ea.azure.com/)
- Fill in zProperties zAzureEAAccessKey and zAzureEAEnrollmentNumber with values from Azure Enterprise Portal
- Add AzureEABillingDataSourcePlugin data source plugin to monitoring template /Azure/AzureSubscription.
Configuration options
-
zAzureEAAccessKeyAccess Key used to collect billing information for Azure Enterprise Accounts (EA) -
zAzureEAEnrollmentNumberAzure Enterprise Account Enrollment Number used to collect billing information -
zAzureEABillingCostThresholdThreshold to generate an event when the defined cost is reached for Azure Enterprise Account, It turns on after all necessary billing data is collected. -
zAzureMonitoringIgnorePython expression to disable monitoring of particular components -
zAzureApplicationIDAzure Active Directory Application ID -
zAzureSecretKeyAzure Active Directory Application Secret Key -
zAzureTenantIDID of Azure Active Directory instance -
zAzureSubscriptionIDAzure Subscription ID -
zAzureCertFileLocation of the Azure certificate file, e.g./var/zenoss/azure.pem -
zAzureCollectionIntervalHow often to collect metrics and events from Azure -
zAzureConnectionPoolSizeHow large of a connection pool to use to communicate with Azure -
zAzureUseEnvironmentProxiesWhether to use environment proxy if defined.
Configuring HTTP Proxies
If necessary, this zenpack can query Azure through an HTTP proxy. This
is configured in the usual way, by setting the *_proxy environment
variables. Because of this, the setting is global for a particular
zenoss process. It is therefore important to be aware that, for
instance, enabling proxying for zenpython may cause it to be used for
other service monitoring beyond just Azure.
To configure these environment variables, edit the service definitions (via 'serviced service edit' or the Control Center UI) for the zenpython, zenmodeler, zenjobs and zminion containers as follows:
Change
"Environment": null,
to:
"Environment": [ "http_proxy=http://[proxy host]:[proxy port]", "https_proxy=http://[proxy host]:[proxy port]", "no_proxy=localhost" ],
Both http_proxy and https_proxy values must begin with http://.
The no_proxy variable is required so that communication with other
zenoss services is not impacted.
To be able to use environment proxies zAzureUseEnvironmentProxies
property must be set to True.
Note: As HTTP clients are cached for each API endpoint, after changing
the value of zAzureUseEnvironmentProxies property or *_proxy
environment variables, zenmodeler, and zenpython services may need to be
restarted.
Note: Do not add this to the zope container.
Configuring Application Insights Components
To get data collected by Application Insights for your Azure application, you need to set a special key. To do that, go to the Application Insights component, choose the 'Details' tab from the dropdown list and put your Application Insights Secret Key into the 'Application Insights API Key' field, then click 'Save'.
How to generate Application Insights Secret Key
- In the Azure portal, open the Application Insights resource for your application and open Settings, API Access.
- Create a new API key, checking the "Read telemetry" box.
- Copy the key before closing the Create API key blade and save it somewhere secure.
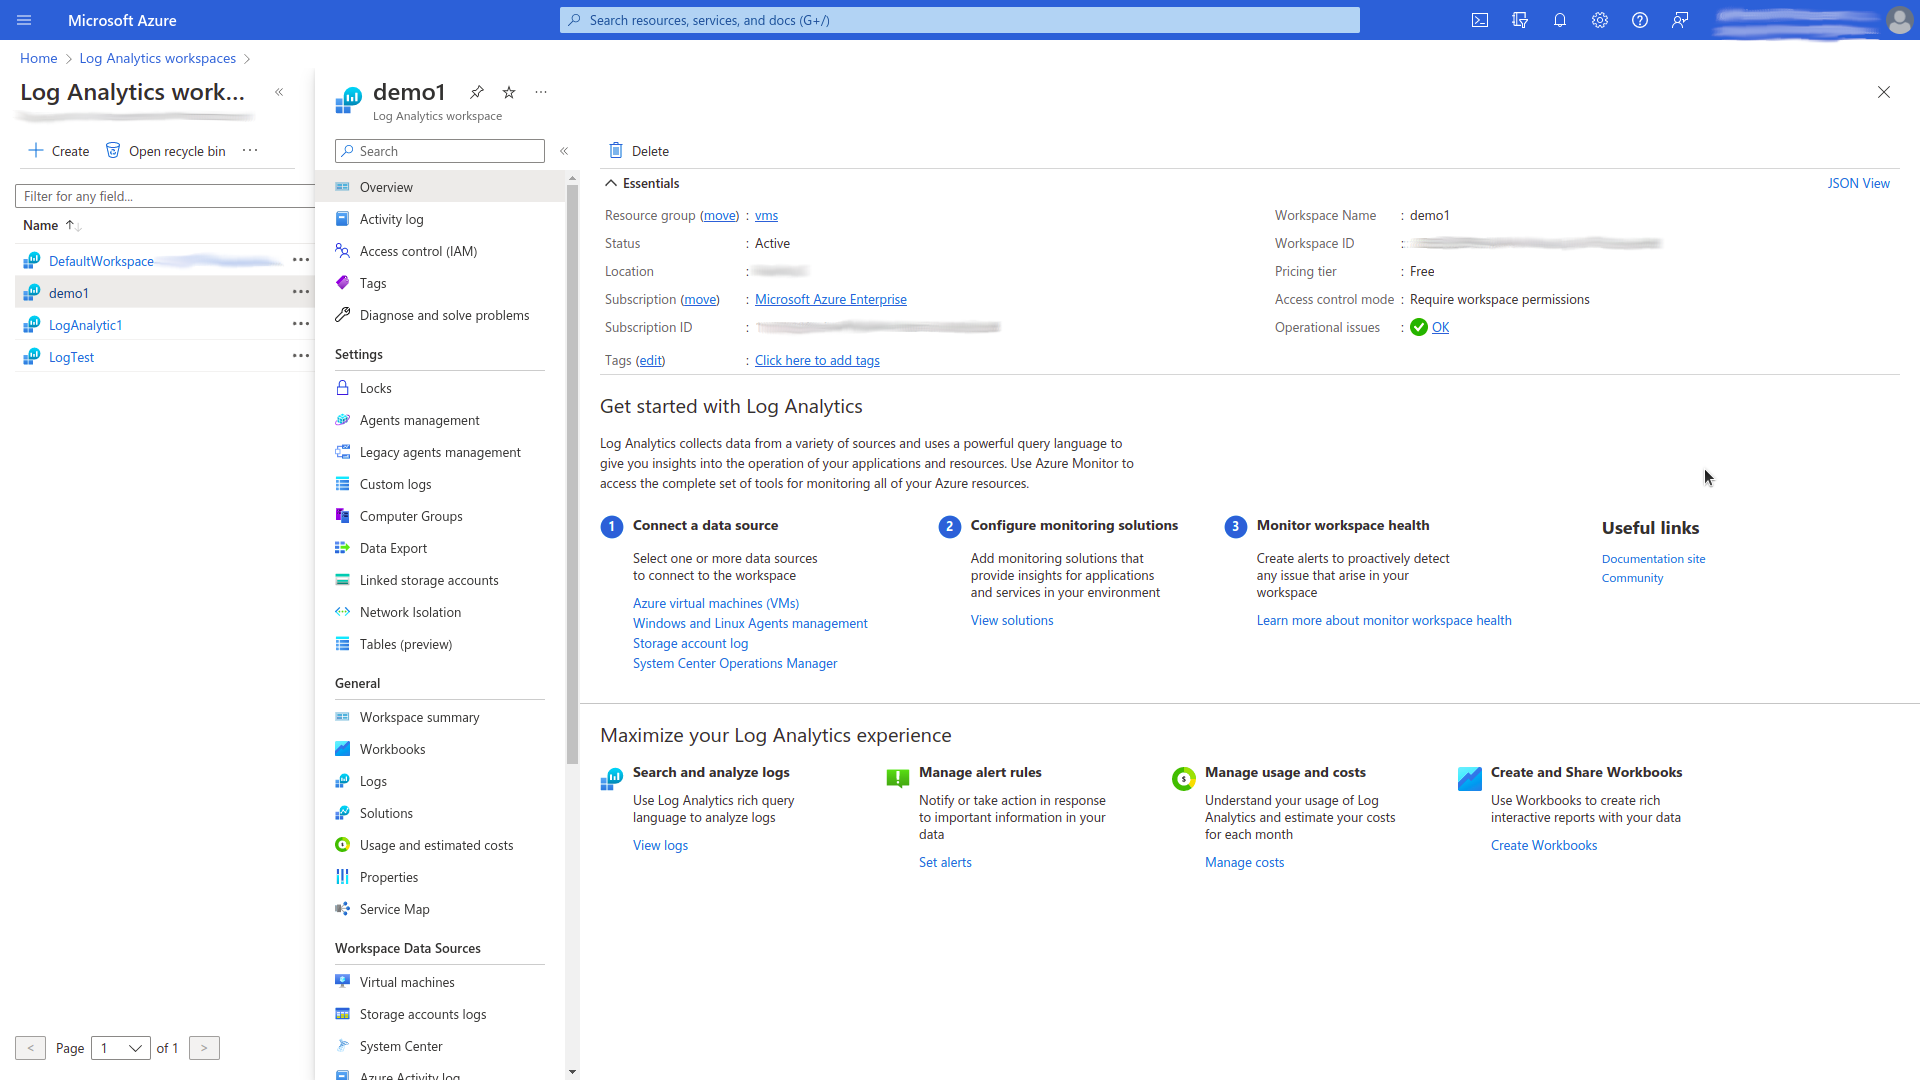
Configuration Log Analytics Workspace Monitoring
To get data collected by Log Analytics Workspaces for your Azure subscription, you need to configure the collection of corresponding aggregated metrics. For this purpose do the following steps:
-
Choose which one of the available (previously created) Log Analytics Workspaces you want to monitor.
-
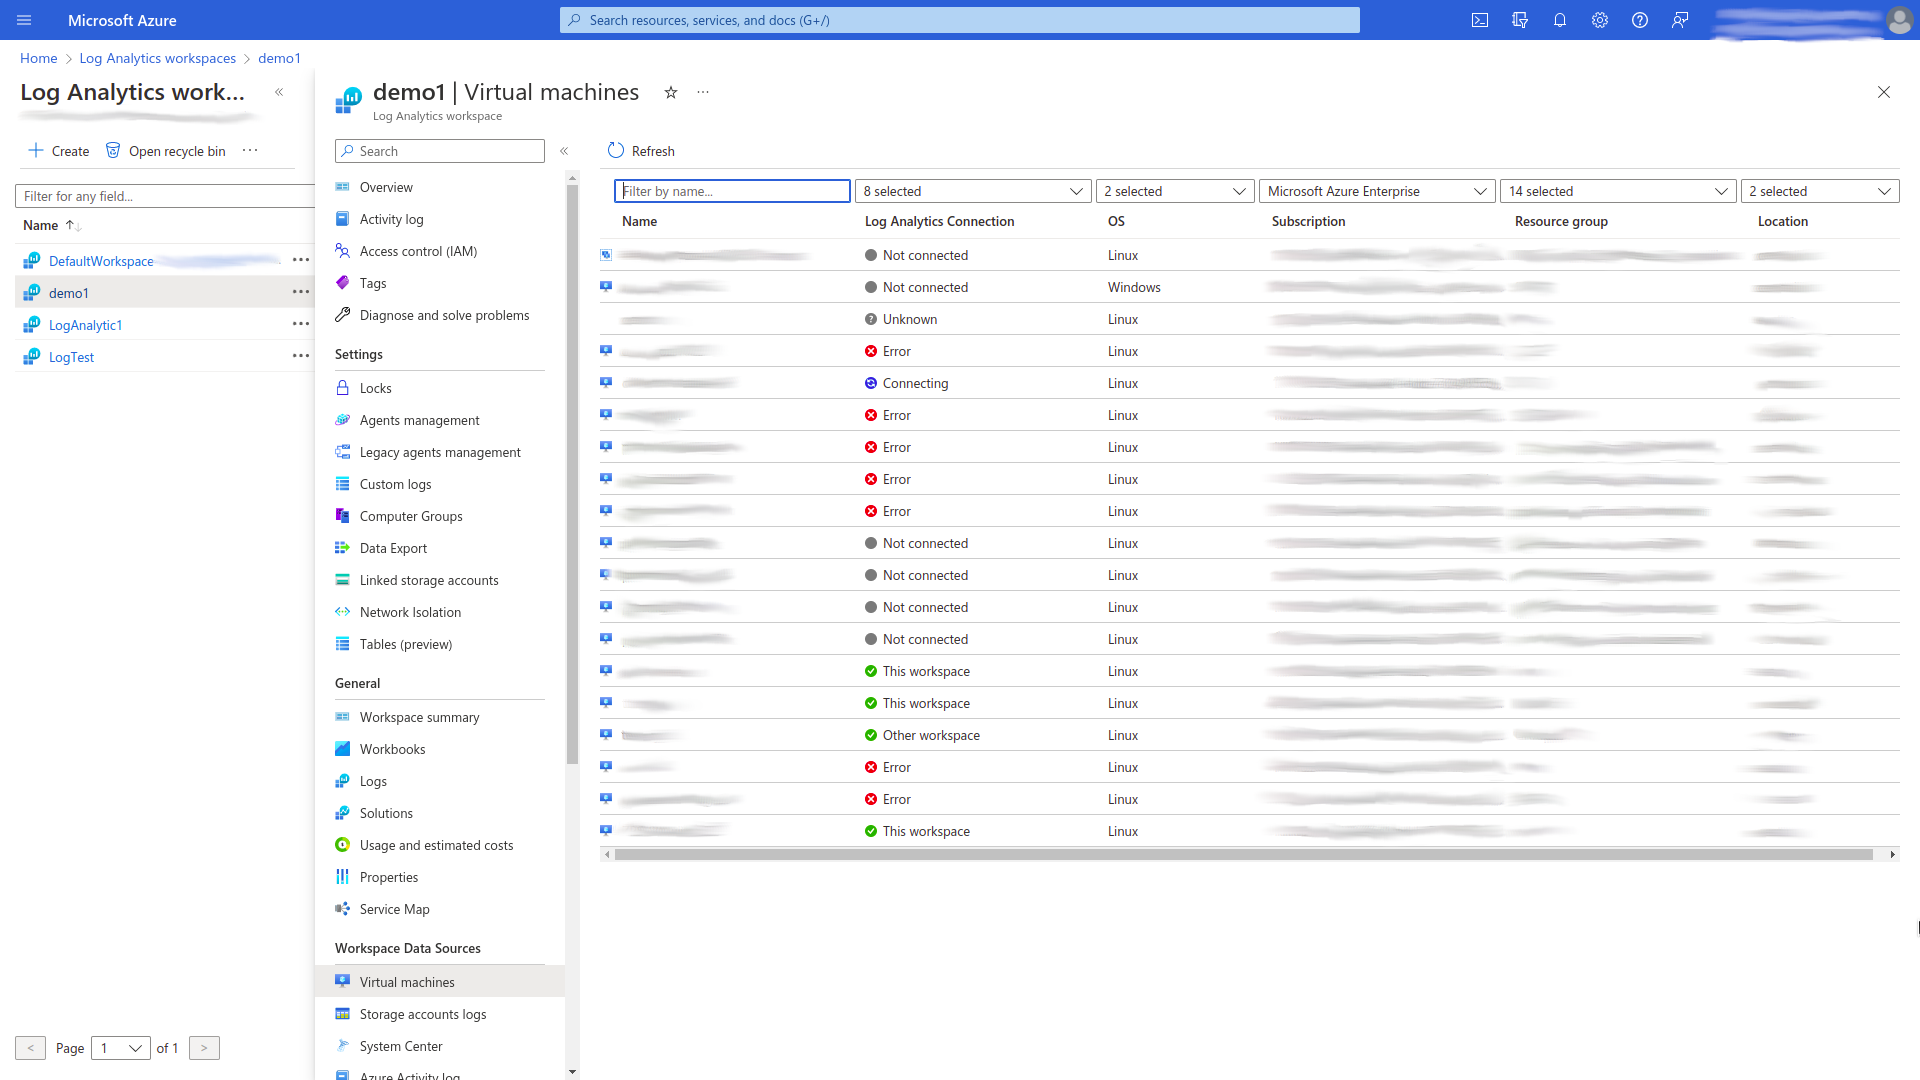
Open the Virtual machines page/tab of chosen Log Analytics Workspace and connect a particular virtual machine. Note that, all Virtual Machines, which you want to connect to chosen Log Analytics Workspace, should be located in the same resource group as the chosen Log Analytics Workspace.
-
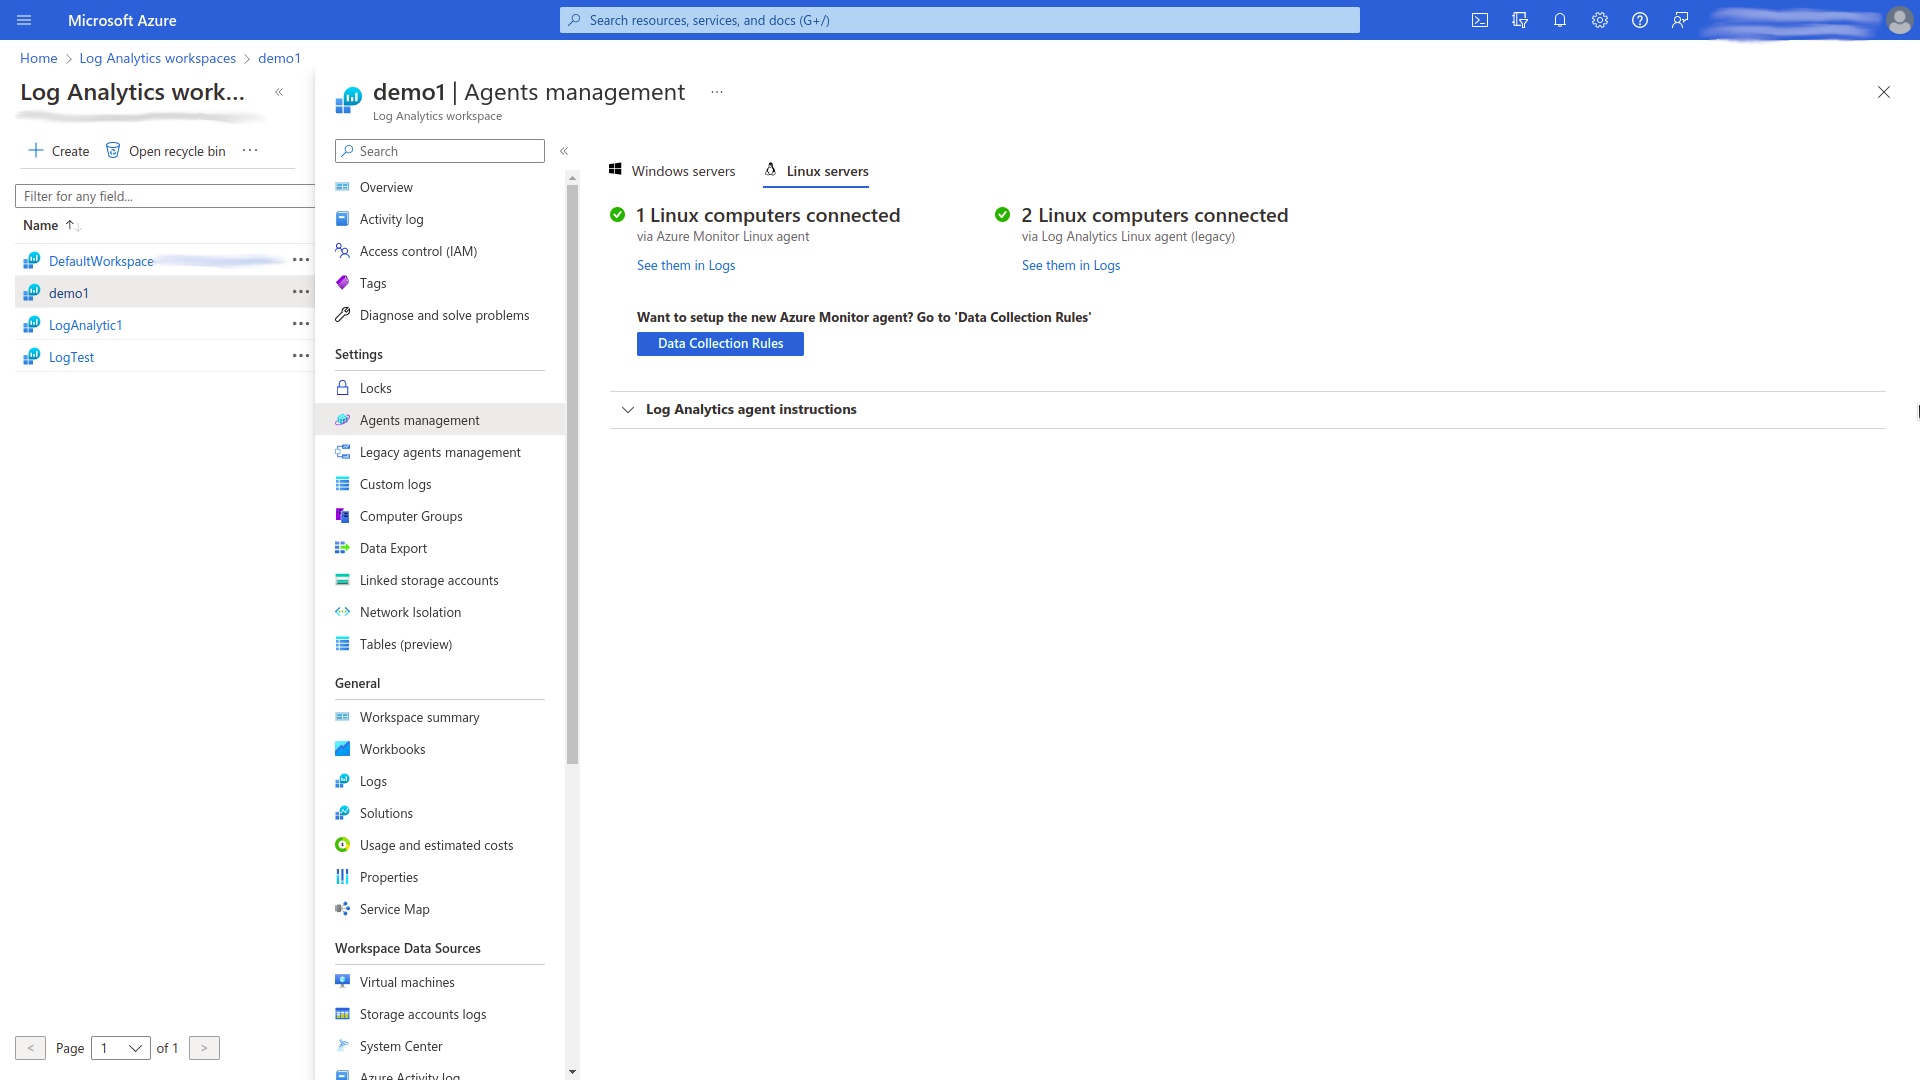
Open the Agents management page/tab of chosen Log Analytics Workspace, chose an appropriate servers page/tab (Windows servers or Linux servers), and then press the Data Collection Rules button and create data collection rules in the following way:
- Add rule name.
- Select the appropriate subscription.
- Select the appropriate resource group (it should be the same as for a chosen Log Analytics Workspace).
- Select the region.
- Select a platform type depending on the operating system installed on virtual machines previously connected to the Log Analytics Workspace (Windows, Linux, or Custom).
- Add resources (tab Resources) by selecting the resource group that the virtual machines belong to.
- Add data source (tab Collect and deliver) by selecting Performance counters as a data source, and then configure performance counters (i.e. CPU, Memory, Disk, Network) by setting appropriate sample rates. Then Select the destination(s) for where the data will be delivered (i.e. Azure Monitor Log or Azure Monitor Metrics), and specify the appropriate Subscription and Account or Namespace (the name of Log Analytics Workspace). To add data sources properly, read Azure Monitor Pricing for more details.
-
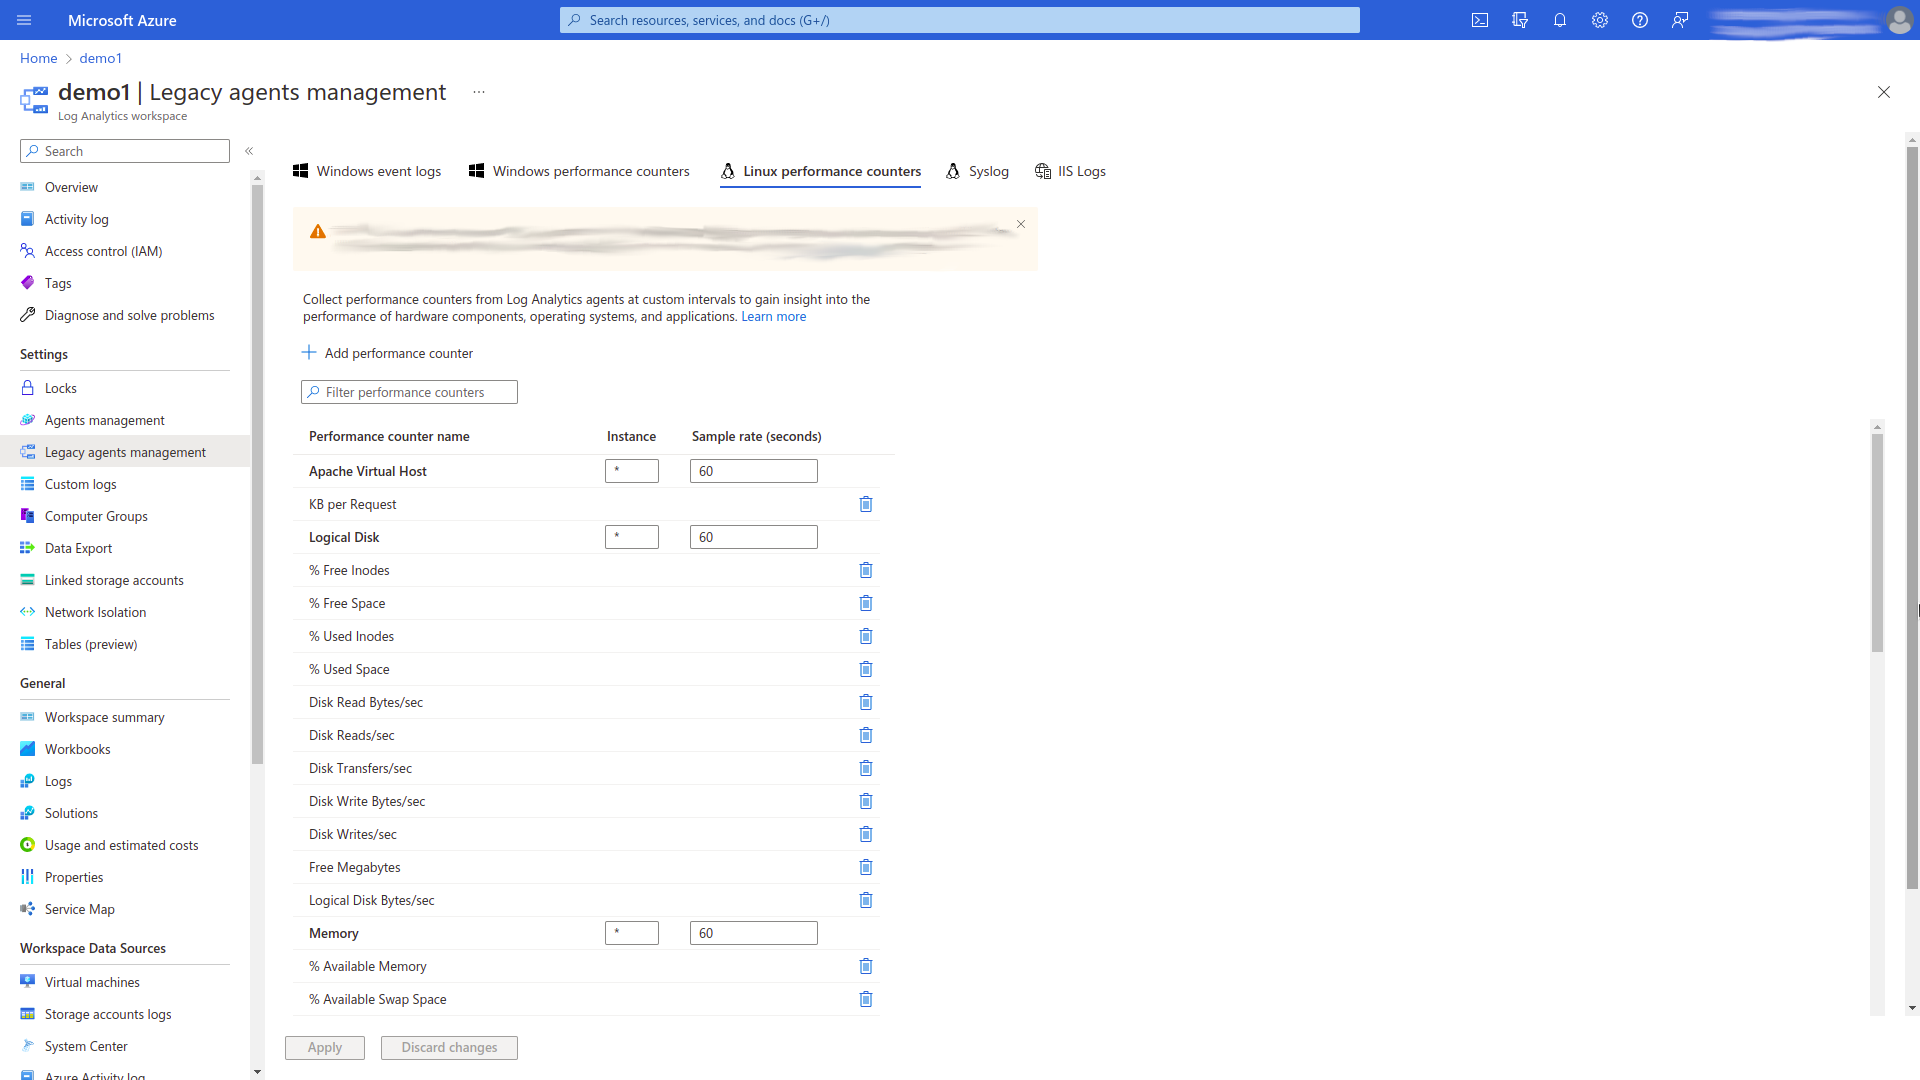
Open the Legacy agents management page/tab of chosen Log Analytics Workspace and select the appropriate performance counters type (e.g. Linux performance counters or Windows performance counters). After that, add the following performance counters:
- % Free Space
- Avg. Disk sec/Read
- Avg. Disk sec/Transfer
- Avg. Disk sec/Write
- Processes
and apply them.
-
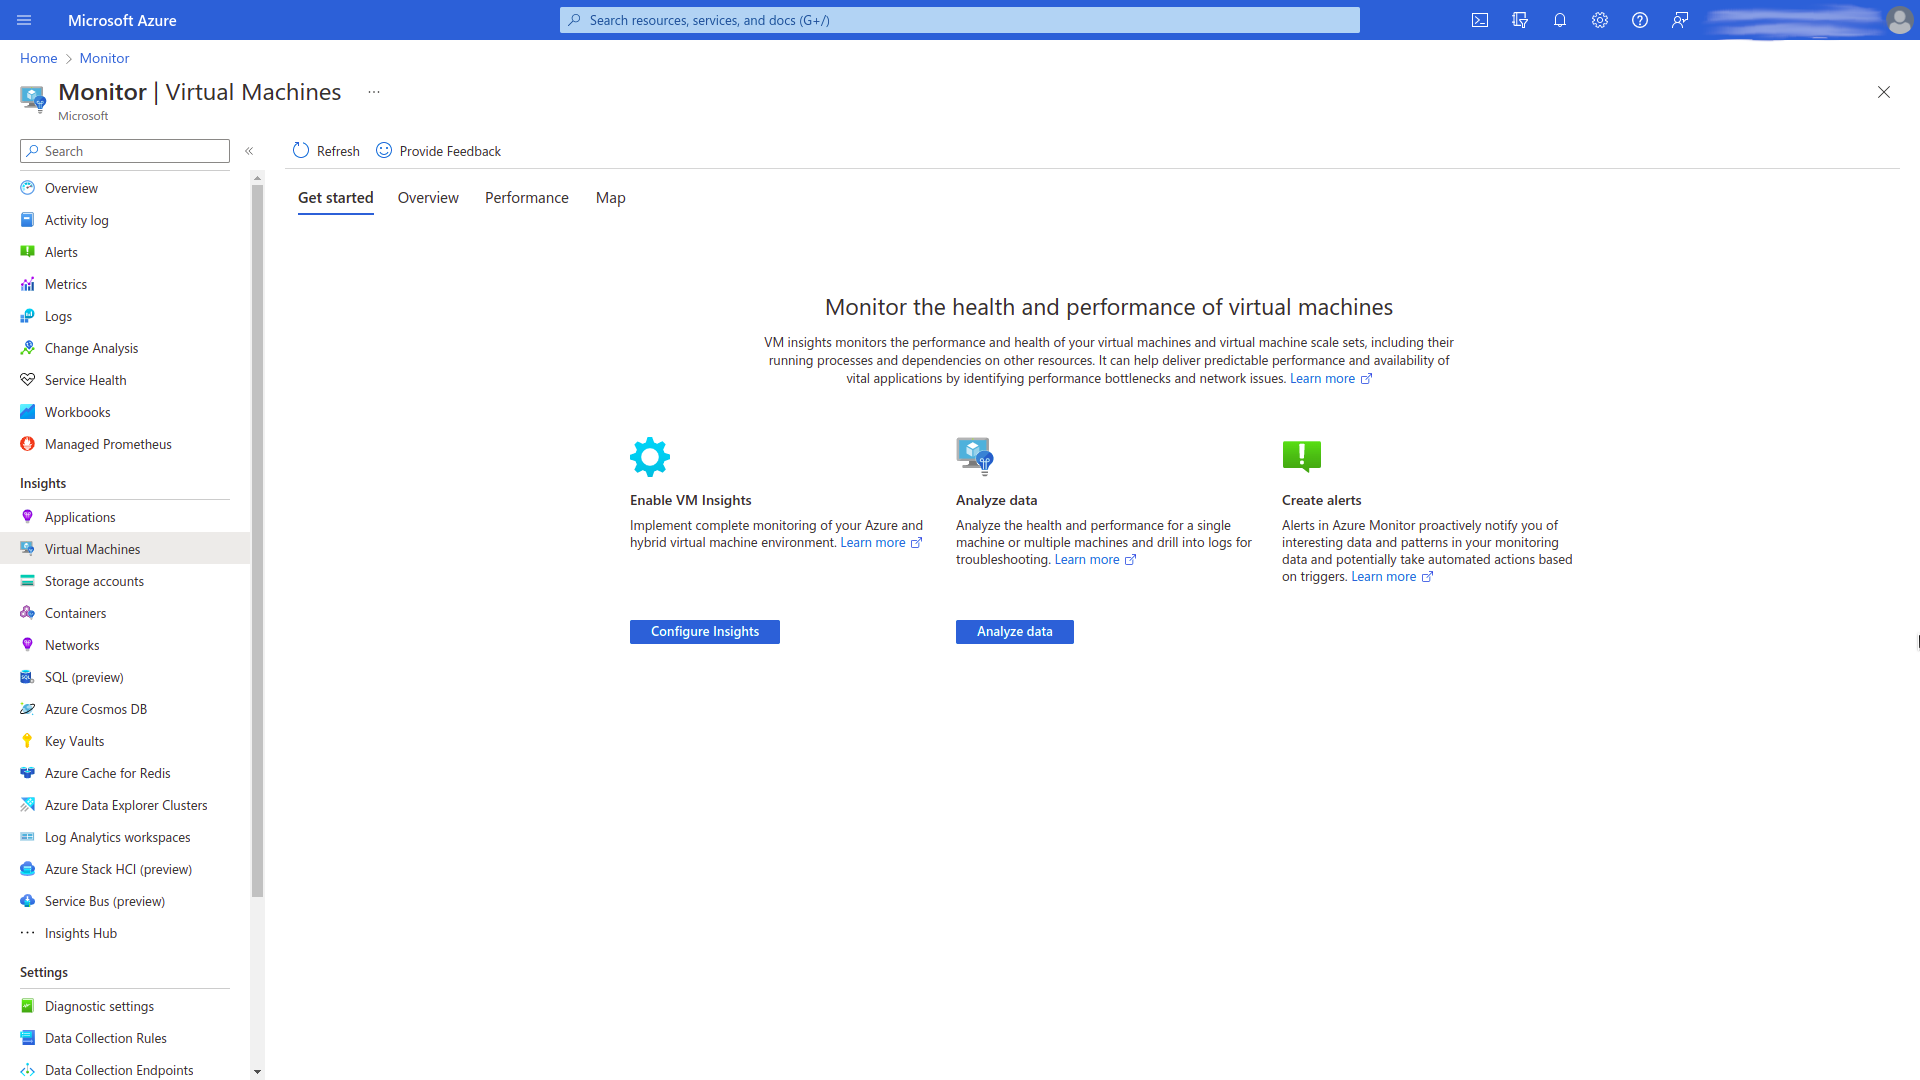
Open the Virtual Machines page/tab of Monitor and then press Configure Insights button. You will see lists of monitored and not monitored virtual machines sorted by the resource groups. Open the Not monitored tab and make enabled the monitoring of virtual machines that you connected to the Log Analytics Workspace previously. For this purpose press Enable for a chosen virtual machine, then press Enable button and use the following configuration:
- Enable insights using: the Azure Monitor agent.
- Subscription: Chose the appropriate subscription.
- Data collection rule: Chose the appropriate Data collection rule created in step 3.
After that, all virtual machines, which were enabled according to the instruction noted above, will appear on the Monitored tab.
-
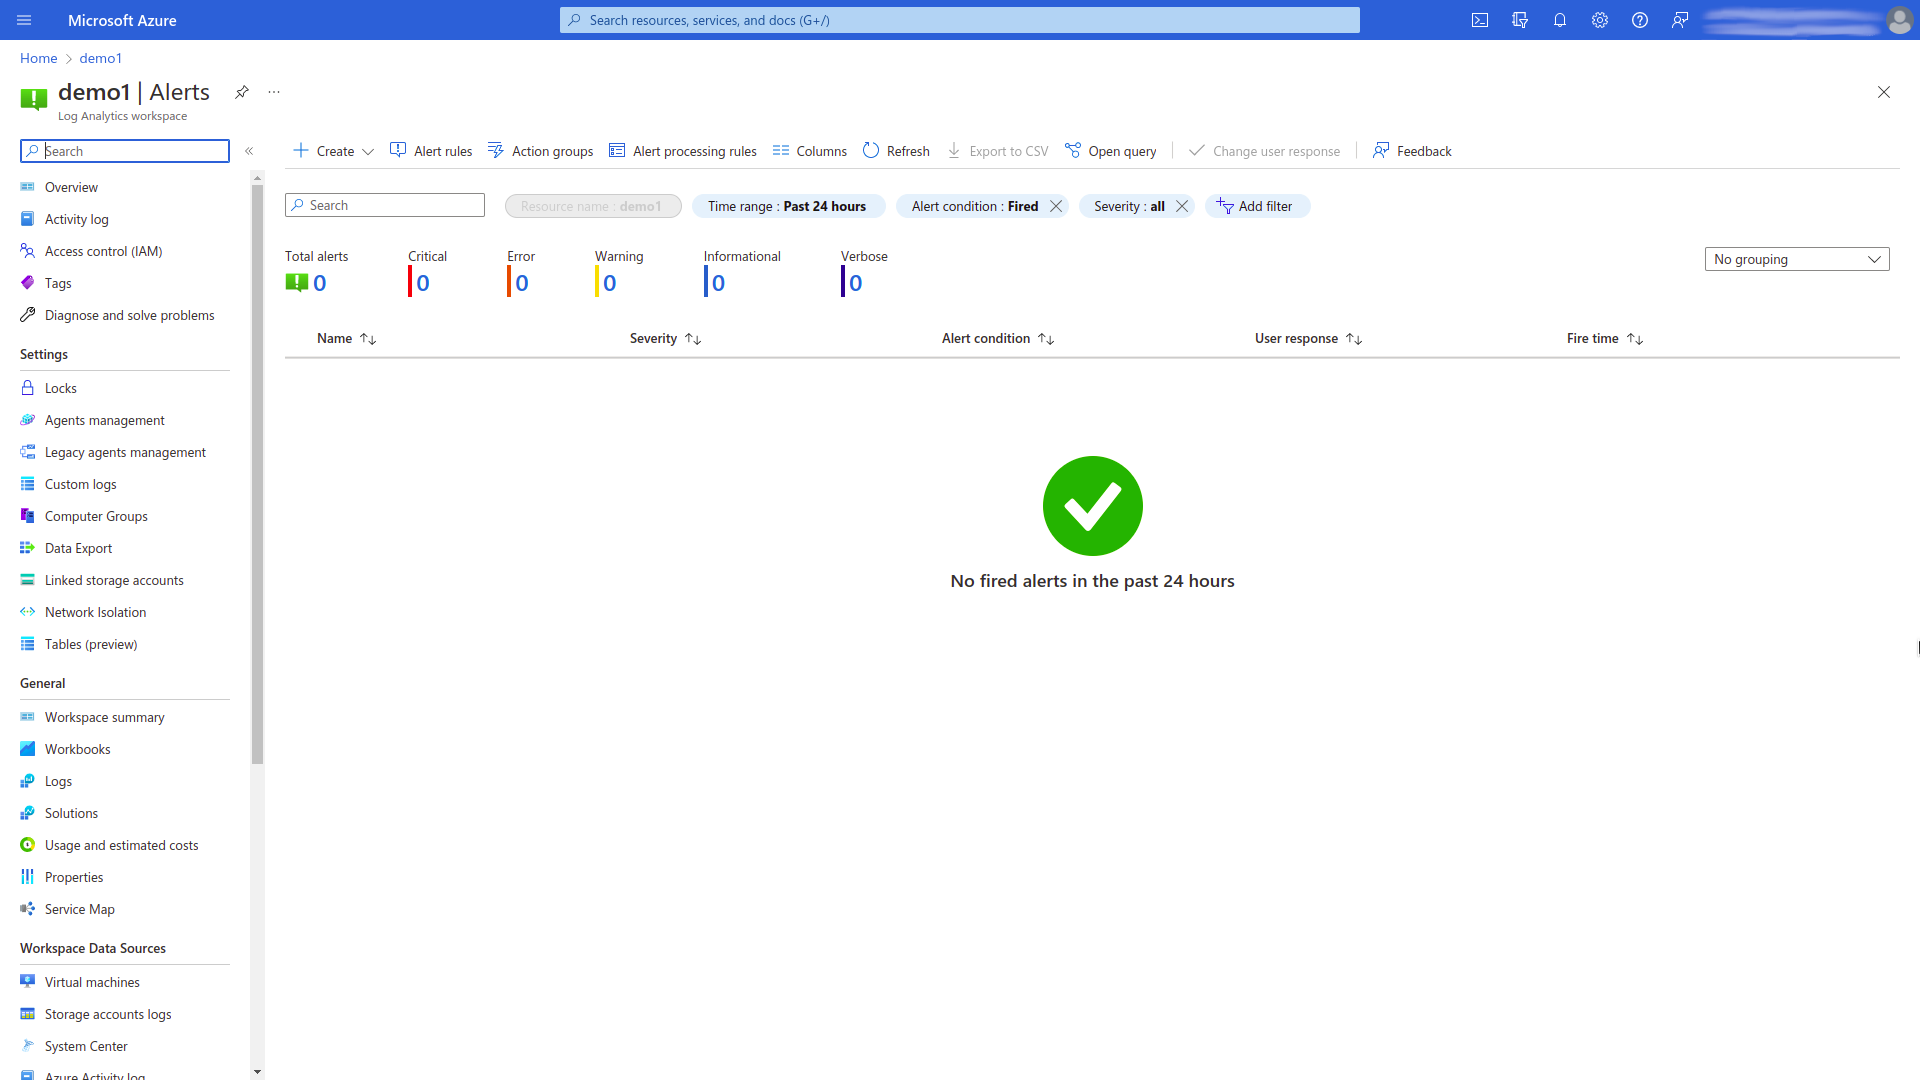
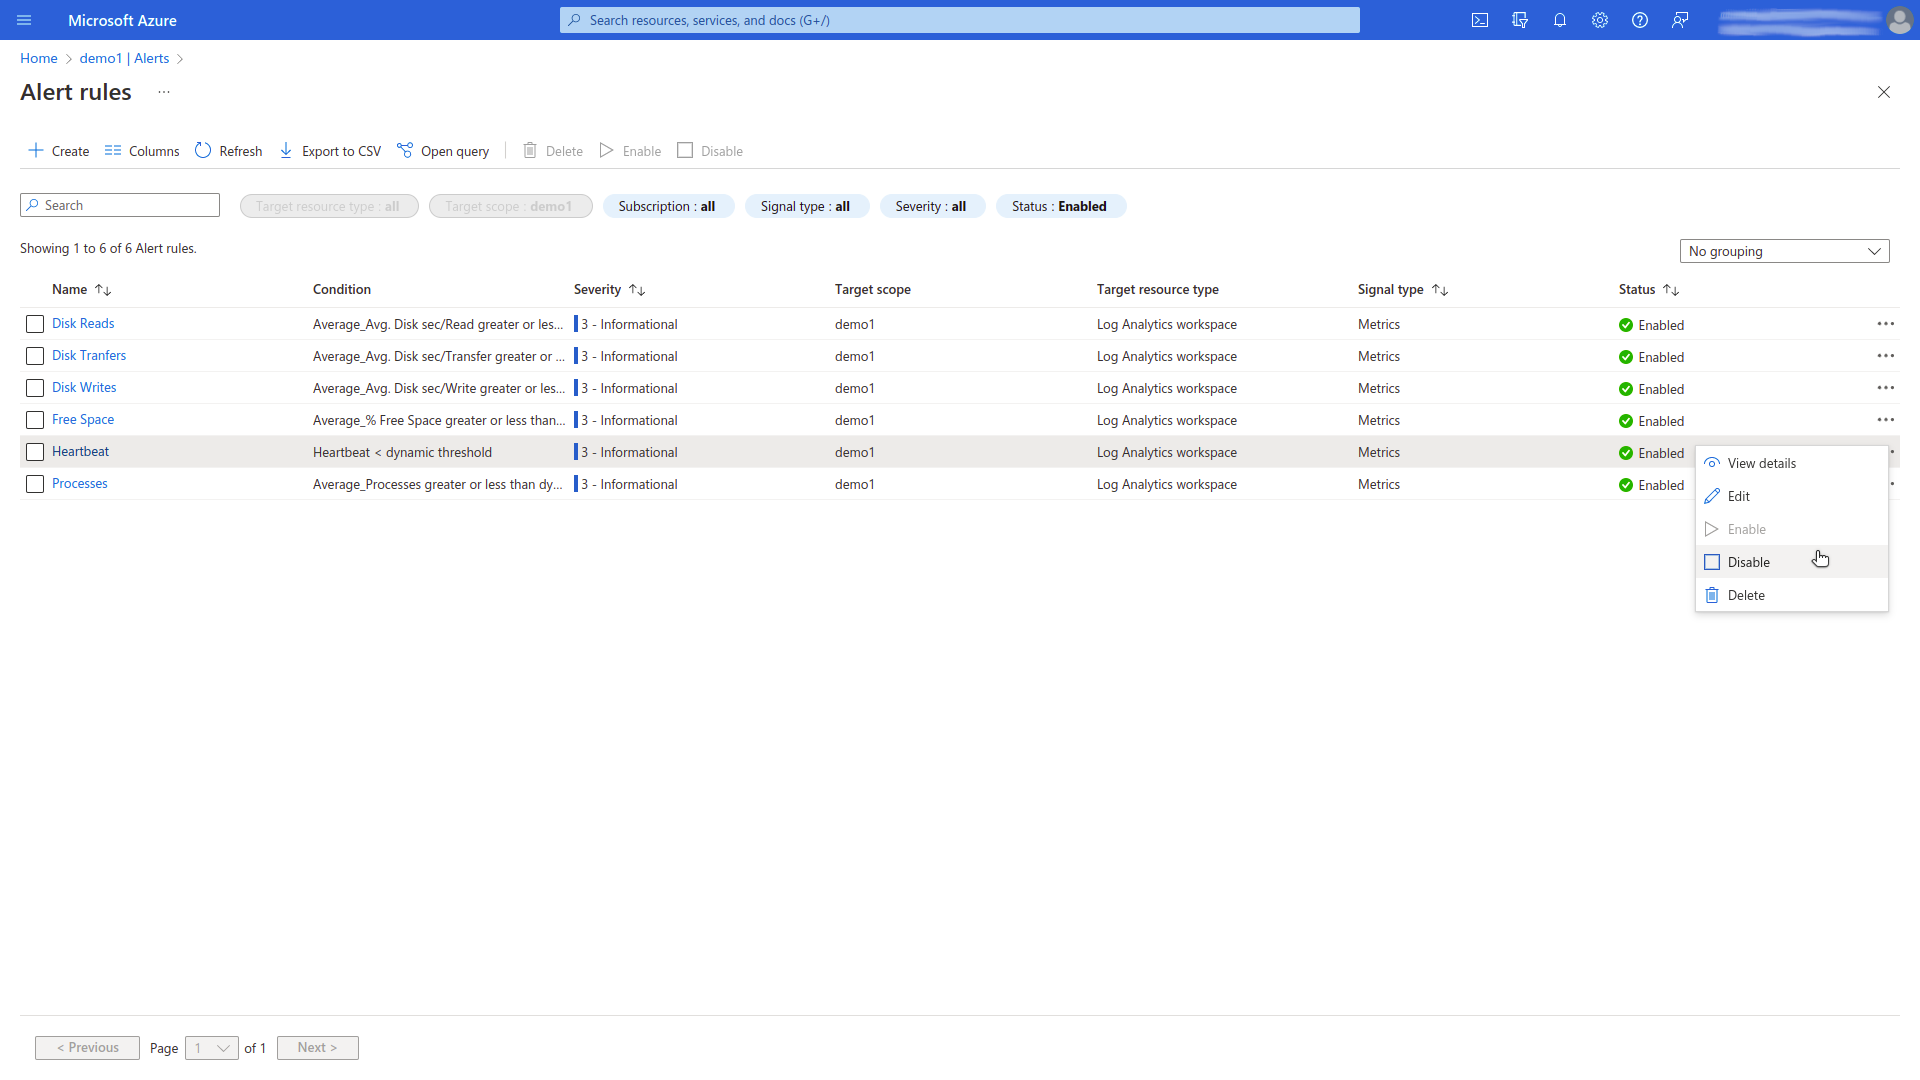
Open the Alerts page/tab of chosen Log Analytics Workspace, then open the page/tab Alert Rules and create the following alert rules:
- Heartbeat. Add condition with the following configuration:
- Tab Condition:
- Signal type: Metrics.
- Signal name: Heartbeat.
- Split by dimensions: Add those dimensions, which you need to monitor (i.e. Computer, OSType, Version, SourceComputerId).
- Alert logic: Set up a static or dynamic alert with appropriate logic.
- Tab Details:
- Resource group: Choose the resource group, to which Log Analytic Workspace belongs to.
- Severity: Specify the appropriate severity for the alert (0 - Critical, 1 - Error, 2 - Warning, 3 - Informational, 4 - Verbose).
- Alert rule name: Specify a name for a rule.
- Tab Condition:
- Free Space. Add condition with the following configuration:
- Tab Condition:
- Signal type: Metrics.
- Signal name: % Free Space.
- Split by dimensions: Add those dimensions, which you need to monitor (i.e. Computer, ObjectName, InstanceName, CounterPath, SourceSystem).
- Alert logic: Set up a static or dynamic alert with appropriate logic.
- Tab Details:
- Resource group: Choose the resource group, to which Log Analytic Workspace belongs to.
- Severity: Specify the appropriate severity for the alert (0 - Critical, 1 - Error, 2 - Warning, 3 - Informational, 4 - Verbose).
- Alert rule name: Specify a name for a rule.
- Tab Condition:
- Disk Reads. Add condition with the following configuration:
- Tab Condition:
- Signal type: Metrics.
- Signal name: Avg. Disk sec/Read.
- Split by dimensions: Add those dimensions, which you need to monitor (i.e. Computer, ObjectName, InstanceName, CounterPath, SourceSystem).
- Alert logic: Set up a static or dynamic alert with appropriate logic.
- Tab Details:
- Resource group: Choose the resource group, to which Log Analytic Workspace belongs to.
- Severity: Specify the appropriate severity for the alert (0 - Critical, 1 - Error, 2 - Warning, 3 - Informational, 4 - Verbose).
- Alert rule name: Specify a name for a rule.
- Tab Condition:
- Disk Writes. Add condition with the following configuration:
- Tab Condition:
- Signal type: Metrics.
- Signal name: Avg. Disk sec/Write.
- Split by dimensions: Add those dimensions, which you need to monitor (i.e. Computer, ObjectName, InstanceName, CounterPath, SourceSystem).
- Alert logic: Set up a static or dynamic alert with appropriate logic.
- Tab Details:
- Resource group: Choose the resource group, to which Log Analytic Workspace belongs to.
- Severity: Specify the appropriate severity for the alert (0 - Critical, 1 - Error, 2 - Warning, 3 - Informational, 4 - Verbose).
- Alert rule name: Specify a name for a rule.
- Tab Condition:
- Disk Transfers. Add condition with the following
configuration:
- Tab Condition:
- Signal type: Metrics.
- Signal name: Avg. Disk sec/Transfer.
- Split by dimensions: Add those dimensions, which you need to monitor (i.e. Computer, ObjectName, InstanceName, CounterPath, SourceSystem).
- Alert logic: Set up a static or dynamic alert with appropriate logic.
- Tab Details:
- Resource group: Choose the resource group, to which Log Analytic Workspace belongs to.
- Severity: Specify the appropriate severity for the alert (0 - Critical, 1 - Error, 2 - Warning, 3 - Informational, 4 - Verbose).
- Alert rule name: Specify a name for a rule.
- Tab Condition:
- Processes. Add condition with the following configuration:
- Tab Condition:
- Signal type: Metrics.
- Signal name: Processes.
- Split by dimensions: Add those dimensions, which you need to monitor (i.e. Computer, ObjectName, InstanceName, CounterPath, SourceSystem).
- Alert logic: Set up a static or dynamic alert with appropriate logic.
- Tab Details:
- Resource group: Choose the resource group, to which Log Analytic Workspace belongs to.
- Severity: Specify the appropriate severity for the alert (0 - Critical, 1 - Error, 2 - Warning, 3 - Informational, 4 - Verbose).
- Alert rule name: Specify a name for a rule.
- Tab Condition:
- Heartbeat. Add condition with the following configuration:
Thereafter, you can verify the metric collection using Azure Metrics Charts. To see metrics in Zenoss you need to wait for one monitoring cycle, then data points will appear on the corresponding graphs.
Remarks
- If for some reason you don't add some performance counters types, listed in step 4, and (or) don't create some alert rules, noted in step 6, then those metrics will not appear in Zenoss.
- If for some reason you don't want to collect some metrics, which you collected previously, you can change the status of appropriate Alert rules, changing their state to Disable. After this, the data points will not be collected and represented on the corresponding graphs in Zenoss. Later you can Enable the chosen Alert rule again, and after the next monitoring cycle, the data points will be collected and then represented on the corresponding graphs in Zenoss. For more information read Azure Monitor Pricing: Alert rules.
Prerequisites
Monitoring configuration
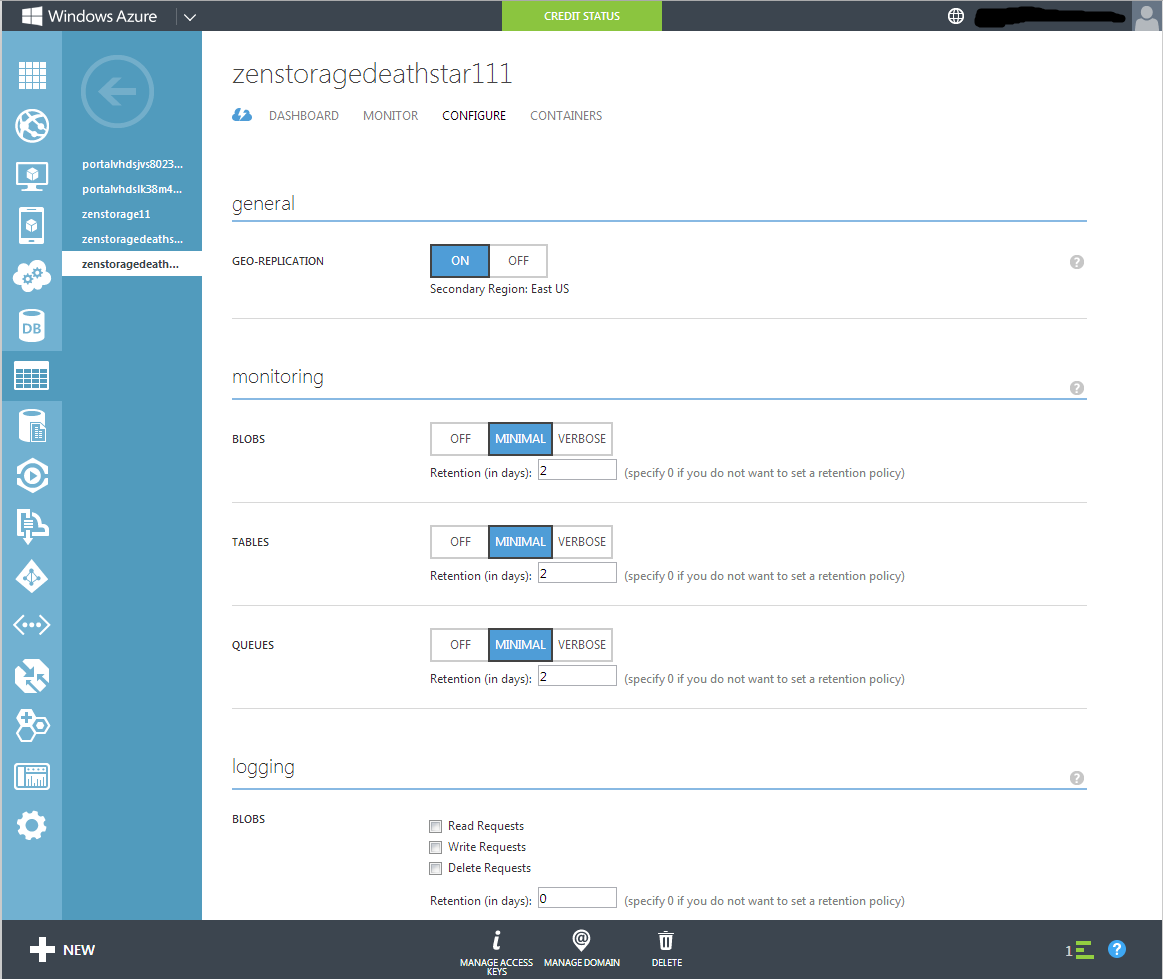
Data monitoring and event triggering will only work if monitoring configuration on Azure Management Page is enabled with at least 1-2 days retention.
You can configure monitoring more precisely, such as monitoring for just specified components or monitoring with restricted permissions. To do so, set up monitoring using the applicable default user role, either Reader or Contributor, or create a Custom role. Then, set up all of the required permissions for it.
For more details, see Roles, permissions, and security in Azure Monitor.
Network access to Azure endpoints
Your Zenoss collector should be able to establish HTTP and HTTPS (ports 80 and 443) connections to the following addresses:
- *.blob.core.windows.net
- *.queue.core.windows.net
- *.table.core.windows.net
- *.servicebus.windows.net
- management.core.windows.net
- management.azure.com
Azure ZenPack uses the following endpoints at
https://management.azure.com for modeling and monitoring of ARM
resources:
/subscriptions/<subscription>
/subscriptions/<subscription>/locations
/subscriptions/<subscription>/providers/Microsoft.Compute/location/<location>/usages
/subscriptions/<subscription>/providers/Microsoft.Network/location/<location>/usages
/subscriptions/<subscription>/resourcegroups
/subscriptions/<subscription>/resourceGroups/<resource_group>/providers/Microsoft.Compute/virtualMachines
/subscriptions/<subscription>/resourceGroups/<resource_group>/providers/Microsoft.Compute/virtualMachines/<vm>
/subscriptions/<subscription>/resourceGroups/<resource_group>/providers/Microsoft.Network/networkInterfaces/<interface>
/subscriptions/<subscription>/resourceGroups/<resource_group>/providers/Microsoft.Network/publicIPAddresses/<address>
/subscriptions/<subscription>/resourceGroups/<resource_group>/providers/Microsoft.Network/virtualnetworks
/subscriptions/<subscription>/resourceGroups/<resource_group>/providers/Microsoft.Network/virtualnetworks/<network>
/subscriptions/<subscription>/resourceGroups/<resource_group>/providers/Microsoft.Storage/storageAccounts
/subscriptions/<subscription>/resourceGroups/<resource_group>/providers/Microsoft.Storage/storageAccounts/<account>
/subscriptions/<subscription>/resourceGroups/<resource_group>/providers/Microsoft.Storage/storageAccounts/<account>/listKeys
/subscriptions/<subscription>/resourceGroups/<resource_group>/providers/Microsoft.Web/sites
Troubleshooting
If you encounter any issues with Zenpack installation, please make sure that you have restarted zenoss after installation and that your target disk has enough free memory and reads permissions enabled. If device adding fails, try to restart your browser and make sure that you have specified a correct id and path to the certificate file (e.g. /var/zenoss/MSAzure.pem). In the case of any issues when uninstalling this Zenpack, please remove all devices first.
Note that device monitoring requires zenpython daemon to be constantly
running. If you have just enabled monitoring, try pressing Zoom in to
see the graphs. In the case of any issues, you can run zenpython daemon
in the foreground with zenpython run -v10 -c the command and check if
there are no exceptions. If zenpython runs without errors and prints
monitoring data to stdout, then you should check if monitoring templates
are bound to the subscription and its components.
If the device can not be modeled or monitored with the reason 'Server failed to authenticate the request' it may be caused by the wrong system time.
If you see multiple events showing "Connection timeout" while collecting metric data, you can increase zAzureConnectionPoolSize. The default size is 50.
General troubleshooting using Azure CLI tools
In order to use this approach, Azure CLI tools need to be installed first, as they are included neither in Zenoss, nor in Microsoft Azure ZenPack. Please check the official documentation Install Azure CLI
The easiest way is to use Azure CLI tools bundled in the Docker container When installed, login action must be performed before use:
az login --service-principal -u <zAzureApplicationID> -p <zAzureSecretKey> -t <zAzureTenantID>`
After successful login, different objects can be queried. Some examples are below:
- Retrieve Resource Groups
az group list - Retrieve Virtual Machines
az vm list - Retrieve Storage Accounts
az storage account list
For more information, use az help.
Output from the commands above may be very large. Fortunately, the
container microsoft/azure-cli includes
jq utility. It may
also help to filter any outputs. The following example filters
everything but id, name, and resourceGroup from each item in the
Storage Account listing:
az storage account list | jq '.[] | {id: .id, name: .name, group: .resourceGroup}'
Billing Charts
After modeling the device for the first time it will start collecting billing data for the current month. Data collection starts from the first day of the month up to the current day. It will add another day every five minutes until all days of a current month are collected.
The billing information shown on the overview page is from the beginning of the month to the current day.
Note: In case billing data is missing, check if related credentials are correctly filled and check through [Azure Enterprise Portal](https://ea.azure.com/){.external-link} whether zAzureEAAccessKey is not expired. To regenerate that key, follow the steps described in the `Billing Charts for Enterprise Azure Customers` section of this documentation.
Storage Accounts
Please grant role Storage Contributor to the Zenoss application if the
following error message occurs during the modeling/monitoring of Storage
Accounts:
The client '<tenant_id>' with object id '<tenant_id>' does not have authorization to perform action 'Microsoft.Storage/storageAccounts/listKeys/action' over scope '/subscriptions/<subscription_id>/resourceGroups/<resource_group>/providers/Microsoft.Storage/storageAccounts/<storage_account>
Alternatively, you can find all available roles at Built-in roles for Azure role-based access control
and choose another one with
Microsoft.Storage/storageAccounts/listKeys/action action permission.
Limitations
Due to limitations of REST API, this ZenPack does not monitor some of Azure services:
- Mobile services
- Media services
- Active Directory
Known Issues
- Some 6.3.x or Cloud versions of Zenoss could show a Warning during Azure ZenPack installation similar to the following. This is not an installation blocker.
-
All components will be recreated when upgrading from v1.x to v2.0.0. If there are existing events for the old components, you will need to manually clear them after remodeling.
2018-07-05 11:15:24 WARNING zen.modelindex Error retrieving indexed value for <DeviceClass at Azure>.idx_zProperties:
Upgrade to 1.3.1
On Zenoss 5/6.x after an upgrade to version 1.3.1,
Azure Subscription ID field on the device overview page may not be
masked as a password. In this case restart service
Infrastructure/memcached in Control Center.
Upgrade to 2.1.0
Data for previous periods could be missed for App Service Plan, Function App, and App Service components due to improvements in the modeling process, and due to adding new Azure Functions components with all required relations.
Installed Items
Installing this ZenPack will add the following items to your Zenoss system.
Device Classes
- /Azure
Event Classes
- /Azure
Modeler Plugins
- azure.Compute
- azure.CosmoDB
- azure.KeyVault
- azure.Kubernetes
- azure.RedisCaches
- azure.SendGrid
- azure.ServiceBus
- azure.SQL
- azure.Storage
- azure.Subscription
- azure.Web
Additional Modeler Plugins
- azure.ExpressRoute
- azure.Firewall
- azure.LogAnalytics
- azure.MySQL
- azure.PostgreSQL
Datasource Types
- AzureMonitoringDataSource
- AzureEABillingDataSource
- AzureMetricDataSource
- AzureActivityLogDataSource
- AzureInstanceStatus
- AzureLocation
- AzureSubscription
- AzureSSLCertificate
- AzureWebJob
- AzureKubernetes
Monitoring Templates
- AzureSubscription (in /Azure)
- EstimatedCharges (in /Azure)
Device Types
- AzureSubscription (in /Azure)
Component Types
- AzureLocation ("Location") (on AzureSubscription)
- AzureResourceGroup ("Resource Group") (on AzureSubscription)
- AzureStorageService ("Classic Storage Service") (on AzureResourceGroup)
- ARMVirtualNetworkSite ("Virtual Network Site") (on AzureResourceGroup)
- ARMVirtualMachine ("Instance") (on AzureResourceGroup)
- ARMDisk ("Disk") (on AzureInstance)
- AzureServerFarm ("App Service Plan") (on AzureResourceGroup)
- ARMSite ("App Service") (on AzureServerFarm)
- AzureWebFunction ("Function App") (on AzureServerFarm)
- AzureWebJob ("Web Job") (on ARMSite)
- ARMSubnet ("Subnet") (on ARMVirtualNetworkSite)
- ARMContainer ("Container") (on AzureStorageService)
- AzureSQLServer ("SQL Server") (on AzureResourceGroup)
- AzureSQLDatabase ("SQL Database") (on AzureSQLServer)
- AzureSQLManagedInstance ("SQL ManagedInstance") (on AzureResourceGroup)
- AzureFirewall ("Firewall") (on AzureResourceGroup)
- AzureExpressRouteCircuit ("ExpressRoute Circuit") (on AzureResourceGroup)
- AzureLogAnalyticsWorkspace ("Log Analytics Workspace") (on AzureResourceGroup)
- AzureMySQLFlexibleServer ("MySQL Flexible Server") (on AzureResourceGroup)
- AzureMySQLSingleServer ("MySQL Single Server") (on AzureResourceGroup)
- AzurePostgreSQLFlexibleServer ("PostgreSQL Flexible Server") (on AzureResourceGroup)
- AzurePostgreSQLSingleServer ("PostgreSQL Single Server") (on AzureResourceGroup)
- AzureStorageService ("Classic Storage Service") (on AzureResourceGroup)
- AzureInstance ("Classic Instance") (on AzureResourceGroup)
- AzureCertificate ("SSL Certificate") (on AzureResourceGroup)
- AzureSendGrid ("Send Grid Account") (on AzureResourceGroup)
- AzureKeyVault ("Key Vault") (on AzureResourceGroup)
- AzureKubernetesCluster ("Kubernetes Cluster") (on AzureResourceGroup)
- AzureServiceBus ("Service Bus") (on AzureResourceGroup)
- AzureCosmosDBAccount ("Cosmos DB Account") (on AzureResourceGroup)
- RedisCache ("Redis Cache") (on AzureResourceGroup)
- AzureApplicationInsights ("Application Insight") (on AzureResourceGroup)
- AzureFunction ("Azure Function") (on AzureWebFunction)
Changes
3.0.1
- Fixed IP address representation for AKS instances (ZPS-6450)
- Added new monitoring templates for VCore-based SQL databases, Linux-based App Services, and Functions Apps, removed unsupported metrics for Cosmos DB Accounts and updated a list of unsupported Azure Locations (ZPS-8436)
- Tested with Zenoss Cloud, Zenoss 6.7.0 and Service Impact 5.6.0
3.0.0
- Added monitoring of Azure SQL Database Managed Instances (ZPS-8265)
- Added monitoring of Azure Log Analytics Workspaces (ZPS-8306)
- Added monitoring of Azure PostgreSQL Single Servers (ZPS-8281)
- Added monitoring of Azure PostgreSQL Flexible Servers (ZPS-8281)
- Added monitoring of Azure Firewalls (ZPS-8381)
- Added monitoring of Azure MySQL Single Servers (ZPS-8382)
- Added monitoring of Azure MySQL Flexible Servers (ZPS-8383)
- Added monitoring of Azure Express Route Circuits (ZPS-7806)
- Extended Azure Activity Log event details (ZPS-7074)
- Improved Azure Activity Log events processing (ZPS-7474)
- Tested with Zenoss Cloud, Zenoss 6.7.0, and Service Impact 5.5.5
2.2.1
- Fix modeling and monitoring through a HTTP and HTTPS proxy (ZPS-7305)
- Fix modeling when the disk component does not have a parent VM (ZPS-7291)
- Tested with Zenoss Cloud, Zenoss 6.5.0, and Service Impact 5.5.2
2.2.0
- Add ability to see billing data on SmartView/DashBoard
- Fix displaying billing graphs on the overview page (ZPS-6880)
- Fix model when WebJob does not have relation to App Service (ZPS-6957)
- Fix model with non alpha numeric characters in the Instance name (ZPS-6652)
- Fix model with non alpha numeric characters in the resourceGroup name (ZPS-6957)
- Tested with Zenoss 6.4.x, Zenoss 6.5.x, Zenoss Cloud and Service Impact 5.5.1
2.1.0
- Fix events for Service Plan components in case all resources are stopped (ZPS-5652)
- Fix Random Monitoring of Instance failed or GET Azure metrics unsuccessful failures events (ZPS-6069)
- Add new Application Insights and Azure Function components
- Fix potential KeyError traceback when modeling (ZPS-6211)
- Ensure complete component model after every modeling attempt (ZPS-6258)
- Update migration scripts to avoid UI flares for some specific Zenoss configurations (ZPS-5737)
- Tested with Zenoss 6.3.x, Zenoss 6.4.x, Zenoss Cloud and Service Impact 5.5.1
2.0.0
- Switch to pure REST API queries in place of Microsoft SDK
- Add Azure Metric datasource to collect monitoring data from Azure
- Add Azure Activity Log datasource to collect Azure events
- Fix Azure ZenPack and Exchange Installation Conflict (ZPS-4335)
- Tested with Zenoss 6.3.x and Zenoss Cloud. Impact 5.3.4
1.3.3
- Fix Azure ZenPack and Exchange Installation Conflict (ZPS-5112)
1.3.2
- Handle inconsistent network configuration (ZPS-3802)
- Fix subscription metrics on the device overview page (ZPS-3960)
- Improve debug logging to detect network connectivity issues (ZPS-3474)
- Fix Location link on Classic Disk components (ZPS-4051)
- Fix grid links in Zenoss Cloud (ZPS-4050, ZPS-4257)
- Fix guest device links in Zenoss Cloud (ZPS-4252)
- Remove duplicated Subscription from details for several components (ZPS-4052)
- Fix location value in details for several components (ZPS-4139)
- Update zProperties description (ZPS-4194)
- Update field description on New Device dialog window (ZPS-4194)
- Do not generate Unattached VHD report on page load, require user's confirmation (ZPS-4177)
- Leverage ZenPackLib (ZPS-4259)
- Update DynamicView and Impact icons (ZPS-4303)
- Tested on Zenoss Resource Manager 5.3.3, 6.2.0, Zenoss Cloud with Service Impact 5.3.1
1.3.1
- Fix Error in AzureCollector: 'NoneType' object has no attribute 'uri' (ZPS-1760)
- Hide credentials from logs and overview page (ZPS-3479)
- Optimize zenpython memory usage during monitoring (ZPS-1939)
- Handle case when VM and Network Adapter are in different Resource Groups (ZPS-3480)
- Handle modeling of undocumented custom VM images (ZPS-3574)
- Describe modeling and monitoring through a proxy (ZPS-3539)
- Tested with Zenoss Resource Manager 5.3.3, 6.1.2, Zenoss Resource Manager 4.2.5 RPS 743 and Service Impact 5.3.0
1.3.0
- Strict rules for device ID
- Support of Blob Storage Account
- Fix modeling of stopped instance
- Support of Azure Cloud Solution Provider (ASM) subscription
- Separate AzureBlobs modeler plugin to control whether model blobs or not
1.2.0
- Add support for resources deployed in Azure Resource Manager deployment model
- Add bidirectional associating of Azure Instances (Classic Instances) with guest operation systems
1.1.1
- Fix ID processing for Resource Manager deployment model
1.1.0
- Add billing data collection and charting for Azure Enterprise accounts
1.0.4
- Add possibility to skip monitoring of particular components
1.0.3
- 5.x support.
- Monitoring performance improved.
- Various bug fixes.
